Free Statistics

of Irreproducible Research!

Author's title

Author*The author of this computation has been verified*
R Software Modulerwasp_autocorrelation.wasp
Title produced by software(Partial) Autocorrelation Function
Date of computationThu, 22 Dec 2016 10:55:28 +0100
Cite this page as followsStatistical Computations at FreeStatistics.org, Office for Research Development and Education, URL https://freestatistics.org/blog/index.php?v=date/2016/Dec/22/t1482400794zqmtjmbqfnt6gsx.htm/, Retrieved Sun, 28 Apr 2024 21:36:47 +0000
Statistical Computations at FreeStatistics.org, Office for Research Development and Education, URL https://freestatistics.org/blog/index.php?pk=302523, Retrieved Sun, 28 Apr 2024 21:36:47 +0000
QR Codes:

Original text written by user:
IsPrivate?No (this computation is public)
User-defined keywords
Estimated Impact108
Family? (F = Feedback message, R = changed R code, M = changed R Module, P = changed Parameters, D = changed Data)
-       [(Partial) Autocorrelation Function] [partial N2788] [2016-12-22 09:55:28] [e7c866b75ad2fc21ab540ba3a0a42299] [Current]
Feedback Forum

Post a new message
Dataseries X:
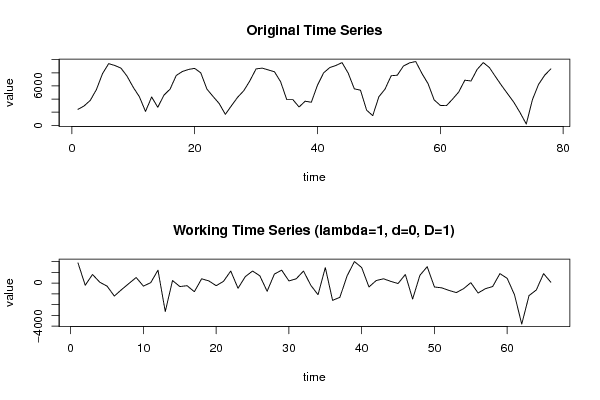
2440
2960
3800
5440
7880
9400
9120
8720
7480
5800
4360
2120
4320
2760
4600
5520
7600
8200
8520
8680
8000
5520
4400
3320
1680
3000
4280
5280
6800
8600
8720
8440
8160
6640
3920
3920
2800
3680
3520
6120
8000
8800
9120
9560
7960
5560
5360
2320
1480
4360
5520
7560
7640
9040
9520
9720
7920
6360
3880
3040
3000
4000
5080
6880
6760
8520
9560
8800
7400
6040
4760
3480
1920
200
3920
6240
7640
8600


Summary of computational transaction
Raw Input view raw input (R code)
Raw Outputview raw output of R engine
Computing time2 seconds
R ServerBig Analytics Cloud Computing Center

\begin{tabular}{lllllllll}
\hline
Summary of computational transaction \tabularnewline
Raw Input view raw input (R code)  \tabularnewline
Raw Outputview raw output of R engine  \tabularnewline
Computing time2 seconds \tabularnewline
R ServerBig Analytics Cloud Computing Center \tabularnewline
\hline
\end{tabular}
%Source: https://freestatistics.org/blog/index.php?pk=302523&T=0

[TABLE]
[ROW]
Summary of computational transaction[/C][/ROW] [ROW]Raw Input[/C] view raw input (R code) [/C][/ROW] [ROW]Raw Output[/C]view raw output of R engine [/C][/ROW] [ROW]Computing time[/C]2 seconds[/C][/ROW] [ROW]R Server[/C]Big Analytics Cloud Computing Center[/C][/ROW] [/TABLE] Source: https://freestatistics.org/blog/index.php?pk=302523&T=0

Globally Unique Identifier (entire table): ba.freestatistics.org/blog/index.php?pk=302523&T=0

As an alternative you can also use a QR Code:  

The GUIDs for individual cells are displayed in the table below:

Summary of computational transaction
Raw Input view raw input (R code)
Raw Outputview raw output of R engine
Computing time2 seconds
R ServerBig Analytics Cloud Computing Center


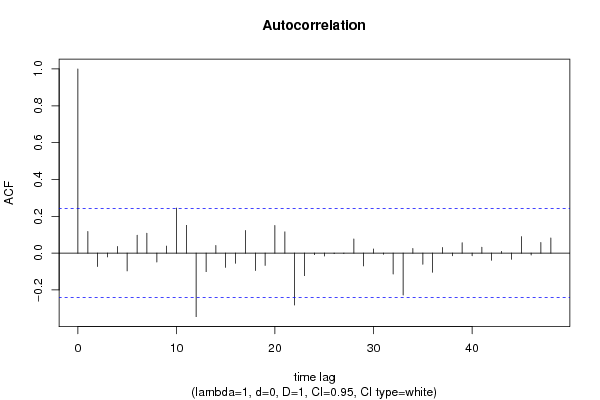
Autocorrelation Function
Time lag kACF(k)T-STATP-value
10.1178020.9570.171022
2-0.072949-0.59260.277723
3-0.020389-0.16560.434472
40.0356410.28960.386533
5-0.096303-0.78240.218398
60.0968290.78660.217152
70.1077640.87550.192245
8-0.04845-0.39360.347569
90.0379710.30850.379345
100.2445391.98660.025558
110.1507021.22430.112594
12-0.344883-2.80180.003331
13-0.100461-0.81610.208676
140.0418690.34010.367414
15-0.077332-0.62820.266005
16-0.054775-0.4450.328891
170.1227020.99680.161242
18-0.094318-0.76620.223131
19-0.066493-0.54020.295442
200.1497021.21620.114123
210.1153020.93670.176159
22-0.281496-2.28690.012709
23-0.122278-0.99340.162075
24-0.00805-0.06540.474027
25-0.015524-0.12610.450011
26-0.002806-0.02280.490942
27-0.001796-0.01460.494202
280.0766790.62290.267735
29-0.069346-0.56340.287545
300.0223560.18160.428218
31-0.006238-0.05070.479869
32-0.11343-0.92150.18007
33-0.227797-1.85060.03435
340.0250550.20350.419667
35-0.060866-0.49450.311305
36-0.103464-0.84050.20182
370.0310250.2520.400894
38-0.014504-0.11780.453279
390.0565320.45930.323774
40-0.014341-0.11650.453803
410.0318840.2590.398209
42-0.03909-0.31760.375906
430.0094080.07640.469654
44-0.03302-0.26830.39467
450.0897670.72930.234209
46-0.009781-0.07950.468453
470.0580680.47170.319331
480.0825990.6710.25227

\begin{tabular}{lllllllll}
\hline
Autocorrelation Function \tabularnewline
Time lag k & ACF(k) & T-STAT & P-value \tabularnewline
1 & 0.117802 & 0.957 & 0.171022 \tabularnewline
2 & -0.072949 & -0.5926 & 0.277723 \tabularnewline
3 & -0.020389 & -0.1656 & 0.434472 \tabularnewline
4 & 0.035641 & 0.2896 & 0.386533 \tabularnewline
5 & -0.096303 & -0.7824 & 0.218398 \tabularnewline
6 & 0.096829 & 0.7866 & 0.217152 \tabularnewline
7 & 0.107764 & 0.8755 & 0.192245 \tabularnewline
8 & -0.04845 & -0.3936 & 0.347569 \tabularnewline
9 & 0.037971 & 0.3085 & 0.379345 \tabularnewline
10 & 0.244539 & 1.9866 & 0.025558 \tabularnewline
11 & 0.150702 & 1.2243 & 0.112594 \tabularnewline
12 & -0.344883 & -2.8018 & 0.003331 \tabularnewline
13 & -0.100461 & -0.8161 & 0.208676 \tabularnewline
14 & 0.041869 & 0.3401 & 0.367414 \tabularnewline
15 & -0.077332 & -0.6282 & 0.266005 \tabularnewline
16 & -0.054775 & -0.445 & 0.328891 \tabularnewline
17 & 0.122702 & 0.9968 & 0.161242 \tabularnewline
18 & -0.094318 & -0.7662 & 0.223131 \tabularnewline
19 & -0.066493 & -0.5402 & 0.295442 \tabularnewline
20 & 0.149702 & 1.2162 & 0.114123 \tabularnewline
21 & 0.115302 & 0.9367 & 0.176159 \tabularnewline
22 & -0.281496 & -2.2869 & 0.012709 \tabularnewline
23 & -0.122278 & -0.9934 & 0.162075 \tabularnewline
24 & -0.00805 & -0.0654 & 0.474027 \tabularnewline
25 & -0.015524 & -0.1261 & 0.450011 \tabularnewline
26 & -0.002806 & -0.0228 & 0.490942 \tabularnewline
27 & -0.001796 & -0.0146 & 0.494202 \tabularnewline
28 & 0.076679 & 0.6229 & 0.267735 \tabularnewline
29 & -0.069346 & -0.5634 & 0.287545 \tabularnewline
30 & 0.022356 & 0.1816 & 0.428218 \tabularnewline
31 & -0.006238 & -0.0507 & 0.479869 \tabularnewline
32 & -0.11343 & -0.9215 & 0.18007 \tabularnewline
33 & -0.227797 & -1.8506 & 0.03435 \tabularnewline
34 & 0.025055 & 0.2035 & 0.419667 \tabularnewline
35 & -0.060866 & -0.4945 & 0.311305 \tabularnewline
36 & -0.103464 & -0.8405 & 0.20182 \tabularnewline
37 & 0.031025 & 0.252 & 0.400894 \tabularnewline
38 & -0.014504 & -0.1178 & 0.453279 \tabularnewline
39 & 0.056532 & 0.4593 & 0.323774 \tabularnewline
40 & -0.014341 & -0.1165 & 0.453803 \tabularnewline
41 & 0.031884 & 0.259 & 0.398209 \tabularnewline
42 & -0.03909 & -0.3176 & 0.375906 \tabularnewline
43 & 0.009408 & 0.0764 & 0.469654 \tabularnewline
44 & -0.03302 & -0.2683 & 0.39467 \tabularnewline
45 & 0.089767 & 0.7293 & 0.234209 \tabularnewline
46 & -0.009781 & -0.0795 & 0.468453 \tabularnewline
47 & 0.058068 & 0.4717 & 0.319331 \tabularnewline
48 & 0.082599 & 0.671 & 0.25227 \tabularnewline
\hline
\end{tabular}
%Source: https://freestatistics.org/blog/index.php?pk=302523&T=1

[TABLE]
[ROW][C]Autocorrelation Function[/C][/ROW]
[ROW][C]Time lag k[/C][C]ACF(k)[/C][C]T-STAT[/C][C]P-value[/C][/ROW]
[ROW][C]1[/C][C]0.117802[/C][C]0.957[/C][C]0.171022[/C][/ROW]
[ROW][C]2[/C][C]-0.072949[/C][C]-0.5926[/C][C]0.277723[/C][/ROW]
[ROW][C]3[/C][C]-0.020389[/C][C]-0.1656[/C][C]0.434472[/C][/ROW]
[ROW][C]4[/C][C]0.035641[/C][C]0.2896[/C][C]0.386533[/C][/ROW]
[ROW][C]5[/C][C]-0.096303[/C][C]-0.7824[/C][C]0.218398[/C][/ROW]
[ROW][C]6[/C][C]0.096829[/C][C]0.7866[/C][C]0.217152[/C][/ROW]
[ROW][C]7[/C][C]0.107764[/C][C]0.8755[/C][C]0.192245[/C][/ROW]
[ROW][C]8[/C][C]-0.04845[/C][C]-0.3936[/C][C]0.347569[/C][/ROW]
[ROW][C]9[/C][C]0.037971[/C][C]0.3085[/C][C]0.379345[/C][/ROW]
[ROW][C]10[/C][C]0.244539[/C][C]1.9866[/C][C]0.025558[/C][/ROW]
[ROW][C]11[/C][C]0.150702[/C][C]1.2243[/C][C]0.112594[/C][/ROW]
[ROW][C]12[/C][C]-0.344883[/C][C]-2.8018[/C][C]0.003331[/C][/ROW]
[ROW][C]13[/C][C]-0.100461[/C][C]-0.8161[/C][C]0.208676[/C][/ROW]
[ROW][C]14[/C][C]0.041869[/C][C]0.3401[/C][C]0.367414[/C][/ROW]
[ROW][C]15[/C][C]-0.077332[/C][C]-0.6282[/C][C]0.266005[/C][/ROW]
[ROW][C]16[/C][C]-0.054775[/C][C]-0.445[/C][C]0.328891[/C][/ROW]
[ROW][C]17[/C][C]0.122702[/C][C]0.9968[/C][C]0.161242[/C][/ROW]
[ROW][C]18[/C][C]-0.094318[/C][C]-0.7662[/C][C]0.223131[/C][/ROW]
[ROW][C]19[/C][C]-0.066493[/C][C]-0.5402[/C][C]0.295442[/C][/ROW]
[ROW][C]20[/C][C]0.149702[/C][C]1.2162[/C][C]0.114123[/C][/ROW]
[ROW][C]21[/C][C]0.115302[/C][C]0.9367[/C][C]0.176159[/C][/ROW]
[ROW][C]22[/C][C]-0.281496[/C][C]-2.2869[/C][C]0.012709[/C][/ROW]
[ROW][C]23[/C][C]-0.122278[/C][C]-0.9934[/C][C]0.162075[/C][/ROW]
[ROW][C]24[/C][C]-0.00805[/C][C]-0.0654[/C][C]0.474027[/C][/ROW]
[ROW][C]25[/C][C]-0.015524[/C][C]-0.1261[/C][C]0.450011[/C][/ROW]
[ROW][C]26[/C][C]-0.002806[/C][C]-0.0228[/C][C]0.490942[/C][/ROW]
[ROW][C]27[/C][C]-0.001796[/C][C]-0.0146[/C][C]0.494202[/C][/ROW]
[ROW][C]28[/C][C]0.076679[/C][C]0.6229[/C][C]0.267735[/C][/ROW]
[ROW][C]29[/C][C]-0.069346[/C][C]-0.5634[/C][C]0.287545[/C][/ROW]
[ROW][C]30[/C][C]0.022356[/C][C]0.1816[/C][C]0.428218[/C][/ROW]
[ROW][C]31[/C][C]-0.006238[/C][C]-0.0507[/C][C]0.479869[/C][/ROW]
[ROW][C]32[/C][C]-0.11343[/C][C]-0.9215[/C][C]0.18007[/C][/ROW]
[ROW][C]33[/C][C]-0.227797[/C][C]-1.8506[/C][C]0.03435[/C][/ROW]
[ROW][C]34[/C][C]0.025055[/C][C]0.2035[/C][C]0.419667[/C][/ROW]
[ROW][C]35[/C][C]-0.060866[/C][C]-0.4945[/C][C]0.311305[/C][/ROW]
[ROW][C]36[/C][C]-0.103464[/C][C]-0.8405[/C][C]0.20182[/C][/ROW]
[ROW][C]37[/C][C]0.031025[/C][C]0.252[/C][C]0.400894[/C][/ROW]
[ROW][C]38[/C][C]-0.014504[/C][C]-0.1178[/C][C]0.453279[/C][/ROW]
[ROW][C]39[/C][C]0.056532[/C][C]0.4593[/C][C]0.323774[/C][/ROW]
[ROW][C]40[/C][C]-0.014341[/C][C]-0.1165[/C][C]0.453803[/C][/ROW]
[ROW][C]41[/C][C]0.031884[/C][C]0.259[/C][C]0.398209[/C][/ROW]
[ROW][C]42[/C][C]-0.03909[/C][C]-0.3176[/C][C]0.375906[/C][/ROW]
[ROW][C]43[/C][C]0.009408[/C][C]0.0764[/C][C]0.469654[/C][/ROW]
[ROW][C]44[/C][C]-0.03302[/C][C]-0.2683[/C][C]0.39467[/C][/ROW]
[ROW][C]45[/C][C]0.089767[/C][C]0.7293[/C][C]0.234209[/C][/ROW]
[ROW][C]46[/C][C]-0.009781[/C][C]-0.0795[/C][C]0.468453[/C][/ROW]
[ROW][C]47[/C][C]0.058068[/C][C]0.4717[/C][C]0.319331[/C][/ROW]
[ROW][C]48[/C][C]0.082599[/C][C]0.671[/C][C]0.25227[/C][/ROW]
[/TABLE]
Source: https://freestatistics.org/blog/index.php?pk=302523&T=1

Globally Unique Identifier (entire table): ba.freestatistics.org/blog/index.php?pk=302523&T=1

As an alternative you can also use a QR Code:  

The GUIDs for individual cells are displayed in the table below:

Autocorrelation Function
Time lag kACF(k)T-STATP-value
10.1178020.9570.171022
2-0.072949-0.59260.277723
3-0.020389-0.16560.434472
40.0356410.28960.386533
5-0.096303-0.78240.218398
60.0968290.78660.217152
70.1077640.87550.192245
8-0.04845-0.39360.347569
90.0379710.30850.379345
100.2445391.98660.025558
110.1507021.22430.112594
12-0.344883-2.80180.003331
13-0.100461-0.81610.208676
140.0418690.34010.367414
15-0.077332-0.62820.266005
16-0.054775-0.4450.328891
170.1227020.99680.161242
18-0.094318-0.76620.223131
19-0.066493-0.54020.295442
200.1497021.21620.114123
210.1153020.93670.176159
22-0.281496-2.28690.012709
23-0.122278-0.99340.162075
24-0.00805-0.06540.474027
25-0.015524-0.12610.450011
26-0.002806-0.02280.490942
27-0.001796-0.01460.494202
280.0766790.62290.267735
29-0.069346-0.56340.287545
300.0223560.18160.428218
31-0.006238-0.05070.479869
32-0.11343-0.92150.18007
33-0.227797-1.85060.03435
340.0250550.20350.419667
35-0.060866-0.49450.311305
36-0.103464-0.84050.20182
370.0310250.2520.400894
38-0.014504-0.11780.453279
390.0565320.45930.323774
40-0.014341-0.11650.453803
410.0318840.2590.398209
42-0.03909-0.31760.375906
430.0094080.07640.469654
44-0.03302-0.26830.39467
450.0897670.72930.234209
46-0.009781-0.07950.468453
470.0580680.47170.319331
480.0825990.6710.25227


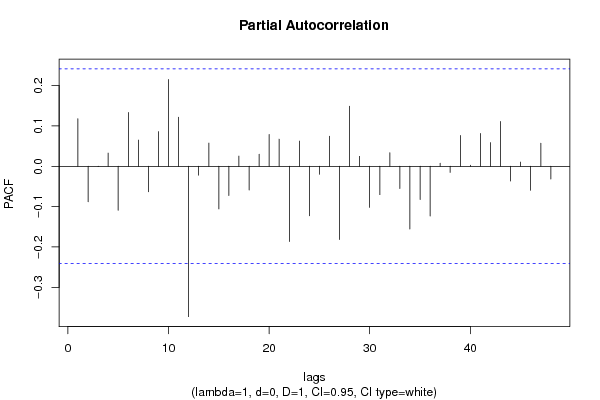
Partial Autocorrelation Function
Time lag kPACF(k)T-STATP-value
10.1178020.9570.171022
2-0.088048-0.71530.238471
3-0.000682-0.00550.497799
40.0326190.2650.395918
5-0.109268-0.88770.188964
60.1331051.08140.141738
70.0647760.52620.300242
8-0.063409-0.51510.304091
90.0859930.69860.243625
100.2152161.74840.04252
110.1215350.98740.163537
12-0.372811-3.02870.001751
13-0.022033-0.1790.429245
140.0573250.46570.321478
15-0.10564-0.85820.196937
16-0.072396-0.58810.27922
170.0252130.20480.419168
18-0.058678-0.47670.317575
190.0298770.24270.404486
200.078610.63860.262637
210.067220.54610.29342
22-0.186696-1.51670.067056
230.0623830.50680.306991
24-0.122696-0.99680.161254
25-0.019791-0.16080.436379
260.0743390.60390.27398
27-0.18143-1.47390.072625
280.1487311.20830.115622
290.0245260.19920.421341
30-0.102019-0.82880.205101
31-0.070368-0.57170.284743
320.0333550.2710.393627
33-0.055078-0.44750.328006
34-0.155736-1.26520.105123
35-0.082214-0.66790.253261
36-0.123144-1.00040.160379
370.0073260.05950.476359
38-0.015202-0.12350.451044
390.076410.62080.268448
400.0025480.02070.491774
410.081190.65960.255907
420.0587030.47690.317503
430.1108460.90050.18556
44-0.036747-0.29850.383117
450.0103080.08370.466757
46-0.059467-0.48310.315307
470.0568730.4620.322787
48-0.031619-0.25690.399037

\begin{tabular}{lllllllll}
\hline
Partial Autocorrelation Function \tabularnewline
Time lag k & PACF(k) & T-STAT & P-value \tabularnewline
1 & 0.117802 & 0.957 & 0.171022 \tabularnewline
2 & -0.088048 & -0.7153 & 0.238471 \tabularnewline
3 & -0.000682 & -0.0055 & 0.497799 \tabularnewline
4 & 0.032619 & 0.265 & 0.395918 \tabularnewline
5 & -0.109268 & -0.8877 & 0.188964 \tabularnewline
6 & 0.133105 & 1.0814 & 0.141738 \tabularnewline
7 & 0.064776 & 0.5262 & 0.300242 \tabularnewline
8 & -0.063409 & -0.5151 & 0.304091 \tabularnewline
9 & 0.085993 & 0.6986 & 0.243625 \tabularnewline
10 & 0.215216 & 1.7484 & 0.04252 \tabularnewline
11 & 0.121535 & 0.9874 & 0.163537 \tabularnewline
12 & -0.372811 & -3.0287 & 0.001751 \tabularnewline
13 & -0.022033 & -0.179 & 0.429245 \tabularnewline
14 & 0.057325 & 0.4657 & 0.321478 \tabularnewline
15 & -0.10564 & -0.8582 & 0.196937 \tabularnewline
16 & -0.072396 & -0.5881 & 0.27922 \tabularnewline
17 & 0.025213 & 0.2048 & 0.419168 \tabularnewline
18 & -0.058678 & -0.4767 & 0.317575 \tabularnewline
19 & 0.029877 & 0.2427 & 0.404486 \tabularnewline
20 & 0.07861 & 0.6386 & 0.262637 \tabularnewline
21 & 0.06722 & 0.5461 & 0.29342 \tabularnewline
22 & -0.186696 & -1.5167 & 0.067056 \tabularnewline
23 & 0.062383 & 0.5068 & 0.306991 \tabularnewline
24 & -0.122696 & -0.9968 & 0.161254 \tabularnewline
25 & -0.019791 & -0.1608 & 0.436379 \tabularnewline
26 & 0.074339 & 0.6039 & 0.27398 \tabularnewline
27 & -0.18143 & -1.4739 & 0.072625 \tabularnewline
28 & 0.148731 & 1.2083 & 0.115622 \tabularnewline
29 & 0.024526 & 0.1992 & 0.421341 \tabularnewline
30 & -0.102019 & -0.8288 & 0.205101 \tabularnewline
31 & -0.070368 & -0.5717 & 0.284743 \tabularnewline
32 & 0.033355 & 0.271 & 0.393627 \tabularnewline
33 & -0.055078 & -0.4475 & 0.328006 \tabularnewline
34 & -0.155736 & -1.2652 & 0.105123 \tabularnewline
35 & -0.082214 & -0.6679 & 0.253261 \tabularnewline
36 & -0.123144 & -1.0004 & 0.160379 \tabularnewline
37 & 0.007326 & 0.0595 & 0.476359 \tabularnewline
38 & -0.015202 & -0.1235 & 0.451044 \tabularnewline
39 & 0.07641 & 0.6208 & 0.268448 \tabularnewline
40 & 0.002548 & 0.0207 & 0.491774 \tabularnewline
41 & 0.08119 & 0.6596 & 0.255907 \tabularnewline
42 & 0.058703 & 0.4769 & 0.317503 \tabularnewline
43 & 0.110846 & 0.9005 & 0.18556 \tabularnewline
44 & -0.036747 & -0.2985 & 0.383117 \tabularnewline
45 & 0.010308 & 0.0837 & 0.466757 \tabularnewline
46 & -0.059467 & -0.4831 & 0.315307 \tabularnewline
47 & 0.056873 & 0.462 & 0.322787 \tabularnewline
48 & -0.031619 & -0.2569 & 0.399037 \tabularnewline
\hline
\end{tabular}
%Source: https://freestatistics.org/blog/index.php?pk=302523&T=2

[TABLE]
[ROW][C]Partial Autocorrelation Function[/C][/ROW]
[ROW][C]Time lag k[/C][C]PACF(k)[/C][C]T-STAT[/C][C]P-value[/C][/ROW]
[ROW][C]1[/C][C]0.117802[/C][C]0.957[/C][C]0.171022[/C][/ROW]
[ROW][C]2[/C][C]-0.088048[/C][C]-0.7153[/C][C]0.238471[/C][/ROW]
[ROW][C]3[/C][C]-0.000682[/C][C]-0.0055[/C][C]0.497799[/C][/ROW]
[ROW][C]4[/C][C]0.032619[/C][C]0.265[/C][C]0.395918[/C][/ROW]
[ROW][C]5[/C][C]-0.109268[/C][C]-0.8877[/C][C]0.188964[/C][/ROW]
[ROW][C]6[/C][C]0.133105[/C][C]1.0814[/C][C]0.141738[/C][/ROW]
[ROW][C]7[/C][C]0.064776[/C][C]0.5262[/C][C]0.300242[/C][/ROW]
[ROW][C]8[/C][C]-0.063409[/C][C]-0.5151[/C][C]0.304091[/C][/ROW]
[ROW][C]9[/C][C]0.085993[/C][C]0.6986[/C][C]0.243625[/C][/ROW]
[ROW][C]10[/C][C]0.215216[/C][C]1.7484[/C][C]0.04252[/C][/ROW]
[ROW][C]11[/C][C]0.121535[/C][C]0.9874[/C][C]0.163537[/C][/ROW]
[ROW][C]12[/C][C]-0.372811[/C][C]-3.0287[/C][C]0.001751[/C][/ROW]
[ROW][C]13[/C][C]-0.022033[/C][C]-0.179[/C][C]0.429245[/C][/ROW]
[ROW][C]14[/C][C]0.057325[/C][C]0.4657[/C][C]0.321478[/C][/ROW]
[ROW][C]15[/C][C]-0.10564[/C][C]-0.8582[/C][C]0.196937[/C][/ROW]
[ROW][C]16[/C][C]-0.072396[/C][C]-0.5881[/C][C]0.27922[/C][/ROW]
[ROW][C]17[/C][C]0.025213[/C][C]0.2048[/C][C]0.419168[/C][/ROW]
[ROW][C]18[/C][C]-0.058678[/C][C]-0.4767[/C][C]0.317575[/C][/ROW]
[ROW][C]19[/C][C]0.029877[/C][C]0.2427[/C][C]0.404486[/C][/ROW]
[ROW][C]20[/C][C]0.07861[/C][C]0.6386[/C][C]0.262637[/C][/ROW]
[ROW][C]21[/C][C]0.06722[/C][C]0.5461[/C][C]0.29342[/C][/ROW]
[ROW][C]22[/C][C]-0.186696[/C][C]-1.5167[/C][C]0.067056[/C][/ROW]
[ROW][C]23[/C][C]0.062383[/C][C]0.5068[/C][C]0.306991[/C][/ROW]
[ROW][C]24[/C][C]-0.122696[/C][C]-0.9968[/C][C]0.161254[/C][/ROW]
[ROW][C]25[/C][C]-0.019791[/C][C]-0.1608[/C][C]0.436379[/C][/ROW]
[ROW][C]26[/C][C]0.074339[/C][C]0.6039[/C][C]0.27398[/C][/ROW]
[ROW][C]27[/C][C]-0.18143[/C][C]-1.4739[/C][C]0.072625[/C][/ROW]
[ROW][C]28[/C][C]0.148731[/C][C]1.2083[/C][C]0.115622[/C][/ROW]
[ROW][C]29[/C][C]0.024526[/C][C]0.1992[/C][C]0.421341[/C][/ROW]
[ROW][C]30[/C][C]-0.102019[/C][C]-0.8288[/C][C]0.205101[/C][/ROW]
[ROW][C]31[/C][C]-0.070368[/C][C]-0.5717[/C][C]0.284743[/C][/ROW]
[ROW][C]32[/C][C]0.033355[/C][C]0.271[/C][C]0.393627[/C][/ROW]
[ROW][C]33[/C][C]-0.055078[/C][C]-0.4475[/C][C]0.328006[/C][/ROW]
[ROW][C]34[/C][C]-0.155736[/C][C]-1.2652[/C][C]0.105123[/C][/ROW]
[ROW][C]35[/C][C]-0.082214[/C][C]-0.6679[/C][C]0.253261[/C][/ROW]
[ROW][C]36[/C][C]-0.123144[/C][C]-1.0004[/C][C]0.160379[/C][/ROW]
[ROW][C]37[/C][C]0.007326[/C][C]0.0595[/C][C]0.476359[/C][/ROW]
[ROW][C]38[/C][C]-0.015202[/C][C]-0.1235[/C][C]0.451044[/C][/ROW]
[ROW][C]39[/C][C]0.07641[/C][C]0.6208[/C][C]0.268448[/C][/ROW]
[ROW][C]40[/C][C]0.002548[/C][C]0.0207[/C][C]0.491774[/C][/ROW]
[ROW][C]41[/C][C]0.08119[/C][C]0.6596[/C][C]0.255907[/C][/ROW]
[ROW][C]42[/C][C]0.058703[/C][C]0.4769[/C][C]0.317503[/C][/ROW]
[ROW][C]43[/C][C]0.110846[/C][C]0.9005[/C][C]0.18556[/C][/ROW]
[ROW][C]44[/C][C]-0.036747[/C][C]-0.2985[/C][C]0.383117[/C][/ROW]
[ROW][C]45[/C][C]0.010308[/C][C]0.0837[/C][C]0.466757[/C][/ROW]
[ROW][C]46[/C][C]-0.059467[/C][C]-0.4831[/C][C]0.315307[/C][/ROW]
[ROW][C]47[/C][C]0.056873[/C][C]0.462[/C][C]0.322787[/C][/ROW]
[ROW][C]48[/C][C]-0.031619[/C][C]-0.2569[/C][C]0.399037[/C][/ROW]
[/TABLE]
Source: https://freestatistics.org/blog/index.php?pk=302523&T=2

Globally Unique Identifier (entire table): ba.freestatistics.org/blog/index.php?pk=302523&T=2

As an alternative you can also use a QR Code:  

The GUIDs for individual cells are displayed in the table below:

Partial Autocorrelation Function
Time lag kPACF(k)T-STATP-value
10.1178020.9570.171022
2-0.088048-0.71530.238471
3-0.000682-0.00550.497799
40.0326190.2650.395918
5-0.109268-0.88770.188964
60.1331051.08140.141738
70.0647760.52620.300242
8-0.063409-0.51510.304091
90.0859930.69860.243625
100.2152161.74840.04252
110.1215350.98740.163537
12-0.372811-3.02870.001751
13-0.022033-0.1790.429245
140.0573250.46570.321478
15-0.10564-0.85820.196937
16-0.072396-0.58810.27922
170.0252130.20480.419168
18-0.058678-0.47670.317575
190.0298770.24270.404486
200.078610.63860.262637
210.067220.54610.29342
22-0.186696-1.51670.067056
230.0623830.50680.306991
24-0.122696-0.99680.161254
25-0.019791-0.16080.436379
260.0743390.60390.27398
27-0.18143-1.47390.072625
280.1487311.20830.115622
290.0245260.19920.421341
30-0.102019-0.82880.205101
31-0.070368-0.57170.284743
320.0333550.2710.393627
33-0.055078-0.44750.328006
34-0.155736-1.26520.105123
35-0.082214-0.66790.253261
36-0.123144-1.00040.160379
370.0073260.05950.476359
38-0.015202-0.12350.451044
390.076410.62080.268448
400.0025480.02070.491774
410.081190.65960.255907
420.0587030.47690.317503
430.1108460.90050.18556
44-0.036747-0.29850.383117
450.0103080.08370.466757
46-0.059467-0.48310.315307
470.0568730.4620.322787
48-0.031619-0.25690.399037


Parameters (Session):
Parameters (R input):
par1 = 48 ; par2 = 1 ; par3 = 0 ; par4 = 1 ; par5 = 12 ; par6 = White Noise ; par7 = 0.95 ; par8 = ;
R code (references can be found in the software module):
par8 <- ''
par7 <- '0.95'
par6 <- 'White Noise'
par5 <- '12'
par4 <- '2'
par3 <- '0'
par2 <- '1'
par1 <- '48'
if (par1 == 'Default') {
par1 = 10*log10(length(x))
} else {
par1 <- as.numeric(par1)
}
par2 <- as.numeric(par2)
par3 <- as.numeric(par3)
par4 <- as.numeric(par4)
par5 <- as.numeric(par5)
if (par6 == 'White Noise') par6 <- 'white' else par6 <- 'ma'
par7 <- as.numeric(par7)
if (par8 != '') par8 <- as.numeric(par8)
x <- na.omit(x)
ox <- x
if (par8 == '') {
if (par2 == 0) {
x <- log(x)
} else {
x <- (x ^ par2 - 1) / par2
}
} else {
x <- log(x,base=par8)
}
if (par3 > 0) x <- diff(x,lag=1,difference=par3)
if (par4 > 0) x <- diff(x,lag=par5,difference=par4)
bitmap(file='picts.png')
op <- par(mfrow=c(2,1))
plot(ox,type='l',main='Original Time Series',xlab='time',ylab='value')
if (par8=='') {
mytitle <- paste('Working Time Series (lambda=',par2,', d=',par3,', D=',par4,')',sep='')
mysub <- paste('(lambda=',par2,', d=',par3,', D=',par4,', CI=', par7, ', CI type=',par6,')',sep='')
} else {
mytitle <- paste('Working Time Series (base=',par8,', d=',par3,', D=',par4,')',sep='')
mysub <- paste('(base=',par8,', d=',par3,', D=',par4,', CI=', par7, ', CI type=',par6,')',sep='')
}
plot(x,type='l', main=mytitle,xlab='time',ylab='value')
par(op)
dev.off()
bitmap(file='pic1.png')
racf <- acf(x, par1, main='Autocorrelation', xlab='time lag', ylab='ACF', ci.type=par6, ci=par7, sub=mysub)
dev.off()
bitmap(file='pic2.png')
rpacf <- pacf(x,par1,main='Partial Autocorrelation',xlab='lags',ylab='PACF',sub=mysub)
dev.off()
(myacf <- c(racf$acf))
(mypacf <- c(rpacf$acf))
lengthx <- length(x)
sqrtn <- sqrt(lengthx)
load(file='createtable')
a<-table.start()
a<-table.row.start(a)
a<-table.element(a,'Autocorrelation Function',4,TRUE)
a<-table.row.end(a)
a<-table.row.start(a)
a<-table.element(a,'Time lag k',header=TRUE)
a<-table.element(a,'ACF(k)',header=TRUE)
a<-table.element(a,'T-STAT',header=TRUE)
a<-table.element(a,'P-value',header=TRUE)
a<-table.row.end(a)
for (i in 2:(par1+1)) {
a<-table.row.start(a)
a<-table.element(a,i-1,header=TRUE)
a<-table.element(a,round(myacf[i],6))
mytstat <- myacf[i]*sqrtn
a<-table.element(a,round(mytstat,4))
a<-table.element(a,round(1-pt(abs(mytstat),lengthx),6))
a<-table.row.end(a)
}
a<-table.end(a)
table.save(a,file='mytable.tab')
a<-table.start()
a<-table.row.start(a)
a<-table.element(a,'Partial Autocorrelation Function',4,TRUE)
a<-table.row.end(a)
a<-table.row.start(a)
a<-table.element(a,'Time lag k',header=TRUE)
a<-table.element(a,'PACF(k)',header=TRUE)
a<-table.element(a,'T-STAT',header=TRUE)
a<-table.element(a,'P-value',header=TRUE)
a<-table.row.end(a)
for (i in 1:par1) {
a<-table.row.start(a)
a<-table.element(a,i,header=TRUE)
a<-table.element(a,round(mypacf[i],6))
mytstat <- mypacf[i]*sqrtn
a<-table.element(a,round(mytstat,4))
a<-table.element(a,round(1-pt(abs(mytstat),lengthx),6))
a<-table.row.end(a)
}
a<-table.end(a)
table.save(a,file='mytable1.tab')