Free Statistics

of Irreproducible Research!

Author's title

Author*The author of this computation has been verified*
R Software Modulerwasp_arimabackwardselection.wasp
Title produced by softwareARIMA Backward Selection
Date of computationThu, 22 Dec 2016 11:02:05 +0100
Cite this page as followsStatistical Computations at FreeStatistics.org, Office for Research Development and Education, URL https://freestatistics.org/blog/index.php?v=date/2016/Dec/22/t1482400951fg6cvwq1vdd3dr5.htm/, Retrieved Sun, 28 Apr 2024 21:34:11 +0000
Statistical Computations at FreeStatistics.org, Office for Research Development and Education, URL https://freestatistics.org/blog/index.php?pk=302524, Retrieved Sun, 28 Apr 2024 21:34:11 +0000
QR Codes:

Original text written by user:
IsPrivate?No (this computation is public)
User-defined keywords
Estimated Impact102
Family? (F = Feedback message, R = changed R code, M = changed R Module, P = changed Parameters, D = changed Data)
-       [ARIMA Backward Selection] [] [2016-12-22 10:02:05] [e7c866b75ad2fc21ab540ba3a0a42299] [Current]
Feedback Forum

Post a new message
Dataseries X:
2440
2960
3800
5440
7880
9400
9120
8720
7480
5800
4360
2120
4320
2760
4600
5520
7600
8200
8520
8680
8000
5520
4400
3320
1680
3000
4280
5280
6800
8600
8720
8440
8160
6640
3920
3920
2800
3680
3520
6120
8000
8800
9120
9560
7960
5560
5360
2320
1480
4360
5520
7560
7640
9040
9520
9720
7920
6360
3880
3040
3000
4000
5080
6880
6760
8520
9560
8800
7400
6040
4760
3480
1920
200
3920
6240
7640
8600


Summary of computational transaction
Raw Input view raw input (R code)
Raw Outputview raw output of R engine
Computing time9 seconds
R ServerBig Analytics Cloud Computing Center

\begin{tabular}{lllllllll}
\hline
Summary of computational transaction \tabularnewline
Raw Input view raw input (R code)  \tabularnewline
Raw Outputview raw output of R engine  \tabularnewline
Computing time9 seconds \tabularnewline
R ServerBig Analytics Cloud Computing Center \tabularnewline
\hline
\end{tabular}
%Source: https://freestatistics.org/blog/index.php?pk=302524&T=0

[TABLE]
[ROW]
Summary of computational transaction[/C][/ROW] [ROW]Raw Input[/C] view raw input (R code) [/C][/ROW] [ROW]Raw Output[/C]view raw output of R engine [/C][/ROW] [ROW]Computing time[/C]9 seconds[/C][/ROW] [ROW]R Server[/C]Big Analytics Cloud Computing Center[/C][/ROW] [/TABLE] Source: https://freestatistics.org/blog/index.php?pk=302524&T=0

Globally Unique Identifier (entire table): ba.freestatistics.org/blog/index.php?pk=302524&T=0

As an alternative you can also use a QR Code:  

The GUIDs for individual cells are displayed in the table below:

Summary of computational transaction
Raw Input view raw input (R code)
Raw Outputview raw output of R engine
Computing time9 seconds
R ServerBig Analytics Cloud Computing Center


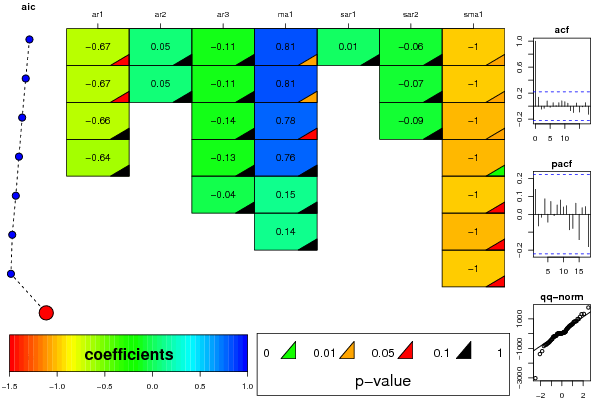
ARIMA Parameter Estimation and Backward Selection
Iterationar1ar2ar3ma1sar1sar2sma1
Estimates ( 1 )-0.66790.0527-0.11340.80540.0079-0.0647-0.9995
(p-val)(0.0735 )(0.746 )(0.3944 )(0.0218 )(0.9629 )(0.7169 )(0.0163 )
Estimates ( 2 )-0.67140.0539-0.11310.8090-0.0667-0.9997
(p-val)(0.0632 )(0.7379 )(0.3958 )(0.0168 )(NA )(0.6962 )(0.0226 )
Estimates ( 3 )-0.65960-0.13930.77590-0.086-1.0011
(p-val)(0.1318 )(NA )(0.1998 )(0.0519 )(NA )(0.5919 )(0.0215 )
Estimates ( 4 )-0.64450-0.12810.755400-1.0028
(p-val)(0.2888 )(NA )(0.2524 )(0.1738 )(NA )(NA )(0.0078 )
Estimates ( 5 )00-0.03930.145100-0.9999
(p-val)(NA )(NA )(0.7468 )(0.2451 )(NA )(NA )(0.0547 )
Estimates ( 6 )0000.141600-1.0002
(p-val)(NA )(NA )(NA )(0.2493 )(NA )(NA )(0.0676 )
Estimates ( 7 )000000-0.9995
(p-val)(NA )(NA )(NA )(NA )(NA )(NA )(0.0884 )
Estimates ( 8 )0000000
(p-val)(NA )(NA )(NA )(NA )(NA )(NA )(NA )
Estimates ( 9 )NANANANANANANA
(p-val)(NA )(NA )(NA )(NA )(NA )(NA )(NA )
Estimates ( 10 )NANANANANANANA
(p-val)(NA )(NA )(NA )(NA )(NA )(NA )(NA )
Estimates ( 11 )NANANANANANANA
(p-val)(NA )(NA )(NA )(NA )(NA )(NA )(NA )
Estimates ( 12 )NANANANANANANA
(p-val)(NA )(NA )(NA )(NA )(NA )(NA )(NA )
Estimates ( 13 )NANANANANANANA
(p-val)(NA )(NA )(NA )(NA )(NA )(NA )(NA )

\begin{tabular}{lllllllll}
\hline
ARIMA Parameter Estimation and Backward Selection \tabularnewline
Iteration & ar1 & ar2 & ar3 & ma1 & sar1 & sar2 & sma1 \tabularnewline
Estimates ( 1 ) & -0.6679 & 0.0527 & -0.1134 & 0.8054 & 0.0079 & -0.0647 & -0.9995 \tabularnewline
(p-val) & (0.0735 ) & (0.746 ) & (0.3944 ) & (0.0218 ) & (0.9629 ) & (0.7169 ) & (0.0163 ) \tabularnewline
Estimates ( 2 ) & -0.6714 & 0.0539 & -0.1131 & 0.809 & 0 & -0.0667 & -0.9997 \tabularnewline
(p-val) & (0.0632 ) & (0.7379 ) & (0.3958 ) & (0.0168 ) & (NA ) & (0.6962 ) & (0.0226 ) \tabularnewline
Estimates ( 3 ) & -0.6596 & 0 & -0.1393 & 0.7759 & 0 & -0.086 & -1.0011 \tabularnewline
(p-val) & (0.1318 ) & (NA ) & (0.1998 ) & (0.0519 ) & (NA ) & (0.5919 ) & (0.0215 ) \tabularnewline
Estimates ( 4 ) & -0.6445 & 0 & -0.1281 & 0.7554 & 0 & 0 & -1.0028 \tabularnewline
(p-val) & (0.2888 ) & (NA ) & (0.2524 ) & (0.1738 ) & (NA ) & (NA ) & (0.0078 ) \tabularnewline
Estimates ( 5 ) & 0 & 0 & -0.0393 & 0.1451 & 0 & 0 & -0.9999 \tabularnewline
(p-val) & (NA ) & (NA ) & (0.7468 ) & (0.2451 ) & (NA ) & (NA ) & (0.0547 ) \tabularnewline
Estimates ( 6 ) & 0 & 0 & 0 & 0.1416 & 0 & 0 & -1.0002 \tabularnewline
(p-val) & (NA ) & (NA ) & (NA ) & (0.2493 ) & (NA ) & (NA ) & (0.0676 ) \tabularnewline
Estimates ( 7 ) & 0 & 0 & 0 & 0 & 0 & 0 & -0.9995 \tabularnewline
(p-val) & (NA ) & (NA ) & (NA ) & (NA ) & (NA ) & (NA ) & (0.0884 ) \tabularnewline
Estimates ( 8 ) & 0 & 0 & 0 & 0 & 0 & 0 & 0 \tabularnewline
(p-val) & (NA ) & (NA ) & (NA ) & (NA ) & (NA ) & (NA ) & (NA ) \tabularnewline
Estimates ( 9 ) & NA & NA & NA & NA & NA & NA & NA \tabularnewline
(p-val) & (NA ) & (NA ) & (NA ) & (NA ) & (NA ) & (NA ) & (NA ) \tabularnewline
Estimates ( 10 ) & NA & NA & NA & NA & NA & NA & NA \tabularnewline
(p-val) & (NA ) & (NA ) & (NA ) & (NA ) & (NA ) & (NA ) & (NA ) \tabularnewline
Estimates ( 11 ) & NA & NA & NA & NA & NA & NA & NA \tabularnewline
(p-val) & (NA ) & (NA ) & (NA ) & (NA ) & (NA ) & (NA ) & (NA ) \tabularnewline
Estimates ( 12 ) & NA & NA & NA & NA & NA & NA & NA \tabularnewline
(p-val) & (NA ) & (NA ) & (NA ) & (NA ) & (NA ) & (NA ) & (NA ) \tabularnewline
Estimates ( 13 ) & NA & NA & NA & NA & NA & NA & NA \tabularnewline
(p-val) & (NA ) & (NA ) & (NA ) & (NA ) & (NA ) & (NA ) & (NA ) \tabularnewline
\hline
\end{tabular}
%Source: https://freestatistics.org/blog/index.php?pk=302524&T=1

[TABLE]
[ROW][C]ARIMA Parameter Estimation and Backward Selection[/C][/ROW]
[ROW][C]Iteration[/C][C]ar1[/C][C]ar2[/C][C]ar3[/C][C]ma1[/C][C]sar1[/C][C]sar2[/C][C]sma1[/C][/ROW]
[ROW][C]Estimates ( 1 )[/C][C]-0.6679[/C][C]0.0527[/C][C]-0.1134[/C][C]0.8054[/C][C]0.0079[/C][C]-0.0647[/C][C]-0.9995[/C][/ROW]
[ROW][C](p-val)[/C][C](0.0735 )[/C][C](0.746 )[/C][C](0.3944 )[/C][C](0.0218 )[/C][C](0.9629 )[/C][C](0.7169 )[/C][C](0.0163 )[/C][/ROW]
[ROW][C]Estimates ( 2 )[/C][C]-0.6714[/C][C]0.0539[/C][C]-0.1131[/C][C]0.809[/C][C]0[/C][C]-0.0667[/C][C]-0.9997[/C][/ROW]
[ROW][C](p-val)[/C][C](0.0632 )[/C][C](0.7379 )[/C][C](0.3958 )[/C][C](0.0168 )[/C][C](NA )[/C][C](0.6962 )[/C][C](0.0226 )[/C][/ROW]
[ROW][C]Estimates ( 3 )[/C][C]-0.6596[/C][C]0[/C][C]-0.1393[/C][C]0.7759[/C][C]0[/C][C]-0.086[/C][C]-1.0011[/C][/ROW]
[ROW][C](p-val)[/C][C](0.1318 )[/C][C](NA )[/C][C](0.1998 )[/C][C](0.0519 )[/C][C](NA )[/C][C](0.5919 )[/C][C](0.0215 )[/C][/ROW]
[ROW][C]Estimates ( 4 )[/C][C]-0.6445[/C][C]0[/C][C]-0.1281[/C][C]0.7554[/C][C]0[/C][C]0[/C][C]-1.0028[/C][/ROW]
[ROW][C](p-val)[/C][C](0.2888 )[/C][C](NA )[/C][C](0.2524 )[/C][C](0.1738 )[/C][C](NA )[/C][C](NA )[/C][C](0.0078 )[/C][/ROW]
[ROW][C]Estimates ( 5 )[/C][C]0[/C][C]0[/C][C]-0.0393[/C][C]0.1451[/C][C]0[/C][C]0[/C][C]-0.9999[/C][/ROW]
[ROW][C](p-val)[/C][C](NA )[/C][C](NA )[/C][C](0.7468 )[/C][C](0.2451 )[/C][C](NA )[/C][C](NA )[/C][C](0.0547 )[/C][/ROW]
[ROW][C]Estimates ( 6 )[/C][C]0[/C][C]0[/C][C]0[/C][C]0.1416[/C][C]0[/C][C]0[/C][C]-1.0002[/C][/ROW]
[ROW][C](p-val)[/C][C](NA )[/C][C](NA )[/C][C](NA )[/C][C](0.2493 )[/C][C](NA )[/C][C](NA )[/C][C](0.0676 )[/C][/ROW]
[ROW][C]Estimates ( 7 )[/C][C]0[/C][C]0[/C][C]0[/C][C]0[/C][C]0[/C][C]0[/C][C]-0.9995[/C][/ROW]
[ROW][C](p-val)[/C][C](NA )[/C][C](NA )[/C][C](NA )[/C][C](NA )[/C][C](NA )[/C][C](NA )[/C][C](0.0884 )[/C][/ROW]
[ROW][C]Estimates ( 8 )[/C][C]0[/C][C]0[/C][C]0[/C][C]0[/C][C]0[/C][C]0[/C][C]0[/C][/ROW]
[ROW][C](p-val)[/C][C](NA )[/C][C](NA )[/C][C](NA )[/C][C](NA )[/C][C](NA )[/C][C](NA )[/C][C](NA )[/C][/ROW]
[ROW][C]Estimates ( 9 )[/C][C]NA[/C][C]NA[/C][C]NA[/C][C]NA[/C][C]NA[/C][C]NA[/C][C]NA[/C][/ROW]
[ROW][C](p-val)[/C][C](NA )[/C][C](NA )[/C][C](NA )[/C][C](NA )[/C][C](NA )[/C][C](NA )[/C][C](NA )[/C][/ROW]
[ROW][C]Estimates ( 10 )[/C][C]NA[/C][C]NA[/C][C]NA[/C][C]NA[/C][C]NA[/C][C]NA[/C][C]NA[/C][/ROW]
[ROW][C](p-val)[/C][C](NA )[/C][C](NA )[/C][C](NA )[/C][C](NA )[/C][C](NA )[/C][C](NA )[/C][C](NA )[/C][/ROW]
[ROW][C]Estimates ( 11 )[/C][C]NA[/C][C]NA[/C][C]NA[/C][C]NA[/C][C]NA[/C][C]NA[/C][C]NA[/C][/ROW]
[ROW][C](p-val)[/C][C](NA )[/C][C](NA )[/C][C](NA )[/C][C](NA )[/C][C](NA )[/C][C](NA )[/C][C](NA )[/C][/ROW]
[ROW][C]Estimates ( 12 )[/C][C]NA[/C][C]NA[/C][C]NA[/C][C]NA[/C][C]NA[/C][C]NA[/C][C]NA[/C][/ROW]
[ROW][C](p-val)[/C][C](NA )[/C][C](NA )[/C][C](NA )[/C][C](NA )[/C][C](NA )[/C][C](NA )[/C][C](NA )[/C][/ROW]
[ROW][C]Estimates ( 13 )[/C][C]NA[/C][C]NA[/C][C]NA[/C][C]NA[/C][C]NA[/C][C]NA[/C][C]NA[/C][/ROW]
[ROW][C](p-val)[/C][C](NA )[/C][C](NA )[/C][C](NA )[/C][C](NA )[/C][C](NA )[/C][C](NA )[/C][C](NA )[/C][/ROW]
[/TABLE]
Source: https://freestatistics.org/blog/index.php?pk=302524&T=1

Globally Unique Identifier (entire table): ba.freestatistics.org/blog/index.php?pk=302524&T=1

As an alternative you can also use a QR Code:  

The GUIDs for individual cells are displayed in the table below:

ARIMA Parameter Estimation and Backward Selection
Iterationar1ar2ar3ma1sar1sar2sma1
Estimates ( 1 )-0.66790.0527-0.11340.80540.0079-0.0647-0.9995
(p-val)(0.0735 )(0.746 )(0.3944 )(0.0218 )(0.9629 )(0.7169 )(0.0163 )
Estimates ( 2 )-0.67140.0539-0.11310.8090-0.0667-0.9997
(p-val)(0.0632 )(0.7379 )(0.3958 )(0.0168 )(NA )(0.6962 )(0.0226 )
Estimates ( 3 )-0.65960-0.13930.77590-0.086-1.0011
(p-val)(0.1318 )(NA )(0.1998 )(0.0519 )(NA )(0.5919 )(0.0215 )
Estimates ( 4 )-0.64450-0.12810.755400-1.0028
(p-val)(0.2888 )(NA )(0.2524 )(0.1738 )(NA )(NA )(0.0078 )
Estimates ( 5 )00-0.03930.145100-0.9999
(p-val)(NA )(NA )(0.7468 )(0.2451 )(NA )(NA )(0.0547 )
Estimates ( 6 )0000.141600-1.0002
(p-val)(NA )(NA )(NA )(0.2493 )(NA )(NA )(0.0676 )
Estimates ( 7 )000000-0.9995
(p-val)(NA )(NA )(NA )(NA )(NA )(NA )(0.0884 )
Estimates ( 8 )0000000
(p-val)(NA )(NA )(NA )(NA )(NA )(NA )(NA )
Estimates ( 9 )NANANANANANANA
(p-val)(NA )(NA )(NA )(NA )(NA )(NA )(NA )
Estimates ( 10 )NANANANANANANA
(p-val)(NA )(NA )(NA )(NA )(NA )(NA )(NA )
Estimates ( 11 )NANANANANANANA
(p-val)(NA )(NA )(NA )(NA )(NA )(NA )(NA )
Estimates ( 12 )NANANANANANANA
(p-val)(NA )(NA )(NA )(NA )(NA )(NA )(NA )
Estimates ( 13 )NANANANANANANA
(p-val)(NA )(NA )(NA )(NA )(NA )(NA )(NA )


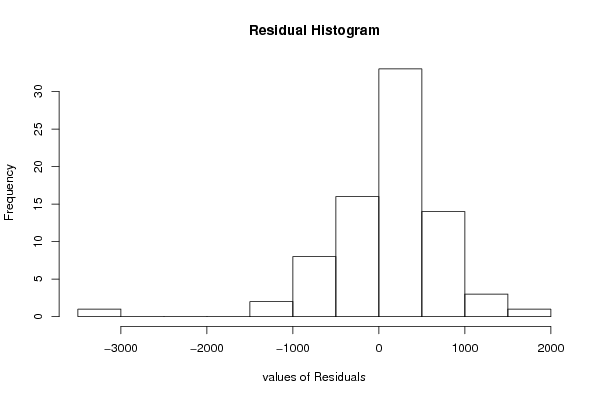
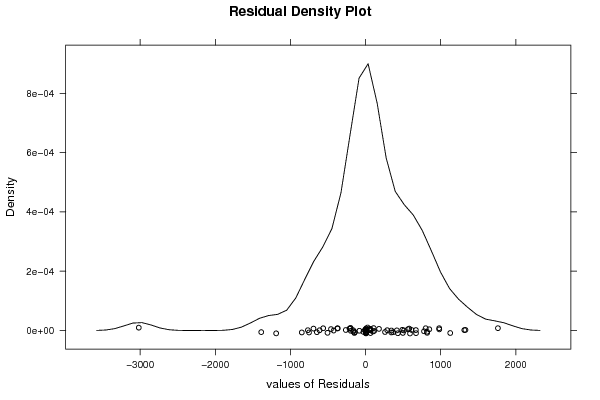
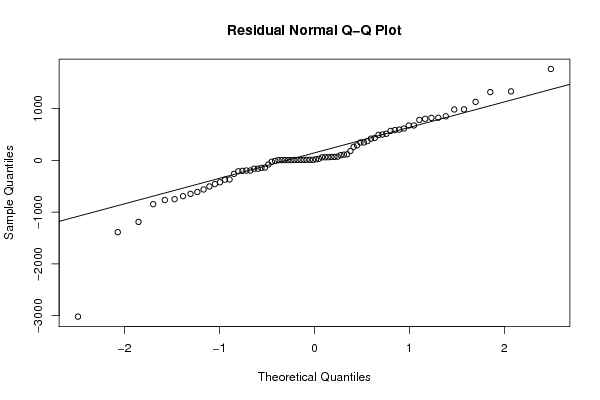
Estimated ARIMA Residuals
Value
2.1199978809898
1329.67224951816
-141.452218580692
565.819930878578
56.5855702088556
-198.030464881734
-848.719221510149
-424.356486076258
-28.2846977004332
367.786496845028
-198.031935318824
28.2939444875178
848.727365469414
-1388.36606047627
114.337311435722
65.3366132817662
-163.335102963006
-767.682308176285
-163.333691258125
-81.6650415945659
-212.334984231606
343.011541900517
800.355269420244
-375.674087090101
980.02507367293
-11.5487624273795
669.88301869941
-612.132537193346
612.135304353734
496.639044884716
57.7510434120272
288.744887585785
820.030710099319
69.3003715378679
-369.58853845552
981.725163026324
-692.980836235591
-1189.86425045459
1127.24105578199
1315.11491667179
1762.43272009225
62.6261500034687
259.446232201739
581.514905570954
778.334566296162
17.8944123181881
429.426267058435
-563.619398127861
107.356900627446
416.366845140504
591.67818314239
672.02983459768
818.123181213833
-752.379289268748
-262.966425899172
511.328112663524
-204.529333514251
-460.192597904434
58.4383084481397
343.32014586966
489.413169419205
-648.224220490364
-3018.87558799713
-506.232480885791
98.7773178691747
179.034898218443
-148.164267487672

\begin{tabular}{lllllllll}
\hline
Estimated ARIMA Residuals \tabularnewline
Value \tabularnewline
2.1199978809898 \tabularnewline
1329.67224951816 \tabularnewline
-141.452218580692 \tabularnewline
565.819930878578 \tabularnewline
56.5855702088556 \tabularnewline
-198.030464881734 \tabularnewline
-848.719221510149 \tabularnewline
-424.356486076258 \tabularnewline
-28.2846977004332 \tabularnewline
367.786496845028 \tabularnewline
-198.031935318824 \tabularnewline
28.2939444875178 \tabularnewline
848.727365469414 \tabularnewline
-1388.36606047627 \tabularnewline
114.337311435722 \tabularnewline
65.3366132817662 \tabularnewline
-163.335102963006 \tabularnewline
-767.682308176285 \tabularnewline
-163.333691258125 \tabularnewline
-81.6650415945659 \tabularnewline
-212.334984231606 \tabularnewline
343.011541900517 \tabularnewline
800.355269420244 \tabularnewline
-375.674087090101 \tabularnewline
980.02507367293 \tabularnewline
-11.5487624273795 \tabularnewline
669.88301869941 \tabularnewline
-612.132537193346 \tabularnewline
612.135304353734 \tabularnewline
496.639044884716 \tabularnewline
57.7510434120272 \tabularnewline
288.744887585785 \tabularnewline
820.030710099319 \tabularnewline
69.3003715378679 \tabularnewline
-369.58853845552 \tabularnewline
981.725163026324 \tabularnewline
-692.980836235591 \tabularnewline
-1189.86425045459 \tabularnewline
1127.24105578199 \tabularnewline
1315.11491667179 \tabularnewline
1762.43272009225 \tabularnewline
62.6261500034687 \tabularnewline
259.446232201739 \tabularnewline
581.514905570954 \tabularnewline
778.334566296162 \tabularnewline
17.8944123181881 \tabularnewline
429.426267058435 \tabularnewline
-563.619398127861 \tabularnewline
107.356900627446 \tabularnewline
416.366845140504 \tabularnewline
591.67818314239 \tabularnewline
672.02983459768 \tabularnewline
818.123181213833 \tabularnewline
-752.379289268748 \tabularnewline
-262.966425899172 \tabularnewline
511.328112663524 \tabularnewline
-204.529333514251 \tabularnewline
-460.192597904434 \tabularnewline
58.4383084481397 \tabularnewline
343.32014586966 \tabularnewline
489.413169419205 \tabularnewline
-648.224220490364 \tabularnewline
-3018.87558799713 \tabularnewline
-506.232480885791 \tabularnewline
98.7773178691747 \tabularnewline
179.034898218443 \tabularnewline
-148.164267487672 \tabularnewline
\hline
\end{tabular}
%Source: https://freestatistics.org/blog/index.php?pk=302524&T=2

[TABLE]
[ROW][C]Estimated ARIMA Residuals[/C][/ROW]
[ROW][C]Value[/C][/ROW]
[ROW][C]2.1199978809898[/C][/ROW]
[ROW][C]1329.67224951816[/C][/ROW]
[ROW][C]-141.452218580692[/C][/ROW]
[ROW][C]565.819930878578[/C][/ROW]
[ROW][C]56.5855702088556[/C][/ROW]
[ROW][C]-198.030464881734[/C][/ROW]
[ROW][C]-848.719221510149[/C][/ROW]
[ROW][C]-424.356486076258[/C][/ROW]
[ROW][C]-28.2846977004332[/C][/ROW]
[ROW][C]367.786496845028[/C][/ROW]
[ROW][C]-198.031935318824[/C][/ROW]
[ROW][C]28.2939444875178[/C][/ROW]
[ROW][C]848.727365469414[/C][/ROW]
[ROW][C]-1388.36606047627[/C][/ROW]
[ROW][C]114.337311435722[/C][/ROW]
[ROW][C]65.3366132817662[/C][/ROW]
[ROW][C]-163.335102963006[/C][/ROW]
[ROW][C]-767.682308176285[/C][/ROW]
[ROW][C]-163.333691258125[/C][/ROW]
[ROW][C]-81.6650415945659[/C][/ROW]
[ROW][C]-212.334984231606[/C][/ROW]
[ROW][C]343.011541900517[/C][/ROW]
[ROW][C]800.355269420244[/C][/ROW]
[ROW][C]-375.674087090101[/C][/ROW]
[ROW][C]980.02507367293[/C][/ROW]
[ROW][C]-11.5487624273795[/C][/ROW]
[ROW][C]669.88301869941[/C][/ROW]
[ROW][C]-612.132537193346[/C][/ROW]
[ROW][C]612.135304353734[/C][/ROW]
[ROW][C]496.639044884716[/C][/ROW]
[ROW][C]57.7510434120272[/C][/ROW]
[ROW][C]288.744887585785[/C][/ROW]
[ROW][C]820.030710099319[/C][/ROW]
[ROW][C]69.3003715378679[/C][/ROW]
[ROW][C]-369.58853845552[/C][/ROW]
[ROW][C]981.725163026324[/C][/ROW]
[ROW][C]-692.980836235591[/C][/ROW]
[ROW][C]-1189.86425045459[/C][/ROW]
[ROW][C]1127.24105578199[/C][/ROW]
[ROW][C]1315.11491667179[/C][/ROW]
[ROW][C]1762.43272009225[/C][/ROW]
[ROW][C]62.6261500034687[/C][/ROW]
[ROW][C]259.446232201739[/C][/ROW]
[ROW][C]581.514905570954[/C][/ROW]
[ROW][C]778.334566296162[/C][/ROW]
[ROW][C]17.8944123181881[/C][/ROW]
[ROW][C]429.426267058435[/C][/ROW]
[ROW][C]-563.619398127861[/C][/ROW]
[ROW][C]107.356900627446[/C][/ROW]
[ROW][C]416.366845140504[/C][/ROW]
[ROW][C]591.67818314239[/C][/ROW]
[ROW][C]672.02983459768[/C][/ROW]
[ROW][C]818.123181213833[/C][/ROW]
[ROW][C]-752.379289268748[/C][/ROW]
[ROW][C]-262.966425899172[/C][/ROW]
[ROW][C]511.328112663524[/C][/ROW]
[ROW][C]-204.529333514251[/C][/ROW]
[ROW][C]-460.192597904434[/C][/ROW]
[ROW][C]58.4383084481397[/C][/ROW]
[ROW][C]343.32014586966[/C][/ROW]
[ROW][C]489.413169419205[/C][/ROW]
[ROW][C]-648.224220490364[/C][/ROW]
[ROW][C]-3018.87558799713[/C][/ROW]
[ROW][C]-506.232480885791[/C][/ROW]
[ROW][C]98.7773178691747[/C][/ROW]
[ROW][C]179.034898218443[/C][/ROW]
[ROW][C]-148.164267487672[/C][/ROW]
[/TABLE]
Source: https://freestatistics.org/blog/index.php?pk=302524&T=2

Globally Unique Identifier (entire table): ba.freestatistics.org/blog/index.php?pk=302524&T=2

As an alternative you can also use a QR Code:  

The GUIDs for individual cells are displayed in the table below:

Estimated ARIMA Residuals
Value
2.1199978809898
1329.67224951816
-141.452218580692
565.819930878578
56.5855702088556
-198.030464881734
-848.719221510149
-424.356486076258
-28.2846977004332
367.786496845028
-198.031935318824
28.2939444875178
848.727365469414
-1388.36606047627
114.337311435722
65.3366132817662
-163.335102963006
-767.682308176285
-163.333691258125
-81.6650415945659
-212.334984231606
343.011541900517
800.355269420244
-375.674087090101
980.02507367293
-11.5487624273795
669.88301869941
-612.132537193346
612.135304353734
496.639044884716
57.7510434120272
288.744887585785
820.030710099319
69.3003715378679
-369.58853845552
981.725163026324
-692.980836235591
-1189.86425045459
1127.24105578199
1315.11491667179
1762.43272009225
62.6261500034687
259.446232201739
581.514905570954
778.334566296162
17.8944123181881
429.426267058435
-563.619398127861
107.356900627446
416.366845140504
591.67818314239
672.02983459768
818.123181213833
-752.379289268748
-262.966425899172
511.328112663524
-204.529333514251
-460.192597904434
58.4383084481397
343.32014586966
489.413169419205
-648.224220490364
-3018.87558799713
-506.232480885791
98.7773178691747
179.034898218443
-148.164267487672


Parameters (Session):
Parameters (R input):
par1 = TRUE ; par2 = 1 ; par3 = 0 ; par4 = 1 ; par5 = 12 ; par6 = 3 ; par7 = 1 ; par8 = 2 ; par9 = 1 ;
R code (references can be found in the software module):
library(lattice)
if (par1 == 'TRUE') par1 <- TRUE
if (par1 == 'FALSE') par1 <- FALSE
par2 <- as.numeric(par2) #Box-Cox lambda transformation parameter
par3 <- as.numeric(par3) #degree of non-seasonal differencing
par4 <- as.numeric(par4) #degree of seasonal differencing
par5 <- as.numeric(par5) #seasonal period
par6 <- as.numeric(par6) #degree (p) of the non-seasonal AR(p) polynomial
par7 <- as.numeric(par7) #degree (q) of the non-seasonal MA(q) polynomial
par8 <- as.numeric(par8) #degree (P) of the seasonal AR(P) polynomial
par9 <- as.numeric(par9) #degree (Q) of the seasonal MA(Q) polynomial
armaGR <- function(arima.out, names, n){
try1 <- arima.out$coef
try2 <- sqrt(diag(arima.out$var.coef))
try.data.frame <- data.frame(matrix(NA,ncol=4,nrow=length(names)))
dimnames(try.data.frame) <- list(names,c('coef','std','tstat','pv'))
try.data.frame[,1] <- try1
for(i in 1:length(try2)) try.data.frame[which(rownames(try.data.frame)==names(try2)[i]),2] <- try2[i]
try.data.frame[,3] <- try.data.frame[,1] / try.data.frame[,2]
try.data.frame[,4] <- round((1-pt(abs(try.data.frame[,3]),df=n-(length(try2)+1)))*2,5)
vector <- rep(NA,length(names))
vector[is.na(try.data.frame[,4])] <- 0
maxi <- which.max(try.data.frame[,4])
continue <- max(try.data.frame[,4],na.rm=TRUE) > .05
vector[maxi] <- 0
list(summary=try.data.frame,next.vector=vector,continue=continue)
}
arimaSelect <- function(series, order=c(13,0,0), seasonal=list(order=c(2,0,0),period=12), include.mean=F){
nrc <- order[1]+order[3]+seasonal$order[1]+seasonal$order[3]
coeff <- matrix(NA, nrow=nrc*2, ncol=nrc)
pval <- matrix(NA, nrow=nrc*2, ncol=nrc)
mylist <- rep(list(NULL), nrc)
names <- NULL
if(order[1] > 0) names <- paste('ar',1:order[1],sep='')
if(order[3] > 0) names <- c( names , paste('ma',1:order[3],sep='') )
if(seasonal$order[1] > 0) names <- c(names, paste('sar',1:seasonal$order[1],sep=''))
if(seasonal$order[3] > 0) names <- c(names, paste('sma',1:seasonal$order[3],sep=''))
arima.out <- arima(series, order=order, seasonal=seasonal, include.mean=include.mean, method='ML')
mylist[[1]] <- arima.out
last.arma <- armaGR(arima.out, names, length(series))
mystop <- FALSE
i <- 1
coeff[i,] <- last.arma[[1]][,1]
pval [i,] <- last.arma[[1]][,4]
i <- 2
aic <- arima.out$aic
while(!mystop){
mylist[[i]] <- arima.out
arima.out <- arima(series, order=order, seasonal=seasonal, include.mean=include.mean, method='ML', fixed=last.arma$next.vector)
aic <- c(aic, arima.out$aic)
last.arma <- armaGR(arima.out, names, length(series))
mystop <- !last.arma$continue
coeff[i,] <- last.arma[[1]][,1]
pval [i,] <- last.arma[[1]][,4]
i <- i+1
}
list(coeff, pval, mylist, aic=aic)
}
arimaSelectplot <- function(arimaSelect.out,noms,choix){
noms <- names(arimaSelect.out[[3]][[1]]$coef)
coeff <- arimaSelect.out[[1]]
k <- min(which(is.na(coeff[,1])))-1
coeff <- coeff[1:k,]
pval <- arimaSelect.out[[2]][1:k,]
aic <- arimaSelect.out$aic[1:k]
coeff[coeff==0] <- NA
n <- ncol(coeff)
if(missing(choix)) choix <- k
layout(matrix(c(1,1,1,2,
3,3,3,2,
3,3,3,4,
5,6,7,7),nr=4),
widths=c(10,35,45,15),
heights=c(30,30,15,15))
couleurs <- rainbow(75)[1:50]#(50)
ticks <- pretty(coeff)
par(mar=c(1,1,3,1))
plot(aic,k:1-.5,type='o',pch=21,bg='blue',cex=2,axes=F,lty=2,xpd=NA)
points(aic[choix],k-choix+.5,pch=21,cex=4,bg=2,xpd=NA)
title('aic',line=2)
par(mar=c(3,0,0,0))
plot(0,axes=F,xlab='',ylab='',xlim=range(ticks),ylim=c(.1,1))
rect(xleft = min(ticks) + (0:49)/50*(max(ticks)-min(ticks)),
xright = min(ticks) + (1:50)/50*(max(ticks)-min(ticks)),
ytop = rep(1,50),
ybottom= rep(0,50),col=couleurs,border=NA)
axis(1,ticks)
rect(xleft=min(ticks),xright=max(ticks),ytop=1,ybottom=0)
text(mean(coeff,na.rm=T),.5,'coefficients',cex=2,font=2)
par(mar=c(1,1,3,1))
image(1:n,1:k,t(coeff[k:1,]),axes=F,col=couleurs,zlim=range(ticks))
for(i in 1:n) for(j in 1:k) if(!is.na(coeff[j,i])) {
if(pval[j,i]<.01) symb = 'green'
else if( (pval[j,i]<.05) & (pval[j,i]>=.01)) symb = 'orange'
else if( (pval[j,i]<.1) & (pval[j,i]>=.05)) symb = 'red'
else symb = 'black'
polygon(c(i+.5 ,i+.2 ,i+.5 ,i+.5),
c(k-j+0.5,k-j+0.5,k-j+0.8,k-j+0.5),
col=symb)
if(j==choix) {
rect(xleft=i-.5,
xright=i+.5,
ybottom=k-j+1.5,
ytop=k-j+.5,
lwd=4)
text(i,
k-j+1,
round(coeff[j,i],2),
cex=1.2,
font=2)
}
else{
rect(xleft=i-.5,xright=i+.5,ybottom=k-j+1.5,ytop=k-j+.5)
text(i,k-j+1,round(coeff[j,i],2),cex=1.2,font=1)
}
}
axis(3,1:n,noms)
par(mar=c(0.5,0,0,0.5))
plot(0,axes=F,xlab='',ylab='',type='n',xlim=c(0,8),ylim=c(-.2,.8))
cols <- c('green','orange','red','black')
niv <- c('0','0.01','0.05','0.1')
for(i in 0:3){
polygon(c(1+2*i ,1+2*i ,1+2*i-.5 ,1+2*i),
c(.4 ,.7 , .4 , .4),
col=cols[i+1])
text(2*i,0.5,niv[i+1],cex=1.5)
}
text(8,.5,1,cex=1.5)
text(4,0,'p-value',cex=2)
box()
residus <- arimaSelect.out[[3]][[choix]]$res
par(mar=c(1,2,4,1))
acf(residus,main='')
title('acf',line=.5)
par(mar=c(1,2,4,1))
pacf(residus,main='')
title('pacf',line=.5)
par(mar=c(2,2,4,1))
qqnorm(residus,main='')
title('qq-norm',line=.5)
qqline(residus)
residus
}
if (par2 == 0) x <- log(x)
if (par2 != 0) x <- x^par2
(selection <- arimaSelect(x, order=c(par6,par3,par7), seasonal=list(order=c(par8,par4,par9), period=par5)))
bitmap(file='test1.png')
resid <- arimaSelectplot(selection)
dev.off()
resid
bitmap(file='test2.png')
acf(resid,length(resid)/2, main='Residual Autocorrelation Function')
dev.off()
bitmap(file='test3.png')
pacf(resid,length(resid)/2, main='Residual Partial Autocorrelation Function')
dev.off()
bitmap(file='test4.png')
cpgram(resid, main='Residual Cumulative Periodogram')
dev.off()
bitmap(file='test5.png')
hist(resid, main='Residual Histogram', xlab='values of Residuals')
dev.off()
bitmap(file='test6.png')
densityplot(~resid,col='black',main='Residual Density Plot', xlab='values of Residuals')
dev.off()
bitmap(file='test7.png')
qqnorm(resid, main='Residual Normal Q-Q Plot')
qqline(resid)
dev.off()
ncols <- length(selection[[1]][1,])
nrows <- length(selection[[2]][,1])-1
load(file='createtable')
a<-table.start()
a<-table.row.start(a)
a<-table.element(a,'ARIMA Parameter Estimation and Backward Selection', ncols+1,TRUE)
a<-table.row.end(a)
a<-table.row.start(a)
a<-table.element(a,'Iteration', header=TRUE)
for (i in 1:ncols) {
a<-table.element(a,names(selection[[3]][[1]]$coef)[i],header=TRUE)
}
a<-table.row.end(a)
for (j in 1:nrows) {
a<-table.row.start(a)
mydum <- 'Estimates ('
mydum <- paste(mydum,j)
mydum <- paste(mydum,')')
a<-table.element(a,mydum, header=TRUE)
for (i in 1:ncols) {
a<-table.element(a,round(selection[[1]][j,i],4))
}
a<-table.row.end(a)
a<-table.row.start(a)
a<-table.element(a,'(p-val)', header=TRUE)
for (i in 1:ncols) {
mydum <- '('
mydum <- paste(mydum,round(selection[[2]][j,i],4),sep='')
mydum <- paste(mydum,')')
a<-table.element(a,mydum)
}
a<-table.row.end(a)
}
a<-table.end(a)
table.save(a,file='mytable.tab')
a<-table.start()
a<-table.row.start(a)
a<-table.element(a,'Estimated ARIMA Residuals', 1,TRUE)
a<-table.row.end(a)
a<-table.row.start(a)
a<-table.element(a,'Value', 1,TRUE)
a<-table.row.end(a)
for (i in (par4*par5+par3):length(resid)) {
a<-table.row.start(a)
a<-table.element(a,resid[i])
a<-table.row.end(a)
}
a<-table.end(a)
table.save(a,file='mytable1.tab')