Free Statistics

of Irreproducible Research!

Author's title

Author*The author of this computation has been verified*
R Software Modulerwasp_arimabackwardselection.wasp
Title produced by softwareARIMA Backward Selection
Date of computationThu, 22 Dec 2016 11:07:26 +0100
Cite this page as followsStatistical Computations at FreeStatistics.org, Office for Research Development and Education, URL https://freestatistics.org/blog/index.php?v=date/2016/Dec/22/t1482401272xesv4kgpe3reigf.htm/, Retrieved Mon, 29 Apr 2024 07:36:11 +0000
Statistical Computations at FreeStatistics.org, Office for Research Development and Education, URL https://freestatistics.org/blog/index.php?pk=302527, Retrieved Mon, 29 Apr 2024 07:36:11 +0000
QR Codes:

Original text written by user:
IsPrivate?No (this computation is public)
User-defined keywords
Estimated Impact109
Family? (F = Feedback message, R = changed R code, M = changed R Module, P = changed Parameters, D = changed Data)
-       [ARIMA Backward Selection] [] [2016-12-22 10:07:26] [6deb082de88ded72ec069288c69f9f98] [Current]
Feedback Forum

Post a new message
Dataseries X:
5410.4
5432.2
5452.9
5477.6
5472.5
5454.9
5446
5010.6
5395.9
5360
5336.9
5333.9
5329.6
5345.7
5353.8
5377.2
5334.1
5351.1
5001
5246.4
5230
5115.8
4972.6
5077.6
5056.9
5070.7
4799.3
5076
5021.5
5026.4
4981.9
4936.6
4901.8
4853.8
4839.2
4821.3
4840.5
4847.6
4832.3
4814.7
4806.4
4803.4
4770.3
4723.4
4667.1
4636.8
4613.2
4605.3
4590.4
4595.4
4600.1
4543.3
4596.4
4575.4
4547.9
4503.7
4446.3
4401.4
4354.3
4336.3
4300.9
4304.1
4273.2
4279.9
4243.1
4199.1
4177.6
4141.7
4088.3
4021.4
3981.2
3937.2
3893.1
3864.7
3847.8
3840.8
3828.4
3798.6
3773
3737.8
3699
3674
3648.8
3645.6
3331
3674.7
3714.5
3739.7
3759.7
3708.6
3717.3
3705.3
3612.8
3665
3670.8
3687.6
3708.2
3737.2
3748.7
3785.3
3787.1
3785.8
3749.7
3716.3
3650
3096.9
3703.2
3716
3736.9
3771.9
3704
3824.2
3733.5
3827.5
3827.6
3696.5
3675.8
3757.5
3753.3
3418.7
3772.9


Summary of computational transaction
Raw Input view raw input (R code)
Raw Outputview raw output of R engine
Computing time7 seconds
R ServerBig Analytics Cloud Computing Center

\begin{tabular}{lllllllll}
\hline
Summary of computational transaction \tabularnewline
Raw Input view raw input (R code)  \tabularnewline
Raw Outputview raw output of R engine  \tabularnewline
Computing time7 seconds \tabularnewline
R ServerBig Analytics Cloud Computing Center \tabularnewline
\hline
\end{tabular}
%Source: https://freestatistics.org/blog/index.php?pk=302527&T=0

[TABLE]
[ROW]
Summary of computational transaction[/C][/ROW] [ROW]Raw Input[/C] view raw input (R code) [/C][/ROW] [ROW]Raw Output[/C]view raw output of R engine [/C][/ROW] [ROW]Computing time[/C]7 seconds[/C][/ROW] [ROW]R Server[/C]Big Analytics Cloud Computing Center[/C][/ROW] [/TABLE] Source: https://freestatistics.org/blog/index.php?pk=302527&T=0

Globally Unique Identifier (entire table): ba.freestatistics.org/blog/index.php?pk=302527&T=0

As an alternative you can also use a QR Code:  

The GUIDs for individual cells are displayed in the table below:

Summary of computational transaction
Raw Input view raw input (R code)
Raw Outputview raw output of R engine
Computing time7 seconds
R ServerBig Analytics Cloud Computing Center


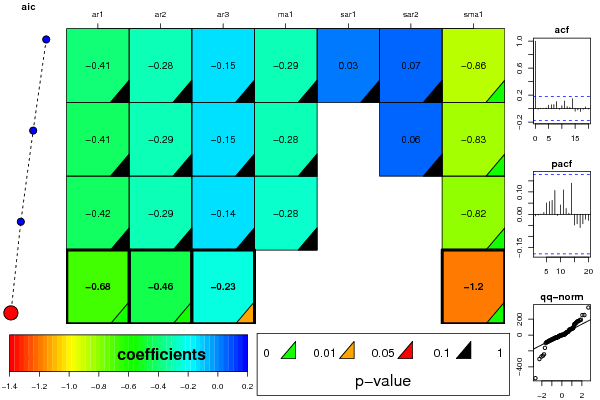
ARIMA Parameter Estimation and Backward Selection
Iterationar1ar2ar3ma1sar1sar2sma1
Estimates ( 1 )-0.4057-0.2841-0.1464-0.29080.02620.0686-0.8591
(p-val)(0.2361 )(0.2322 )(0.3672 )(0.3955 )(0.9046 )(0.7252 )(0.0041 )
Estimates ( 2 )-0.4139-0.2868-0.1496-0.280700.0572-0.8316
(p-val)(0.2329 )(0.2335 )(0.3562 )(0.4176 )(NA )(0.7333 )(0 )
Estimates ( 3 )-0.4212-0.294-0.1427-0.277600-0.8179
(p-val)(0.2293 )(0.2272 )(0.3862 )(0.4277 )(NA )(NA )(0 )
Estimates ( 4 )-0.6824-0.4563-0.2272000-1.202
(p-val)(0 )(1e-04 )(0.0237 )(NA )(NA )(NA )(0 )
Estimates ( 5 )NANANANANANANA
(p-val)(NA )(NA )(NA )(NA )(NA )(NA )(NA )
Estimates ( 6 )NANANANANANANA
(p-val)(NA )(NA )(NA )(NA )(NA )(NA )(NA )
Estimates ( 7 )NANANANANANANA
(p-val)(NA )(NA )(NA )(NA )(NA )(NA )(NA )
Estimates ( 8 )NANANANANANANA
(p-val)(NA )(NA )(NA )(NA )(NA )(NA )(NA )
Estimates ( 9 )NANANANANANANA
(p-val)(NA )(NA )(NA )(NA )(NA )(NA )(NA )
Estimates ( 10 )NANANANANANANA
(p-val)(NA )(NA )(NA )(NA )(NA )(NA )(NA )
Estimates ( 11 )NANANANANANANA
(p-val)(NA )(NA )(NA )(NA )(NA )(NA )(NA )
Estimates ( 12 )NANANANANANANA
(p-val)(NA )(NA )(NA )(NA )(NA )(NA )(NA )
Estimates ( 13 )NANANANANANANA
(p-val)(NA )(NA )(NA )(NA )(NA )(NA )(NA )

\begin{tabular}{lllllllll}
\hline
ARIMA Parameter Estimation and Backward Selection \tabularnewline
Iteration & ar1 & ar2 & ar3 & ma1 & sar1 & sar2 & sma1 \tabularnewline
Estimates ( 1 ) & -0.4057 & -0.2841 & -0.1464 & -0.2908 & 0.0262 & 0.0686 & -0.8591 \tabularnewline
(p-val) & (0.2361 ) & (0.2322 ) & (0.3672 ) & (0.3955 ) & (0.9046 ) & (0.7252 ) & (0.0041 ) \tabularnewline
Estimates ( 2 ) & -0.4139 & -0.2868 & -0.1496 & -0.2807 & 0 & 0.0572 & -0.8316 \tabularnewline
(p-val) & (0.2329 ) & (0.2335 ) & (0.3562 ) & (0.4176 ) & (NA ) & (0.7333 ) & (0 ) \tabularnewline
Estimates ( 3 ) & -0.4212 & -0.294 & -0.1427 & -0.2776 & 0 & 0 & -0.8179 \tabularnewline
(p-val) & (0.2293 ) & (0.2272 ) & (0.3862 ) & (0.4277 ) & (NA ) & (NA ) & (0 ) \tabularnewline
Estimates ( 4 ) & -0.6824 & -0.4563 & -0.2272 & 0 & 0 & 0 & -1.202 \tabularnewline
(p-val) & (0 ) & (1e-04 ) & (0.0237 ) & (NA ) & (NA ) & (NA ) & (0 ) \tabularnewline
Estimates ( 5 ) & NA & NA & NA & NA & NA & NA & NA \tabularnewline
(p-val) & (NA ) & (NA ) & (NA ) & (NA ) & (NA ) & (NA ) & (NA ) \tabularnewline
Estimates ( 6 ) & NA & NA & NA & NA & NA & NA & NA \tabularnewline
(p-val) & (NA ) & (NA ) & (NA ) & (NA ) & (NA ) & (NA ) & (NA ) \tabularnewline
Estimates ( 7 ) & NA & NA & NA & NA & NA & NA & NA \tabularnewline
(p-val) & (NA ) & (NA ) & (NA ) & (NA ) & (NA ) & (NA ) & (NA ) \tabularnewline
Estimates ( 8 ) & NA & NA & NA & NA & NA & NA & NA \tabularnewline
(p-val) & (NA ) & (NA ) & (NA ) & (NA ) & (NA ) & (NA ) & (NA ) \tabularnewline
Estimates ( 9 ) & NA & NA & NA & NA & NA & NA & NA \tabularnewline
(p-val) & (NA ) & (NA ) & (NA ) & (NA ) & (NA ) & (NA ) & (NA ) \tabularnewline
Estimates ( 10 ) & NA & NA & NA & NA & NA & NA & NA \tabularnewline
(p-val) & (NA ) & (NA ) & (NA ) & (NA ) & (NA ) & (NA ) & (NA ) \tabularnewline
Estimates ( 11 ) & NA & NA & NA & NA & NA & NA & NA \tabularnewline
(p-val) & (NA ) & (NA ) & (NA ) & (NA ) & (NA ) & (NA ) & (NA ) \tabularnewline
Estimates ( 12 ) & NA & NA & NA & NA & NA & NA & NA \tabularnewline
(p-val) & (NA ) & (NA ) & (NA ) & (NA ) & (NA ) & (NA ) & (NA ) \tabularnewline
Estimates ( 13 ) & NA & NA & NA & NA & NA & NA & NA \tabularnewline
(p-val) & (NA ) & (NA ) & (NA ) & (NA ) & (NA ) & (NA ) & (NA ) \tabularnewline
\hline
\end{tabular}
%Source: https://freestatistics.org/blog/index.php?pk=302527&T=1

[TABLE]
[ROW][C]ARIMA Parameter Estimation and Backward Selection[/C][/ROW]
[ROW][C]Iteration[/C][C]ar1[/C][C]ar2[/C][C]ar3[/C][C]ma1[/C][C]sar1[/C][C]sar2[/C][C]sma1[/C][/ROW]
[ROW][C]Estimates ( 1 )[/C][C]-0.4057[/C][C]-0.2841[/C][C]-0.1464[/C][C]-0.2908[/C][C]0.0262[/C][C]0.0686[/C][C]-0.8591[/C][/ROW]
[ROW][C](p-val)[/C][C](0.2361 )[/C][C](0.2322 )[/C][C](0.3672 )[/C][C](0.3955 )[/C][C](0.9046 )[/C][C](0.7252 )[/C][C](0.0041 )[/C][/ROW]
[ROW][C]Estimates ( 2 )[/C][C]-0.4139[/C][C]-0.2868[/C][C]-0.1496[/C][C]-0.2807[/C][C]0[/C][C]0.0572[/C][C]-0.8316[/C][/ROW]
[ROW][C](p-val)[/C][C](0.2329 )[/C][C](0.2335 )[/C][C](0.3562 )[/C][C](0.4176 )[/C][C](NA )[/C][C](0.7333 )[/C][C](0 )[/C][/ROW]
[ROW][C]Estimates ( 3 )[/C][C]-0.4212[/C][C]-0.294[/C][C]-0.1427[/C][C]-0.2776[/C][C]0[/C][C]0[/C][C]-0.8179[/C][/ROW]
[ROW][C](p-val)[/C][C](0.2293 )[/C][C](0.2272 )[/C][C](0.3862 )[/C][C](0.4277 )[/C][C](NA )[/C][C](NA )[/C][C](0 )[/C][/ROW]
[ROW][C]Estimates ( 4 )[/C][C]-0.6824[/C][C]-0.4563[/C][C]-0.2272[/C][C]0[/C][C]0[/C][C]0[/C][C]-1.202[/C][/ROW]
[ROW][C](p-val)[/C][C](0 )[/C][C](1e-04 )[/C][C](0.0237 )[/C][C](NA )[/C][C](NA )[/C][C](NA )[/C][C](0 )[/C][/ROW]
[ROW][C]Estimates ( 5 )[/C][C]NA[/C][C]NA[/C][C]NA[/C][C]NA[/C][C]NA[/C][C]NA[/C][C]NA[/C][/ROW]
[ROW][C](p-val)[/C][C](NA )[/C][C](NA )[/C][C](NA )[/C][C](NA )[/C][C](NA )[/C][C](NA )[/C][C](NA )[/C][/ROW]
[ROW][C]Estimates ( 6 )[/C][C]NA[/C][C]NA[/C][C]NA[/C][C]NA[/C][C]NA[/C][C]NA[/C][C]NA[/C][/ROW]
[ROW][C](p-val)[/C][C](NA )[/C][C](NA )[/C][C](NA )[/C][C](NA )[/C][C](NA )[/C][C](NA )[/C][C](NA )[/C][/ROW]
[ROW][C]Estimates ( 7 )[/C][C]NA[/C][C]NA[/C][C]NA[/C][C]NA[/C][C]NA[/C][C]NA[/C][C]NA[/C][/ROW]
[ROW][C](p-val)[/C][C](NA )[/C][C](NA )[/C][C](NA )[/C][C](NA )[/C][C](NA )[/C][C](NA )[/C][C](NA )[/C][/ROW]
[ROW][C]Estimates ( 8 )[/C][C]NA[/C][C]NA[/C][C]NA[/C][C]NA[/C][C]NA[/C][C]NA[/C][C]NA[/C][/ROW]
[ROW][C](p-val)[/C][C](NA )[/C][C](NA )[/C][C](NA )[/C][C](NA )[/C][C](NA )[/C][C](NA )[/C][C](NA )[/C][/ROW]
[ROW][C]Estimates ( 9 )[/C][C]NA[/C][C]NA[/C][C]NA[/C][C]NA[/C][C]NA[/C][C]NA[/C][C]NA[/C][/ROW]
[ROW][C](p-val)[/C][C](NA )[/C][C](NA )[/C][C](NA )[/C][C](NA )[/C][C](NA )[/C][C](NA )[/C][C](NA )[/C][/ROW]
[ROW][C]Estimates ( 10 )[/C][C]NA[/C][C]NA[/C][C]NA[/C][C]NA[/C][C]NA[/C][C]NA[/C][C]NA[/C][/ROW]
[ROW][C](p-val)[/C][C](NA )[/C][C](NA )[/C][C](NA )[/C][C](NA )[/C][C](NA )[/C][C](NA )[/C][C](NA )[/C][/ROW]
[ROW][C]Estimates ( 11 )[/C][C]NA[/C][C]NA[/C][C]NA[/C][C]NA[/C][C]NA[/C][C]NA[/C][C]NA[/C][/ROW]
[ROW][C](p-val)[/C][C](NA )[/C][C](NA )[/C][C](NA )[/C][C](NA )[/C][C](NA )[/C][C](NA )[/C][C](NA )[/C][/ROW]
[ROW][C]Estimates ( 12 )[/C][C]NA[/C][C]NA[/C][C]NA[/C][C]NA[/C][C]NA[/C][C]NA[/C][C]NA[/C][/ROW]
[ROW][C](p-val)[/C][C](NA )[/C][C](NA )[/C][C](NA )[/C][C](NA )[/C][C](NA )[/C][C](NA )[/C][C](NA )[/C][/ROW]
[ROW][C]Estimates ( 13 )[/C][C]NA[/C][C]NA[/C][C]NA[/C][C]NA[/C][C]NA[/C][C]NA[/C][C]NA[/C][/ROW]
[ROW][C](p-val)[/C][C](NA )[/C][C](NA )[/C][C](NA )[/C][C](NA )[/C][C](NA )[/C][C](NA )[/C][C](NA )[/C][/ROW]
[/TABLE]
Source: https://freestatistics.org/blog/index.php?pk=302527&T=1

Globally Unique Identifier (entire table): ba.freestatistics.org/blog/index.php?pk=302527&T=1

As an alternative you can also use a QR Code:  

The GUIDs for individual cells are displayed in the table below:

ARIMA Parameter Estimation and Backward Selection
Iterationar1ar2ar3ma1sar1sar2sma1
Estimates ( 1 )-0.4057-0.2841-0.1464-0.29080.02620.0686-0.8591
(p-val)(0.2361 )(0.2322 )(0.3672 )(0.3955 )(0.9046 )(0.7252 )(0.0041 )
Estimates ( 2 )-0.4139-0.2868-0.1496-0.280700.0572-0.8316
(p-val)(0.2329 )(0.2335 )(0.3562 )(0.4176 )(NA )(0.7333 )(0 )
Estimates ( 3 )-0.4212-0.294-0.1427-0.277600-0.8179
(p-val)(0.2293 )(0.2272 )(0.3862 )(0.4277 )(NA )(NA )(0 )
Estimates ( 4 )-0.6824-0.4563-0.2272000-1.202
(p-val)(0 )(1e-04 )(0.0237 )(NA )(NA )(NA )(0 )
Estimates ( 5 )NANANANANANANA
(p-val)(NA )(NA )(NA )(NA )(NA )(NA )(NA )
Estimates ( 6 )NANANANANANANA
(p-val)(NA )(NA )(NA )(NA )(NA )(NA )(NA )
Estimates ( 7 )NANANANANANANA
(p-val)(NA )(NA )(NA )(NA )(NA )(NA )(NA )
Estimates ( 8 )NANANANANANANA
(p-val)(NA )(NA )(NA )(NA )(NA )(NA )(NA )
Estimates ( 9 )NANANANANANANA
(p-val)(NA )(NA )(NA )(NA )(NA )(NA )(NA )
Estimates ( 10 )NANANANANANANA
(p-val)(NA )(NA )(NA )(NA )(NA )(NA )(NA )
Estimates ( 11 )NANANANANANANA
(p-val)(NA )(NA )(NA )(NA )(NA )(NA )(NA )
Estimates ( 12 )NANANANANANANA
(p-val)(NA )(NA )(NA )(NA )(NA )(NA )(NA )
Estimates ( 13 )NANANANANANANA
(p-val)(NA )(NA )(NA )(NA )(NA )(NA )(NA )


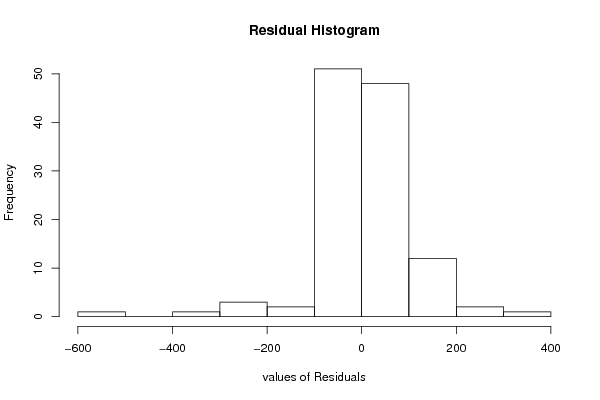
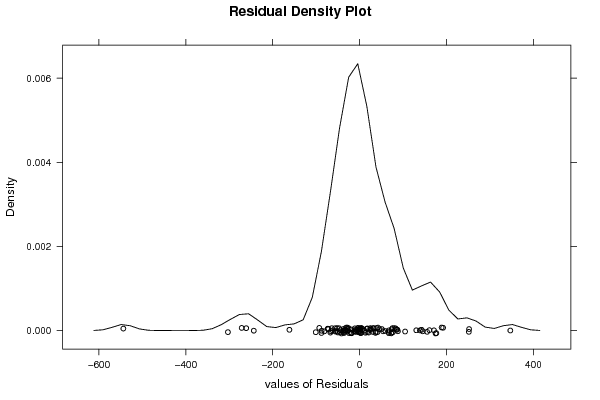
Estimated ARIMA Residuals
Value
-19.13577055795
-3.65957555794956
-10.9227073536597
-8.15924473741152
-35.4355157612088
2.88582801606673
-260.927618339162
346.929317139206
-66.1009507474112
-92.7362950528768
-161.49561091688
-63.9781224207688
-24.3809020990444
-3.54954066338427
-243.561396047807
51.1907933467011
6.83981151920024
24.7252594492629
155.372870939547
130.511703703625
-100.943140812302
-55.0344049913344
2.52972574479108
-55.9825886127076
21.0067608444904
3.95487657933501
67.3868823416131
-73.1572354388292
-28.3945610837207
-28.3239351756759
74.0789033987178
86.9165166762305
-87.7985234288072
-33.5432347361958
-4.53710861704261
-32.5245351483796
-12.5368709066764
-18.7873297688586
54.0347235797212
-87.3060020039313
18.3004682558417
-10.7357908621778
67.3794189793215
75.6917496377728
-62.1865490159402
-36.9502072305854
-35.0351573179554
-56.4809598022167
-50.7833143314714
-41.6308163865338
-8.42155602300948
-36.6545466637151
-49.6370550018465
-72.0109891860645
13.403948190608
38.8538408621974
-47.1472000031582
-44.7806280986517
-31.4300900215126
-72.9386130601415
-67.218761756474
-80.9548387508373
-25.0940035293449
-51.810011917289
-27.412675193777
-31.2354647018235
24.5283206005658
40.9127659729146
-18.6329493378787
16.8379444376597
26.2004919030688
17.3633925238705
-271.356010974634
145.315488567642
176.657439081746
138.892610958301
142.663504324242
30.6007702300798
74.0149690543682
83.3341421888942
-37.4327547672294
72.8908623475173
88.2000185360396
80.3248648107666
160.701029348473
59.0018279946765
66.6533679735123
45.7316446492171
30.2257096518777
42.3161982700176
37.0533366209149
32.7280809715352
-28.5534226579017
-543.800052305453
251.482860788851
188.924723201765
252.027293722674
171.222313946863
11.071858113347
76.7844048597868
-43.9238200923376
84.5127933972057
104.716040141504
-20.1071213109123
-7.44909910837694
192.221330457901
36.6458826253384
-303.059912965148
174.901220393918

\begin{tabular}{lllllllll}
\hline
Estimated ARIMA Residuals \tabularnewline
Value \tabularnewline
-19.13577055795 \tabularnewline
-3.65957555794956 \tabularnewline
-10.9227073536597 \tabularnewline
-8.15924473741152 \tabularnewline
-35.4355157612088 \tabularnewline
2.88582801606673 \tabularnewline
-260.927618339162 \tabularnewline
346.929317139206 \tabularnewline
-66.1009507474112 \tabularnewline
-92.7362950528768 \tabularnewline
-161.49561091688 \tabularnewline
-63.9781224207688 \tabularnewline
-24.3809020990444 \tabularnewline
-3.54954066338427 \tabularnewline
-243.561396047807 \tabularnewline
51.1907933467011 \tabularnewline
6.83981151920024 \tabularnewline
24.7252594492629 \tabularnewline
155.372870939547 \tabularnewline
130.511703703625 \tabularnewline
-100.943140812302 \tabularnewline
-55.0344049913344 \tabularnewline
2.52972574479108 \tabularnewline
-55.9825886127076 \tabularnewline
21.0067608444904 \tabularnewline
3.95487657933501 \tabularnewline
67.3868823416131 \tabularnewline
-73.1572354388292 \tabularnewline
-28.3945610837207 \tabularnewline
-28.3239351756759 \tabularnewline
74.0789033987178 \tabularnewline
86.9165166762305 \tabularnewline
-87.7985234288072 \tabularnewline
-33.5432347361958 \tabularnewline
-4.53710861704261 \tabularnewline
-32.5245351483796 \tabularnewline
-12.5368709066764 \tabularnewline
-18.7873297688586 \tabularnewline
54.0347235797212 \tabularnewline
-87.3060020039313 \tabularnewline
18.3004682558417 \tabularnewline
-10.7357908621778 \tabularnewline
67.3794189793215 \tabularnewline
75.6917496377728 \tabularnewline
-62.1865490159402 \tabularnewline
-36.9502072305854 \tabularnewline
-35.0351573179554 \tabularnewline
-56.4809598022167 \tabularnewline
-50.7833143314714 \tabularnewline
-41.6308163865338 \tabularnewline
-8.42155602300948 \tabularnewline
-36.6545466637151 \tabularnewline
-49.6370550018465 \tabularnewline
-72.0109891860645 \tabularnewline
13.403948190608 \tabularnewline
38.8538408621974 \tabularnewline
-47.1472000031582 \tabularnewline
-44.7806280986517 \tabularnewline
-31.4300900215126 \tabularnewline
-72.9386130601415 \tabularnewline
-67.218761756474 \tabularnewline
-80.9548387508373 \tabularnewline
-25.0940035293449 \tabularnewline
-51.810011917289 \tabularnewline
-27.412675193777 \tabularnewline
-31.2354647018235 \tabularnewline
24.5283206005658 \tabularnewline
40.9127659729146 \tabularnewline
-18.6329493378787 \tabularnewline
16.8379444376597 \tabularnewline
26.2004919030688 \tabularnewline
17.3633925238705 \tabularnewline
-271.356010974634 \tabularnewline
145.315488567642 \tabularnewline
176.657439081746 \tabularnewline
138.892610958301 \tabularnewline
142.663504324242 \tabularnewline
30.6007702300798 \tabularnewline
74.0149690543682 \tabularnewline
83.3341421888942 \tabularnewline
-37.4327547672294 \tabularnewline
72.8908623475173 \tabularnewline
88.2000185360396 \tabularnewline
80.3248648107666 \tabularnewline
160.701029348473 \tabularnewline
59.0018279946765 \tabularnewline
66.6533679735123 \tabularnewline
45.7316446492171 \tabularnewline
30.2257096518777 \tabularnewline
42.3161982700176 \tabularnewline
37.0533366209149 \tabularnewline
32.7280809715352 \tabularnewline
-28.5534226579017 \tabularnewline
-543.800052305453 \tabularnewline
251.482860788851 \tabularnewline
188.924723201765 \tabularnewline
252.027293722674 \tabularnewline
171.222313946863 \tabularnewline
11.071858113347 \tabularnewline
76.7844048597868 \tabularnewline
-43.9238200923376 \tabularnewline
84.5127933972057 \tabularnewline
104.716040141504 \tabularnewline
-20.1071213109123 \tabularnewline
-7.44909910837694 \tabularnewline
192.221330457901 \tabularnewline
36.6458826253384 \tabularnewline
-303.059912965148 \tabularnewline
174.901220393918 \tabularnewline
\hline
\end{tabular}
%Source: https://freestatistics.org/blog/index.php?pk=302527&T=2

[TABLE]
[ROW][C]Estimated ARIMA Residuals[/C][/ROW]
[ROW][C]Value[/C][/ROW]
[ROW][C]-19.13577055795[/C][/ROW]
[ROW][C]-3.65957555794956[/C][/ROW]
[ROW][C]-10.9227073536597[/C][/ROW]
[ROW][C]-8.15924473741152[/C][/ROW]
[ROW][C]-35.4355157612088[/C][/ROW]
[ROW][C]2.88582801606673[/C][/ROW]
[ROW][C]-260.927618339162[/C][/ROW]
[ROW][C]346.929317139206[/C][/ROW]
[ROW][C]-66.1009507474112[/C][/ROW]
[ROW][C]-92.7362950528768[/C][/ROW]
[ROW][C]-161.49561091688[/C][/ROW]
[ROW][C]-63.9781224207688[/C][/ROW]
[ROW][C]-24.3809020990444[/C][/ROW]
[ROW][C]-3.54954066338427[/C][/ROW]
[ROW][C]-243.561396047807[/C][/ROW]
[ROW][C]51.1907933467011[/C][/ROW]
[ROW][C]6.83981151920024[/C][/ROW]
[ROW][C]24.7252594492629[/C][/ROW]
[ROW][C]155.372870939547[/C][/ROW]
[ROW][C]130.511703703625[/C][/ROW]
[ROW][C]-100.943140812302[/C][/ROW]
[ROW][C]-55.0344049913344[/C][/ROW]
[ROW][C]2.52972574479108[/C][/ROW]
[ROW][C]-55.9825886127076[/C][/ROW]
[ROW][C]21.0067608444904[/C][/ROW]
[ROW][C]3.95487657933501[/C][/ROW]
[ROW][C]67.3868823416131[/C][/ROW]
[ROW][C]-73.1572354388292[/C][/ROW]
[ROW][C]-28.3945610837207[/C][/ROW]
[ROW][C]-28.3239351756759[/C][/ROW]
[ROW][C]74.0789033987178[/C][/ROW]
[ROW][C]86.9165166762305[/C][/ROW]
[ROW][C]-87.7985234288072[/C][/ROW]
[ROW][C]-33.5432347361958[/C][/ROW]
[ROW][C]-4.53710861704261[/C][/ROW]
[ROW][C]-32.5245351483796[/C][/ROW]
[ROW][C]-12.5368709066764[/C][/ROW]
[ROW][C]-18.7873297688586[/C][/ROW]
[ROW][C]54.0347235797212[/C][/ROW]
[ROW][C]-87.3060020039313[/C][/ROW]
[ROW][C]18.3004682558417[/C][/ROW]
[ROW][C]-10.7357908621778[/C][/ROW]
[ROW][C]67.3794189793215[/C][/ROW]
[ROW][C]75.6917496377728[/C][/ROW]
[ROW][C]-62.1865490159402[/C][/ROW]
[ROW][C]-36.9502072305854[/C][/ROW]
[ROW][C]-35.0351573179554[/C][/ROW]
[ROW][C]-56.4809598022167[/C][/ROW]
[ROW][C]-50.7833143314714[/C][/ROW]
[ROW][C]-41.6308163865338[/C][/ROW]
[ROW][C]-8.42155602300948[/C][/ROW]
[ROW][C]-36.6545466637151[/C][/ROW]
[ROW][C]-49.6370550018465[/C][/ROW]
[ROW][C]-72.0109891860645[/C][/ROW]
[ROW][C]13.403948190608[/C][/ROW]
[ROW][C]38.8538408621974[/C][/ROW]
[ROW][C]-47.1472000031582[/C][/ROW]
[ROW][C]-44.7806280986517[/C][/ROW]
[ROW][C]-31.4300900215126[/C][/ROW]
[ROW][C]-72.9386130601415[/C][/ROW]
[ROW][C]-67.218761756474[/C][/ROW]
[ROW][C]-80.9548387508373[/C][/ROW]
[ROW][C]-25.0940035293449[/C][/ROW]
[ROW][C]-51.810011917289[/C][/ROW]
[ROW][C]-27.412675193777[/C][/ROW]
[ROW][C]-31.2354647018235[/C][/ROW]
[ROW][C]24.5283206005658[/C][/ROW]
[ROW][C]40.9127659729146[/C][/ROW]
[ROW][C]-18.6329493378787[/C][/ROW]
[ROW][C]16.8379444376597[/C][/ROW]
[ROW][C]26.2004919030688[/C][/ROW]
[ROW][C]17.3633925238705[/C][/ROW]
[ROW][C]-271.356010974634[/C][/ROW]
[ROW][C]145.315488567642[/C][/ROW]
[ROW][C]176.657439081746[/C][/ROW]
[ROW][C]138.892610958301[/C][/ROW]
[ROW][C]142.663504324242[/C][/ROW]
[ROW][C]30.6007702300798[/C][/ROW]
[ROW][C]74.0149690543682[/C][/ROW]
[ROW][C]83.3341421888942[/C][/ROW]
[ROW][C]-37.4327547672294[/C][/ROW]
[ROW][C]72.8908623475173[/C][/ROW]
[ROW][C]88.2000185360396[/C][/ROW]
[ROW][C]80.3248648107666[/C][/ROW]
[ROW][C]160.701029348473[/C][/ROW]
[ROW][C]59.0018279946765[/C][/ROW]
[ROW][C]66.6533679735123[/C][/ROW]
[ROW][C]45.7316446492171[/C][/ROW]
[ROW][C]30.2257096518777[/C][/ROW]
[ROW][C]42.3161982700176[/C][/ROW]
[ROW][C]37.0533366209149[/C][/ROW]
[ROW][C]32.7280809715352[/C][/ROW]
[ROW][C]-28.5534226579017[/C][/ROW]
[ROW][C]-543.800052305453[/C][/ROW]
[ROW][C]251.482860788851[/C][/ROW]
[ROW][C]188.924723201765[/C][/ROW]
[ROW][C]252.027293722674[/C][/ROW]
[ROW][C]171.222313946863[/C][/ROW]
[ROW][C]11.071858113347[/C][/ROW]
[ROW][C]76.7844048597868[/C][/ROW]
[ROW][C]-43.9238200923376[/C][/ROW]
[ROW][C]84.5127933972057[/C][/ROW]
[ROW][C]104.716040141504[/C][/ROW]
[ROW][C]-20.1071213109123[/C][/ROW]
[ROW][C]-7.44909910837694[/C][/ROW]
[ROW][C]192.221330457901[/C][/ROW]
[ROW][C]36.6458826253384[/C][/ROW]
[ROW][C]-303.059912965148[/C][/ROW]
[ROW][C]174.901220393918[/C][/ROW]
[/TABLE]
Source: https://freestatistics.org/blog/index.php?pk=302527&T=2

Globally Unique Identifier (entire table): ba.freestatistics.org/blog/index.php?pk=302527&T=2

As an alternative you can also use a QR Code:  

The GUIDs for individual cells are displayed in the table below:

Estimated ARIMA Residuals
Value
-19.13577055795
-3.65957555794956
-10.9227073536597
-8.15924473741152
-35.4355157612088
2.88582801606673
-260.927618339162
346.929317139206
-66.1009507474112
-92.7362950528768
-161.49561091688
-63.9781224207688
-24.3809020990444
-3.54954066338427
-243.561396047807
51.1907933467011
6.83981151920024
24.7252594492629
155.372870939547
130.511703703625
-100.943140812302
-55.0344049913344
2.52972574479108
-55.9825886127076
21.0067608444904
3.95487657933501
67.3868823416131
-73.1572354388292
-28.3945610837207
-28.3239351756759
74.0789033987178
86.9165166762305
-87.7985234288072
-33.5432347361958
-4.53710861704261
-32.5245351483796
-12.5368709066764
-18.7873297688586
54.0347235797212
-87.3060020039313
18.3004682558417
-10.7357908621778
67.3794189793215
75.6917496377728
-62.1865490159402
-36.9502072305854
-35.0351573179554
-56.4809598022167
-50.7833143314714
-41.6308163865338
-8.42155602300948
-36.6545466637151
-49.6370550018465
-72.0109891860645
13.403948190608
38.8538408621974
-47.1472000031582
-44.7806280986517
-31.4300900215126
-72.9386130601415
-67.218761756474
-80.9548387508373
-25.0940035293449
-51.810011917289
-27.412675193777
-31.2354647018235
24.5283206005658
40.9127659729146
-18.6329493378787
16.8379444376597
26.2004919030688
17.3633925238705
-271.356010974634
145.315488567642
176.657439081746
138.892610958301
142.663504324242
30.6007702300798
74.0149690543682
83.3341421888942
-37.4327547672294
72.8908623475173
88.2000185360396
80.3248648107666
160.701029348473
59.0018279946765
66.6533679735123
45.7316446492171
30.2257096518777
42.3161982700176
37.0533366209149
32.7280809715352
-28.5534226579017
-543.800052305453
251.482860788851
188.924723201765
252.027293722674
171.222313946863
11.071858113347
76.7844048597868
-43.9238200923376
84.5127933972057
104.716040141504
-20.1071213109123
-7.44909910837694
192.221330457901
36.6458826253384
-303.059912965148
174.901220393918


Parameters (Session):
par1 = FALSE ; par2 = 1 ; par3 = 1 ; par4 = 1 ; par5 = 12 ; par6 = 3 ; par7 = 1 ; par8 = 2 ; par9 = 1 ;
Parameters (R input):
par1 = FALSE ; par2 = 1 ; par3 = 1 ; par4 = 1 ; par5 = 12 ; par6 = 3 ; par7 = 1 ; par8 = 2 ; par9 = 1 ;
R code (references can be found in the software module):
library(lattice)
if (par1 == 'TRUE') par1 <- TRUE
if (par1 == 'FALSE') par1 <- FALSE
par2 <- as.numeric(par2) #Box-Cox lambda transformation parameter
par3 <- as.numeric(par3) #degree of non-seasonal differencing
par4 <- as.numeric(par4) #degree of seasonal differencing
par5 <- as.numeric(par5) #seasonal period
par6 <- as.numeric(par6) #degree (p) of the non-seasonal AR(p) polynomial
par7 <- as.numeric(par7) #degree (q) of the non-seasonal MA(q) polynomial
par8 <- as.numeric(par8) #degree (P) of the seasonal AR(P) polynomial
par9 <- as.numeric(par9) #degree (Q) of the seasonal MA(Q) polynomial
armaGR <- function(arima.out, names, n){
try1 <- arima.out$coef
try2 <- sqrt(diag(arima.out$var.coef))
try.data.frame <- data.frame(matrix(NA,ncol=4,nrow=length(names)))
dimnames(try.data.frame) <- list(names,c('coef','std','tstat','pv'))
try.data.frame[,1] <- try1
for(i in 1:length(try2)) try.data.frame[which(rownames(try.data.frame)==names(try2)[i]),2] <- try2[i]
try.data.frame[,3] <- try.data.frame[,1] / try.data.frame[,2]
try.data.frame[,4] <- round((1-pt(abs(try.data.frame[,3]),df=n-(length(try2)+1)))*2,5)
vector <- rep(NA,length(names))
vector[is.na(try.data.frame[,4])] <- 0
maxi <- which.max(try.data.frame[,4])
continue <- max(try.data.frame[,4],na.rm=TRUE) > .05
vector[maxi] <- 0
list(summary=try.data.frame,next.vector=vector,continue=continue)
}
arimaSelect <- function(series, order=c(13,0,0), seasonal=list(order=c(2,0,0),period=12), include.mean=F){
nrc <- order[1]+order[3]+seasonal$order[1]+seasonal$order[3]
coeff <- matrix(NA, nrow=nrc*2, ncol=nrc)
pval <- matrix(NA, nrow=nrc*2, ncol=nrc)
mylist <- rep(list(NULL), nrc)
names <- NULL
if(order[1] > 0) names <- paste('ar',1:order[1],sep='')
if(order[3] > 0) names <- c( names , paste('ma',1:order[3],sep='') )
if(seasonal$order[1] > 0) names <- c(names, paste('sar',1:seasonal$order[1],sep=''))
if(seasonal$order[3] > 0) names <- c(names, paste('sma',1:seasonal$order[3],sep=''))
arima.out <- arima(series, order=order, seasonal=seasonal, include.mean=include.mean, method='ML')
mylist[[1]] <- arima.out
last.arma <- armaGR(arima.out, names, length(series))
mystop <- FALSE
i <- 1
coeff[i,] <- last.arma[[1]][,1]
pval [i,] <- last.arma[[1]][,4]
i <- 2
aic <- arima.out$aic
while(!mystop){
mylist[[i]] <- arima.out
arima.out <- arima(series, order=order, seasonal=seasonal, include.mean=include.mean, method='ML', fixed=last.arma$next.vector)
aic <- c(aic, arima.out$aic)
last.arma <- armaGR(arima.out, names, length(series))
mystop <- !last.arma$continue
coeff[i,] <- last.arma[[1]][,1]
pval [i,] <- last.arma[[1]][,4]
i <- i+1
}
list(coeff, pval, mylist, aic=aic)
}
arimaSelectplot <- function(arimaSelect.out,noms,choix){
noms <- names(arimaSelect.out[[3]][[1]]$coef)
coeff <- arimaSelect.out[[1]]
k <- min(which(is.na(coeff[,1])))-1
coeff <- coeff[1:k,]
pval <- arimaSelect.out[[2]][1:k,]
aic <- arimaSelect.out$aic[1:k]
coeff[coeff==0] <- NA
n <- ncol(coeff)
if(missing(choix)) choix <- k
layout(matrix(c(1,1,1,2,
3,3,3,2,
3,3,3,4,
5,6,7,7),nr=4),
widths=c(10,35,45,15),
heights=c(30,30,15,15))
couleurs <- rainbow(75)[1:50]#(50)
ticks <- pretty(coeff)
par(mar=c(1,1,3,1))
plot(aic,k:1-.5,type='o',pch=21,bg='blue',cex=2,axes=F,lty=2,xpd=NA)
points(aic[choix],k-choix+.5,pch=21,cex=4,bg=2,xpd=NA)
title('aic',line=2)
par(mar=c(3,0,0,0))
plot(0,axes=F,xlab='',ylab='',xlim=range(ticks),ylim=c(.1,1))
rect(xleft = min(ticks) + (0:49)/50*(max(ticks)-min(ticks)),
xright = min(ticks) + (1:50)/50*(max(ticks)-min(ticks)),
ytop = rep(1,50),
ybottom= rep(0,50),col=couleurs,border=NA)
axis(1,ticks)
rect(xleft=min(ticks),xright=max(ticks),ytop=1,ybottom=0)
text(mean(coeff,na.rm=T),.5,'coefficients',cex=2,font=2)
par(mar=c(1,1,3,1))
image(1:n,1:k,t(coeff[k:1,]),axes=F,col=couleurs,zlim=range(ticks))
for(i in 1:n) for(j in 1:k) if(!is.na(coeff[j,i])) {
if(pval[j,i]<.01) symb = 'green'
else if( (pval[j,i]<.05) & (pval[j,i]>=.01)) symb = 'orange'
else if( (pval[j,i]<.1) & (pval[j,i]>=.05)) symb = 'red'
else symb = 'black'
polygon(c(i+.5 ,i+.2 ,i+.5 ,i+.5),
c(k-j+0.5,k-j+0.5,k-j+0.8,k-j+0.5),
col=symb)
if(j==choix) {
rect(xleft=i-.5,
xright=i+.5,
ybottom=k-j+1.5,
ytop=k-j+.5,
lwd=4)
text(i,
k-j+1,
round(coeff[j,i],2),
cex=1.2,
font=2)
}
else{
rect(xleft=i-.5,xright=i+.5,ybottom=k-j+1.5,ytop=k-j+.5)
text(i,k-j+1,round(coeff[j,i],2),cex=1.2,font=1)
}
}
axis(3,1:n,noms)
par(mar=c(0.5,0,0,0.5))
plot(0,axes=F,xlab='',ylab='',type='n',xlim=c(0,8),ylim=c(-.2,.8))
cols <- c('green','orange','red','black')
niv <- c('0','0.01','0.05','0.1')
for(i in 0:3){
polygon(c(1+2*i ,1+2*i ,1+2*i-.5 ,1+2*i),
c(.4 ,.7 , .4 , .4),
col=cols[i+1])
text(2*i,0.5,niv[i+1],cex=1.5)
}
text(8,.5,1,cex=1.5)
text(4,0,'p-value',cex=2)
box()
residus <- arimaSelect.out[[3]][[choix]]$res
par(mar=c(1,2,4,1))
acf(residus,main='')
title('acf',line=.5)
par(mar=c(1,2,4,1))
pacf(residus,main='')
title('pacf',line=.5)
par(mar=c(2,2,4,1))
qqnorm(residus,main='')
title('qq-norm',line=.5)
qqline(residus)
residus
}
if (par2 == 0) x <- log(x)
if (par2 != 0) x <- x^par2
(selection <- arimaSelect(x, order=c(par6,par3,par7), seasonal=list(order=c(par8,par4,par9), period=par5)))
bitmap(file='test1.png')
resid <- arimaSelectplot(selection)
dev.off()
resid
bitmap(file='test2.png')
acf(resid,length(resid)/2, main='Residual Autocorrelation Function')
dev.off()
bitmap(file='test3.png')
pacf(resid,length(resid)/2, main='Residual Partial Autocorrelation Function')
dev.off()
bitmap(file='test4.png')
cpgram(resid, main='Residual Cumulative Periodogram')
dev.off()
bitmap(file='test5.png')
hist(resid, main='Residual Histogram', xlab='values of Residuals')
dev.off()
bitmap(file='test6.png')
densityplot(~resid,col='black',main='Residual Density Plot', xlab='values of Residuals')
dev.off()
bitmap(file='test7.png')
qqnorm(resid, main='Residual Normal Q-Q Plot')
qqline(resid)
dev.off()
ncols <- length(selection[[1]][1,])
nrows <- length(selection[[2]][,1])-1
load(file='createtable')
a<-table.start()
a<-table.row.start(a)
a<-table.element(a,'ARIMA Parameter Estimation and Backward Selection', ncols+1,TRUE)
a<-table.row.end(a)
a<-table.row.start(a)
a<-table.element(a,'Iteration', header=TRUE)
for (i in 1:ncols) {
a<-table.element(a,names(selection[[3]][[1]]$coef)[i],header=TRUE)
}
a<-table.row.end(a)
for (j in 1:nrows) {
a<-table.row.start(a)
mydum <- 'Estimates ('
mydum <- paste(mydum,j)
mydum <- paste(mydum,')')
a<-table.element(a,mydum, header=TRUE)
for (i in 1:ncols) {
a<-table.element(a,round(selection[[1]][j,i],4))
}
a<-table.row.end(a)
a<-table.row.start(a)
a<-table.element(a,'(p-val)', header=TRUE)
for (i in 1:ncols) {
mydum <- '('
mydum <- paste(mydum,round(selection[[2]][j,i],4),sep='')
mydum <- paste(mydum,')')
a<-table.element(a,mydum)
}
a<-table.row.end(a)
}
a<-table.end(a)
table.save(a,file='mytable.tab')
a<-table.start()
a<-table.row.start(a)
a<-table.element(a,'Estimated ARIMA Residuals', 1,TRUE)
a<-table.row.end(a)
a<-table.row.start(a)
a<-table.element(a,'Value', 1,TRUE)
a<-table.row.end(a)
for (i in (par4*par5+par3):length(resid)) {
a<-table.row.start(a)
a<-table.element(a,resid[i])
a<-table.row.end(a)
}
a<-table.end(a)
table.save(a,file='mytable1.tab')