Free Statistics

of Irreproducible Research!

Author's title

Author*The author of this computation has been verified*
R Software Modulerwasp_arimaforecasting.wasp
Title produced by softwareARIMA Forecasting
Date of computationThu, 22 Dec 2016 13:09:10 +0100
Cite this page as followsStatistical Computations at FreeStatistics.org, Office for Research Development and Education, URL https://freestatistics.org/blog/index.php?v=date/2016/Dec/22/t1482408594aaref0vnzbkwltu.htm/, Retrieved Mon, 29 Apr 2024 02:24:34 +0000
Statistical Computations at FreeStatistics.org, Office for Research Development and Education, URL https://freestatistics.org/blog/index.php?pk=302534, Retrieved Mon, 29 Apr 2024 02:24:34 +0000
QR Codes:

Original text written by user:
IsPrivate?No (this computation is public)
User-defined keywords
Estimated Impact91
Family? (F = Feedback message, R = changed R code, M = changed R Module, P = changed Parameters, D = changed Data)
-       [ARIMA Forecasting] [] [2016-12-22 12:09:10] [6deb082de88ded72ec069288c69f9f98] [Current]
Feedback Forum

Post a new message
Dataseries X:
5410.4
5432.2
5452.9
5477.6
5472.5
5454.9
5446
5010.6
5395.9
5360
5336.9
5333.9
5329.6
5345.7
5353.8
5377.2
5334.1
5351.1
5001
5246.4
5230
5115.8
4972.6
5077.6
5056.9
5070.7
4799.3
5076
5021.5
5026.4
4981.9
4936.6
4901.8
4853.8
4839.2
4821.3
4840.5
4847.6
4832.3
4814.7
4806.4
4803.4
4770.3
4723.4
4667.1
4636.8
4613.2
4605.3
4590.4
4595.4
4600.1
4543.3
4596.4
4575.4
4547.9
4503.7
4446.3
4401.4
4354.3
4336.3
4300.9
4304.1
4273.2
4279.9
4243.1
4199.1
4177.6
4141.7
4088.3
4021.4
3981.2
3937.2
3893.1
3864.7
3847.8
3840.8
3828.4
3798.6
3773
3737.8
3699
3674
3648.8
3645.6
3331
3674.7
3714.5
3739.7
3759.7
3708.6
3717.3
3705.3
3612.8
3665
3670.8
3687.6
3708.2
3737.2
3748.7
3785.3
3787.1
3785.8
3749.7
3716.3
3650
3096.9
3703.2
3716
3736.9
3771.9
3704
3824.2
3733.5
3827.5
3827.6
3696.5
3675.8
3757.5
3753.3
3418.7
3772.9


Summary of computational transaction
Raw Input view raw input (R code)
Raw Outputview raw output of R engine
Computing time1 seconds
R ServerBig Analytics Cloud Computing Center

\begin{tabular}{lllllllll}
\hline
Summary of computational transaction \tabularnewline
Raw Input view raw input (R code)  \tabularnewline
Raw Outputview raw output of R engine  \tabularnewline
Computing time1 seconds \tabularnewline
R ServerBig Analytics Cloud Computing Center \tabularnewline
\hline
\end{tabular}
%Source: https://freestatistics.org/blog/index.php?pk=302534&T=0

[TABLE]
[ROW]
Summary of computational transaction[/C][/ROW] [ROW]Raw Input[/C] view raw input (R code) [/C][/ROW] [ROW]Raw Output[/C]view raw output of R engine [/C][/ROW] [ROW]Computing time[/C]1 seconds[/C][/ROW] [ROW]R Server[/C]Big Analytics Cloud Computing Center[/C][/ROW] [/TABLE] Source: https://freestatistics.org/blog/index.php?pk=302534&T=0

Globally Unique Identifier (entire table): ba.freestatistics.org/blog/index.php?pk=302534&T=0

As an alternative you can also use a QR Code:  

The GUIDs for individual cells are displayed in the table below:

Summary of computational transaction
Raw Input view raw input (R code)
Raw Outputview raw output of R engine
Computing time1 seconds
R ServerBig Analytics Cloud Computing Center


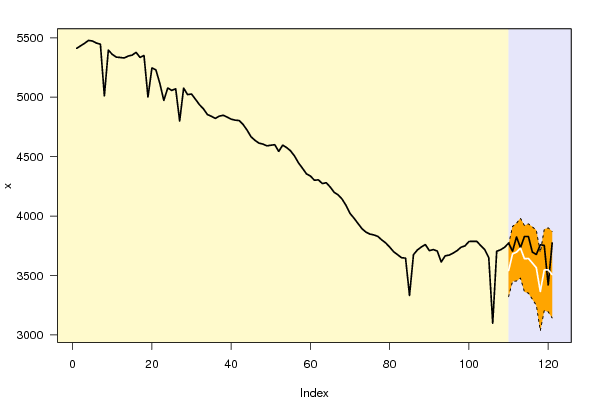
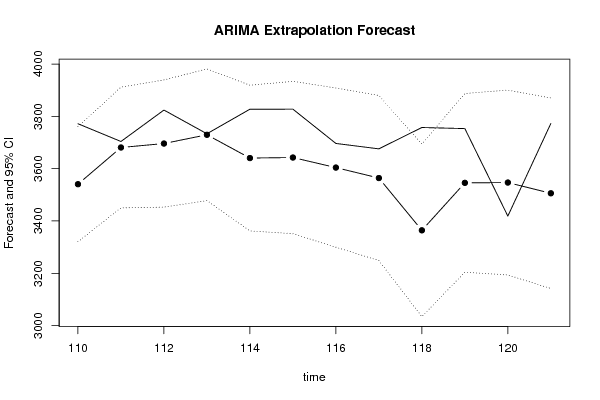
Univariate ARIMA Extrapolation Forecast
timeY[t]F[t]95% LB95% UBp-value(H0: Y[t] = F[t])P(F[t]>Y[t-1])P(F[t]>Y[t-s])P(F[t]>Y[109])
973708.2-------
983737.2-------
993748.7-------
1003785.3-------
1013787.1-------
1023785.8-------
1033749.7-------
1043716.3-------
1053650-------
1063096.9-------
1073703.2-------
1083716-------
1093736.9-------
1103771.93540.64343320.56243760.72450.01970.04020.040.0402
11137043681.01123450.12453911.8980.42260.22020.28280.3176
1123824.23696.12153452.87373939.36920.1510.47470.23620.3712
1133733.53729.67123477.89423981.44810.48810.23090.32740.4776
1143827.53640.62253361.97943919.26560.09430.25680.15360.2491
1153827.63642.67523351.33643934.0140.10670.10690.23580.2631
1163696.53604.17933299.66443908.69410.27620.07520.23530.1965
1173675.83564.1953248.49973879.89020.24420.20570.29710.1418
1183757.53364.16453034.01343694.31560.00980.03220.94370.0135
1193753.33545.80443203.95363887.65520.11710.11240.18340.1366
1203418.73546.95453193.44633900.46260.23850.12630.17430.1461
1213772.93505.94543141.58953870.30130.07550.68060.1070.107

\begin{tabular}{lllllllll}
\hline
Univariate ARIMA Extrapolation Forecast \tabularnewline
time & Y[t] & F[t] & 95% LB & 95% UB & p-value(H0: Y[t] = F[t]) & P(F[t]>Y[t-1]) & P(F[t]>Y[t-s]) & P(F[t]>Y[109]) \tabularnewline
97 & 3708.2 & - & - & - & - & - & - & - \tabularnewline
98 & 3737.2 & - & - & - & - & - & - & - \tabularnewline
99 & 3748.7 & - & - & - & - & - & - & - \tabularnewline
100 & 3785.3 & - & - & - & - & - & - & - \tabularnewline
101 & 3787.1 & - & - & - & - & - & - & - \tabularnewline
102 & 3785.8 & - & - & - & - & - & - & - \tabularnewline
103 & 3749.7 & - & - & - & - & - & - & - \tabularnewline
104 & 3716.3 & - & - & - & - & - & - & - \tabularnewline
105 & 3650 & - & - & - & - & - & - & - \tabularnewline
106 & 3096.9 & - & - & - & - & - & - & - \tabularnewline
107 & 3703.2 & - & - & - & - & - & - & - \tabularnewline
108 & 3716 & - & - & - & - & - & - & - \tabularnewline
109 & 3736.9 & - & - & - & - & - & - & - \tabularnewline
110 & 3771.9 & 3540.6434 & 3320.5624 & 3760.7245 & 0.0197 & 0.0402 & 0.04 & 0.0402 \tabularnewline
111 & 3704 & 3681.0112 & 3450.1245 & 3911.898 & 0.4226 & 0.2202 & 0.2828 & 0.3176 \tabularnewline
112 & 3824.2 & 3696.1215 & 3452.8737 & 3939.3692 & 0.151 & 0.4747 & 0.2362 & 0.3712 \tabularnewline
113 & 3733.5 & 3729.6712 & 3477.8942 & 3981.4481 & 0.4881 & 0.2309 & 0.3274 & 0.4776 \tabularnewline
114 & 3827.5 & 3640.6225 & 3361.9794 & 3919.2656 & 0.0943 & 0.2568 & 0.1536 & 0.2491 \tabularnewline
115 & 3827.6 & 3642.6752 & 3351.3364 & 3934.014 & 0.1067 & 0.1069 & 0.2358 & 0.2631 \tabularnewline
116 & 3696.5 & 3604.1793 & 3299.6644 & 3908.6941 & 0.2762 & 0.0752 & 0.2353 & 0.1965 \tabularnewline
117 & 3675.8 & 3564.195 & 3248.4997 & 3879.8902 & 0.2442 & 0.2057 & 0.2971 & 0.1418 \tabularnewline
118 & 3757.5 & 3364.1645 & 3034.0134 & 3694.3156 & 0.0098 & 0.0322 & 0.9437 & 0.0135 \tabularnewline
119 & 3753.3 & 3545.8044 & 3203.9536 & 3887.6552 & 0.1171 & 0.1124 & 0.1834 & 0.1366 \tabularnewline
120 & 3418.7 & 3546.9545 & 3193.4463 & 3900.4626 & 0.2385 & 0.1263 & 0.1743 & 0.1461 \tabularnewline
121 & 3772.9 & 3505.9454 & 3141.5895 & 3870.3013 & 0.0755 & 0.6806 & 0.107 & 0.107 \tabularnewline
\hline
\end{tabular}
%Source: https://freestatistics.org/blog/index.php?pk=302534&T=1

[TABLE]
[ROW][C]Univariate ARIMA Extrapolation Forecast[/C][/ROW]
[ROW][C]time[/C][C]Y[t][/C][C]F[t][/C][C]95% LB[/C][C]95% UB[/C][C]p-value(H0: Y[t] = F[t])[/C][C]P(F[t]>Y[t-1])[/C][C]P(F[t]>Y[t-s])[/C][C]P(F[t]>Y[109])[/C][/ROW]
[ROW][C]97[/C][C]3708.2[/C][C]-[/C][C]-[/C][C]-[/C][C]-[/C][C]-[/C][C]-[/C][C]-[/C][/ROW]
[ROW][C]98[/C][C]3737.2[/C][C]-[/C][C]-[/C][C]-[/C][C]-[/C][C]-[/C][C]-[/C][C]-[/C][/ROW]
[ROW][C]99[/C][C]3748.7[/C][C]-[/C][C]-[/C][C]-[/C][C]-[/C][C]-[/C][C]-[/C][C]-[/C][/ROW]
[ROW][C]100[/C][C]3785.3[/C][C]-[/C][C]-[/C][C]-[/C][C]-[/C][C]-[/C][C]-[/C][C]-[/C][/ROW]
[ROW][C]101[/C][C]3787.1[/C][C]-[/C][C]-[/C][C]-[/C][C]-[/C][C]-[/C][C]-[/C][C]-[/C][/ROW]
[ROW][C]102[/C][C]3785.8[/C][C]-[/C][C]-[/C][C]-[/C][C]-[/C][C]-[/C][C]-[/C][C]-[/C][/ROW]
[ROW][C]103[/C][C]3749.7[/C][C]-[/C][C]-[/C][C]-[/C][C]-[/C][C]-[/C][C]-[/C][C]-[/C][/ROW]
[ROW][C]104[/C][C]3716.3[/C][C]-[/C][C]-[/C][C]-[/C][C]-[/C][C]-[/C][C]-[/C][C]-[/C][/ROW]
[ROW][C]105[/C][C]3650[/C][C]-[/C][C]-[/C][C]-[/C][C]-[/C][C]-[/C][C]-[/C][C]-[/C][/ROW]
[ROW][C]106[/C][C]3096.9[/C][C]-[/C][C]-[/C][C]-[/C][C]-[/C][C]-[/C][C]-[/C][C]-[/C][/ROW]
[ROW][C]107[/C][C]3703.2[/C][C]-[/C][C]-[/C][C]-[/C][C]-[/C][C]-[/C][C]-[/C][C]-[/C][/ROW]
[ROW][C]108[/C][C]3716[/C][C]-[/C][C]-[/C][C]-[/C][C]-[/C][C]-[/C][C]-[/C][C]-[/C][/ROW]
[ROW][C]109[/C][C]3736.9[/C][C]-[/C][C]-[/C][C]-[/C][C]-[/C][C]-[/C][C]-[/C][C]-[/C][/ROW]
[ROW][C]110[/C][C]3771.9[/C][C]3540.6434[/C][C]3320.5624[/C][C]3760.7245[/C][C]0.0197[/C][C]0.0402[/C][C]0.04[/C][C]0.0402[/C][/ROW]
[ROW][C]111[/C][C]3704[/C][C]3681.0112[/C][C]3450.1245[/C][C]3911.898[/C][C]0.4226[/C][C]0.2202[/C][C]0.2828[/C][C]0.3176[/C][/ROW]
[ROW][C]112[/C][C]3824.2[/C][C]3696.1215[/C][C]3452.8737[/C][C]3939.3692[/C][C]0.151[/C][C]0.4747[/C][C]0.2362[/C][C]0.3712[/C][/ROW]
[ROW][C]113[/C][C]3733.5[/C][C]3729.6712[/C][C]3477.8942[/C][C]3981.4481[/C][C]0.4881[/C][C]0.2309[/C][C]0.3274[/C][C]0.4776[/C][/ROW]
[ROW][C]114[/C][C]3827.5[/C][C]3640.6225[/C][C]3361.9794[/C][C]3919.2656[/C][C]0.0943[/C][C]0.2568[/C][C]0.1536[/C][C]0.2491[/C][/ROW]
[ROW][C]115[/C][C]3827.6[/C][C]3642.6752[/C][C]3351.3364[/C][C]3934.014[/C][C]0.1067[/C][C]0.1069[/C][C]0.2358[/C][C]0.2631[/C][/ROW]
[ROW][C]116[/C][C]3696.5[/C][C]3604.1793[/C][C]3299.6644[/C][C]3908.6941[/C][C]0.2762[/C][C]0.0752[/C][C]0.2353[/C][C]0.1965[/C][/ROW]
[ROW][C]117[/C][C]3675.8[/C][C]3564.195[/C][C]3248.4997[/C][C]3879.8902[/C][C]0.2442[/C][C]0.2057[/C][C]0.2971[/C][C]0.1418[/C][/ROW]
[ROW][C]118[/C][C]3757.5[/C][C]3364.1645[/C][C]3034.0134[/C][C]3694.3156[/C][C]0.0098[/C][C]0.0322[/C][C]0.9437[/C][C]0.0135[/C][/ROW]
[ROW][C]119[/C][C]3753.3[/C][C]3545.8044[/C][C]3203.9536[/C][C]3887.6552[/C][C]0.1171[/C][C]0.1124[/C][C]0.1834[/C][C]0.1366[/C][/ROW]
[ROW][C]120[/C][C]3418.7[/C][C]3546.9545[/C][C]3193.4463[/C][C]3900.4626[/C][C]0.2385[/C][C]0.1263[/C][C]0.1743[/C][C]0.1461[/C][/ROW]
[ROW][C]121[/C][C]3772.9[/C][C]3505.9454[/C][C]3141.5895[/C][C]3870.3013[/C][C]0.0755[/C][C]0.6806[/C][C]0.107[/C][C]0.107[/C][/ROW]
[/TABLE]
Source: https://freestatistics.org/blog/index.php?pk=302534&T=1

Globally Unique Identifier (entire table): ba.freestatistics.org/blog/index.php?pk=302534&T=1

As an alternative you can also use a QR Code:  

The GUIDs for individual cells are displayed in the table below:

Univariate ARIMA Extrapolation Forecast
timeY[t]F[t]95% LB95% UBp-value(H0: Y[t] = F[t])P(F[t]>Y[t-1])P(F[t]>Y[t-s])P(F[t]>Y[109])
973708.2-------
983737.2-------
993748.7-------
1003785.3-------
1013787.1-------
1023785.8-------
1033749.7-------
1043716.3-------
1053650-------
1063096.9-------
1073703.2-------
1083716-------
1093736.9-------
1103771.93540.64343320.56243760.72450.01970.04020.040.0402
11137043681.01123450.12453911.8980.42260.22020.28280.3176
1123824.23696.12153452.87373939.36920.1510.47470.23620.3712
1133733.53729.67123477.89423981.44810.48810.23090.32740.4776
1143827.53640.62253361.97943919.26560.09430.25680.15360.2491
1153827.63642.67523351.33643934.0140.10670.10690.23580.2631
1163696.53604.17933299.66443908.69410.27620.07520.23530.1965
1173675.83564.1953248.49973879.89020.24420.20570.29710.1418
1183757.53364.16453034.01343694.31560.00980.03220.94370.0135
1193753.33545.80443203.95363887.65520.11710.11240.18340.1366
1203418.73546.95453193.44633900.46260.23850.12630.17430.1461
1213772.93505.94543141.58953870.30130.07550.68060.1070.107


Univariate ARIMA Extrapolation Forecast Performance
time% S.E.PEMAPEsMAPESq.EMSERMSEScaledEMASE
1100.03170.06130.06130.063253479.596001.95771.9577
1110.0320.00620.03380.0347528.48427004.04164.32910.19461.0762
1120.03360.03350.03370.034516404.111723470.7305153.20161.08421.0788
1130.03440.0010.02550.026114.659917606.7129132.69030.03240.8172
1140.0390.04880.03020.030934923.196121070.0095145.15511.5820.9702
1150.04080.04830.03320.03434197.182823257.8717152.50531.56551.0694
1160.04310.0250.0320.03288523.120921152.9073145.44040.78151.0283
1170.04520.03040.03180.032512455.684320065.7544141.65360.94481.0178
1180.05010.10470.03990.0412154712.814335026.5389187.15383.32981.2747
1190.04920.05530.04140.042843054.42635829.3276189.28641.75651.3229
1200.0508-0.03750.04110.042216449.206234067.4984184.5738-1.08571.3013
1210.0530.07080.04360.044871264.756437167.2699192.78812.25991.3812

\begin{tabular}{lllllllll}
\hline
Univariate ARIMA Extrapolation Forecast Performance \tabularnewline
time & % S.E. & PE & MAPE & sMAPE & Sq.E & MSE & RMSE & ScaledE & MASE \tabularnewline
110 & 0.0317 & 0.0613 & 0.0613 & 0.0632 & 53479.596 & 0 & 0 & 1.9577 & 1.9577 \tabularnewline
111 & 0.032 & 0.0062 & 0.0338 & 0.0347 & 528.484 & 27004.04 & 164.3291 & 0.1946 & 1.0762 \tabularnewline
112 & 0.0336 & 0.0335 & 0.0337 & 0.0345 & 16404.1117 & 23470.7305 & 153.2016 & 1.0842 & 1.0788 \tabularnewline
113 & 0.0344 & 0.001 & 0.0255 & 0.0261 & 14.6599 & 17606.7129 & 132.6903 & 0.0324 & 0.8172 \tabularnewline
114 & 0.039 & 0.0488 & 0.0302 & 0.0309 & 34923.1961 & 21070.0095 & 145.1551 & 1.582 & 0.9702 \tabularnewline
115 & 0.0408 & 0.0483 & 0.0332 & 0.034 & 34197.1828 & 23257.8717 & 152.5053 & 1.5655 & 1.0694 \tabularnewline
116 & 0.0431 & 0.025 & 0.032 & 0.0328 & 8523.1209 & 21152.9073 & 145.4404 & 0.7815 & 1.0283 \tabularnewline
117 & 0.0452 & 0.0304 & 0.0318 & 0.0325 & 12455.6843 & 20065.7544 & 141.6536 & 0.9448 & 1.0178 \tabularnewline
118 & 0.0501 & 0.1047 & 0.0399 & 0.0412 & 154712.8143 & 35026.5389 & 187.1538 & 3.3298 & 1.2747 \tabularnewline
119 & 0.0492 & 0.0553 & 0.0414 & 0.0428 & 43054.426 & 35829.3276 & 189.2864 & 1.7565 & 1.3229 \tabularnewline
120 & 0.0508 & -0.0375 & 0.0411 & 0.0422 & 16449.2062 & 34067.4984 & 184.5738 & -1.0857 & 1.3013 \tabularnewline
121 & 0.053 & 0.0708 & 0.0436 & 0.0448 & 71264.7564 & 37167.2699 & 192.7881 & 2.2599 & 1.3812 \tabularnewline
\hline
\end{tabular}
%Source: https://freestatistics.org/blog/index.php?pk=302534&T=2

[TABLE]
[ROW][C]Univariate ARIMA Extrapolation Forecast Performance[/C][/ROW]
[ROW][C]time[/C][C]% S.E.[/C][C]PE[/C][C]MAPE[/C][C]sMAPE[/C][C]Sq.E[/C][C]MSE[/C][C]RMSE[/C][C]ScaledE[/C][C]MASE[/C][/ROW]
[ROW][C]110[/C][C]0.0317[/C][C]0.0613[/C][C]0.0613[/C][C]0.0632[/C][C]53479.596[/C][C]0[/C][C]0[/C][C]1.9577[/C][C]1.9577[/C][/ROW]
[ROW][C]111[/C][C]0.032[/C][C]0.0062[/C][C]0.0338[/C][C]0.0347[/C][C]528.484[/C][C]27004.04[/C][C]164.3291[/C][C]0.1946[/C][C]1.0762[/C][/ROW]
[ROW][C]112[/C][C]0.0336[/C][C]0.0335[/C][C]0.0337[/C][C]0.0345[/C][C]16404.1117[/C][C]23470.7305[/C][C]153.2016[/C][C]1.0842[/C][C]1.0788[/C][/ROW]
[ROW][C]113[/C][C]0.0344[/C][C]0.001[/C][C]0.0255[/C][C]0.0261[/C][C]14.6599[/C][C]17606.7129[/C][C]132.6903[/C][C]0.0324[/C][C]0.8172[/C][/ROW]
[ROW][C]114[/C][C]0.039[/C][C]0.0488[/C][C]0.0302[/C][C]0.0309[/C][C]34923.1961[/C][C]21070.0095[/C][C]145.1551[/C][C]1.582[/C][C]0.9702[/C][/ROW]
[ROW][C]115[/C][C]0.0408[/C][C]0.0483[/C][C]0.0332[/C][C]0.034[/C][C]34197.1828[/C][C]23257.8717[/C][C]152.5053[/C][C]1.5655[/C][C]1.0694[/C][/ROW]
[ROW][C]116[/C][C]0.0431[/C][C]0.025[/C][C]0.032[/C][C]0.0328[/C][C]8523.1209[/C][C]21152.9073[/C][C]145.4404[/C][C]0.7815[/C][C]1.0283[/C][/ROW]
[ROW][C]117[/C][C]0.0452[/C][C]0.0304[/C][C]0.0318[/C][C]0.0325[/C][C]12455.6843[/C][C]20065.7544[/C][C]141.6536[/C][C]0.9448[/C][C]1.0178[/C][/ROW]
[ROW][C]118[/C][C]0.0501[/C][C]0.1047[/C][C]0.0399[/C][C]0.0412[/C][C]154712.8143[/C][C]35026.5389[/C][C]187.1538[/C][C]3.3298[/C][C]1.2747[/C][/ROW]
[ROW][C]119[/C][C]0.0492[/C][C]0.0553[/C][C]0.0414[/C][C]0.0428[/C][C]43054.426[/C][C]35829.3276[/C][C]189.2864[/C][C]1.7565[/C][C]1.3229[/C][/ROW]
[ROW][C]120[/C][C]0.0508[/C][C]-0.0375[/C][C]0.0411[/C][C]0.0422[/C][C]16449.2062[/C][C]34067.4984[/C][C]184.5738[/C][C]-1.0857[/C][C]1.3013[/C][/ROW]
[ROW][C]121[/C][C]0.053[/C][C]0.0708[/C][C]0.0436[/C][C]0.0448[/C][C]71264.7564[/C][C]37167.2699[/C][C]192.7881[/C][C]2.2599[/C][C]1.3812[/C][/ROW]
[/TABLE]
Source: https://freestatistics.org/blog/index.php?pk=302534&T=2

Globally Unique Identifier (entire table): ba.freestatistics.org/blog/index.php?pk=302534&T=2

As an alternative you can also use a QR Code:  

The GUIDs for individual cells are displayed in the table below:

Univariate ARIMA Extrapolation Forecast Performance
time% S.E.PEMAPEsMAPESq.EMSERMSEScaledEMASE
1100.03170.06130.06130.063253479.596001.95771.9577
1110.0320.00620.03380.0347528.48427004.04164.32910.19461.0762
1120.03360.03350.03370.034516404.111723470.7305153.20161.08421.0788
1130.03440.0010.02550.026114.659917606.7129132.69030.03240.8172
1140.0390.04880.03020.030934923.196121070.0095145.15511.5820.9702
1150.04080.04830.03320.03434197.182823257.8717152.50531.56551.0694
1160.04310.0250.0320.03288523.120921152.9073145.44040.78151.0283
1170.04520.03040.03180.032512455.684320065.7544141.65360.94481.0178
1180.05010.10470.03990.0412154712.814335026.5389187.15383.32981.2747
1190.04920.05530.04140.042843054.42635829.3276189.28641.75651.3229
1200.0508-0.03750.04110.042216449.206234067.4984184.5738-1.08571.3013
1210.0530.07080.04360.044871264.756437167.2699192.78812.25991.3812


Parameters (Session):
par1 = 12 ; par2 = 1 ; par3 = 1 ; par4 = 1 ; par5 = 12 ; par6 = 3 ; par7 = 0 ; par8 = 0 ; par9 = 1 ; par10 = FALSE ;
Parameters (R input):
par1 = 12 ; par2 = 1 ; par3 = 1 ; par4 = 1 ; par5 = 12 ; par6 = 3 ; par7 = 0 ; par8 = 0 ; par9 = 1 ; par10 = FALSE ;
R code (references can be found in the software module):
par1 <- as.numeric(par1) #cut off periods
par2 <- as.numeric(par2) #lambda
par3 <- as.numeric(par3) #degree of non-seasonal differencing
par4 <- as.numeric(par4) #degree of seasonal differencing
par5 <- as.numeric(par5) #seasonal period
par6 <- as.numeric(par6) #p
par7 <- as.numeric(par7) #q
par8 <- as.numeric(par8) #P
par9 <- as.numeric(par9) #Q
if (par10 == 'TRUE') par10 <- TRUE
if (par10 == 'FALSE') par10 <- FALSE
if (par2 == 0) x <- log(x)
if (par2 != 0) x <- x^par2
lx <- length(x)
first <- lx - 2*par1
nx <- lx - par1
nx1 <- nx + 1
fx <- lx - nx
if (fx < 1) {
fx <- par5*2
nx1 <- lx + fx - 1
first <- lx - 2*fx
}
first <- 1
if (fx < 3) fx <- round(lx/10,0)
(arima.out <- arima(x[1:nx], order=c(par6,par3,par7), seasonal=list(order=c(par8,par4,par9), period=par5), include.mean=par10, method='ML'))
(forecast <- predict(arima.out,fx))
(lb <- forecast$pred - 1.96 * forecast$se)
(ub <- forecast$pred + 1.96 * forecast$se)
if (par2 == 0) {
x <- exp(x)
forecast$pred <- exp(forecast$pred)
lb <- exp(lb)
ub <- exp(ub)
}
if (par2 != 0) {
x <- x^(1/par2)
forecast$pred <- forecast$pred^(1/par2)
lb <- lb^(1/par2)
ub <- ub^(1/par2)
}
if (par2 < 0) {
olb <- lb
lb <- ub
ub <- olb
}
(actandfor <- c(x[1:nx], forecast$pred))
(perc.se <- (ub-forecast$pred)/1.96/forecast$pred)
bitmap(file='test1.png')
opar <- par(mar=c(4,4,2,2),las=1)
ylim <- c( min(x[first:nx],lb), max(x[first:nx],ub))
plot(x,ylim=ylim,type='n',xlim=c(first,lx))
usr <- par('usr')
rect(usr[1],usr[3],nx+1,usr[4],border=NA,col='lemonchiffon')
rect(nx1,usr[3],usr[2],usr[4],border=NA,col='lavender')
abline(h= (-3:3)*2 , col ='gray', lty =3)
polygon( c(nx1:lx,lx:nx1), c(lb,rev(ub)), col = 'orange', lty=2,border=NA)
lines(nx1:lx, lb , lty=2)
lines(nx1:lx, ub , lty=2)
lines(x, lwd=2)
lines(nx1:lx, forecast$pred , lwd=2 , col ='white')
box()
par(opar)
dev.off()
prob.dec <- array(NA, dim=fx)
prob.sdec <- array(NA, dim=fx)
prob.ldec <- array(NA, dim=fx)
prob.pval <- array(NA, dim=fx)
perf.pe <- array(0, dim=fx)
perf.spe <- array(0, dim=fx)
perf.scalederr <- array(0, dim=fx)
perf.mase <- array(0, dim=fx)
perf.mase1 <- array(0, dim=fx)
perf.mape <- array(0, dim=fx)
perf.smape <- array(0, dim=fx)
perf.mape1 <- array(0, dim=fx)
perf.smape1 <- array(0,dim=fx)
perf.se <- array(0, dim=fx)
perf.mse <- array(0, dim=fx)
perf.mse1 <- array(0, dim=fx)
perf.rmse <- array(0, dim=fx)
perf.scaleddenom <- 0
for (i in 2:fx) {
perf.scaleddenom = perf.scaleddenom + abs(x[nx+i] - x[nx+i-1])
}
perf.scaleddenom = perf.scaleddenom / (fx-1)
for (i in 1:fx) {
locSD <- (ub[i] - forecast$pred[i]) / 1.96
perf.scalederr[i] = (x[nx+i] - forecast$pred[i]) / perf.scaleddenom
perf.pe[i] = (x[nx+i] - forecast$pred[i]) / x[nx+i]
perf.spe[i] = 2*(x[nx+i] - forecast$pred[i]) / (x[nx+i] + forecast$pred[i])
perf.se[i] = (x[nx+i] - forecast$pred[i])^2
prob.dec[i] = pnorm((x[nx+i-1] - forecast$pred[i]) / locSD)
prob.sdec[i] = pnorm((x[nx+i-par5] - forecast$pred[i]) / locSD)
prob.ldec[i] = pnorm((x[nx] - forecast$pred[i]) / locSD)
prob.pval[i] = pnorm(abs(x[nx+i] - forecast$pred[i]) / locSD)
}
perf.mape[1] = abs(perf.pe[1])
perf.smape[1] = abs(perf.spe[1])
perf.mape1[1] = perf.mape[1]
perf.smape1[1] = perf.smape[1]
perf.mse[1] = perf.se[1]
perf.mase[1] = abs(perf.scalederr[1])
perf.mase1[1] = perf.mase[1]
for (i in 2:fx) {
perf.mape[i] = perf.mape[i-1] + abs(perf.pe[i])
perf.mape1[i] = perf.mape[i] / i
perf.smape[i] = perf.smape[i-1] + abs(perf.spe[i])
perf.smape1[i] = perf.smape[i] / i
perf.mse[i] = perf.mse[i-1] + perf.se[i]
perf.mse1[i] = perf.mse[i] / i
perf.mase[i] = perf.mase[i-1] + abs(perf.scalederr[i])
perf.mase1[i] = perf.mase[i] / i
}
perf.rmse = sqrt(perf.mse1)
bitmap(file='test2.png')
plot(forecast$pred, pch=19, type='b',main='ARIMA Extrapolation Forecast', ylab='Forecast and 95% CI', xlab='time',ylim=c(min(lb),max(ub)))
dum <- forecast$pred
dum[1:par1] <- x[(nx+1):lx]
lines(dum, lty=1)
lines(ub,lty=3)
lines(lb,lty=3)
dev.off()
load(file='createtable')
a<-table.start()
a<-table.row.start(a)
a<-table.element(a,'Univariate ARIMA Extrapolation Forecast',9,TRUE)
a<-table.row.end(a)
a<-table.row.start(a)
a<-table.element(a,'time',1,header=TRUE)
a<-table.element(a,'Y[t]',1,header=TRUE)
a<-table.element(a,'F[t]',1,header=TRUE)
a<-table.element(a,'95% LB',1,header=TRUE)
a<-table.element(a,'95% UB',1,header=TRUE)
a<-table.element(a,'p-value
(H0: Y[t] = F[t])',1,header=TRUE)
a<-table.element(a,'P(F[t]>Y[t-1])',1,header=TRUE)
a<-table.element(a,'P(F[t]>Y[t-s])',1,header=TRUE)
mylab <- paste('P(F[t]>Y[',nx,sep='')
mylab <- paste(mylab,'])',sep='')
a<-table.element(a,mylab,1,header=TRUE)
a<-table.row.end(a)
for (i in (nx-par5):nx) {
a<-table.row.start(a)
a<-table.element(a,i,header=TRUE)
a<-table.element(a,x[i])
a<-table.element(a,'-')
a<-table.row.end(a)
}
for (i in 1:fx) {
a<-table.row.start(a)
a<-table.element(a,nx+i,header=TRUE)
a<-table.element(a,round(x[nx+i],4))
a<-table.element(a,round(forecast$pred[i],4))
a<-table.element(a,round(lb[i],4))
a<-table.element(a,round(ub[i],4))
a<-table.element(a,round((1-prob.pval[i]),4))
a<-table.element(a,round((1-prob.dec[i]),4))
a<-table.element(a,round((1-prob.sdec[i]),4))
a<-table.element(a,round((1-prob.ldec[i]),4))
a<-table.row.end(a)
}
a<-table.end(a)
table.save(a,file='mytable.tab')
a<-table.start()
a<-table.row.start(a)
a<-table.element(a,'Univariate ARIMA Extrapolation Forecast Performance',10,TRUE)
a<-table.row.end(a)
a<-table.row.start(a)
a<-table.element(a,'time',1,header=TRUE)
a<-table.element(a,'% S.E.',1,header=TRUE)
a<-table.element(a,'PE',1,header=TRUE)
a<-table.element(a,'MAPE',1,header=TRUE)
a<-table.element(a,'sMAPE',1,header=TRUE)
a<-table.element(a,'Sq.E',1,header=TRUE)
a<-table.element(a,'MSE',1,header=TRUE)
a<-table.element(a,'RMSE',1,header=TRUE)
a<-table.element(a,'ScaledE',1,header=TRUE)
a<-table.element(a,'MASE',1,header=TRUE)
a<-table.row.end(a)
for (i in 1:fx) {
a<-table.row.start(a)
a<-table.element(a,nx+i,header=TRUE)
a<-table.element(a,round(perc.se[i],4))
a<-table.element(a,round(perf.pe[i],4))
a<-table.element(a,round(perf.mape1[i],4))
a<-table.element(a,round(perf.smape1[i],4))
a<-table.element(a,round(perf.se[i],4))
a<-table.element(a,round(perf.mse1[i],4))
a<-table.element(a,round(perf.rmse[i],4))
a<-table.element(a,round(perf.scalederr[i],4))
a<-table.element(a,round(perf.mase1[i],4))
a<-table.row.end(a)
}
a<-table.end(a)
table.save(a,file='mytable1.tab')