Free Statistics

of Irreproducible Research!

Author's title

Author*The author of this computation has been verified*
R Software Modulerwasp_autocorrelation.wasp
Title produced by software(Partial) Autocorrelation Function
Date of computationThu, 22 Dec 2016 13:23:55 +0100
Cite this page as followsStatistical Computations at FreeStatistics.org, Office for Research Development and Education, URL https://freestatistics.org/blog/index.php?v=date/2016/Dec/22/t1482409476gtymd3sf5n7m40b.htm/, Retrieved Sun, 28 Apr 2024 22:58:46 +0000
Statistical Computations at FreeStatistics.org, Office for Research Development and Education, URL https://freestatistics.org/blog/index.php?pk=302535, Retrieved Sun, 28 Apr 2024 22:58:46 +0000
QR Codes:

Original text written by user:
IsPrivate?No (this computation is public)
User-defined keywords
Estimated Impact99
Family? (F = Feedback message, R = changed R code, M = changed R Module, P = changed Parameters, D = changed Data)
-     [Multiple Regression] [] [2016-12-19 12:24:41] [937b9e6718912fc8986df66e31b6c342]
- RMPD    [(Partial) Autocorrelation Function] [] [2016-12-22 12:23:55] [863feeaf19a0ddfce7bd9c25059c4d8a] [Current]
Feedback Forum

Post a new message
Dataseries X:
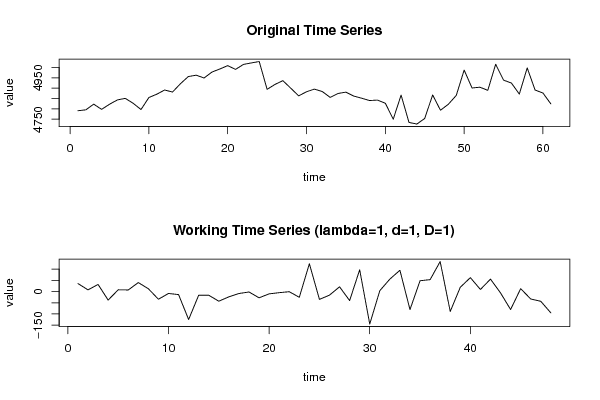
4790.92
4795.33
4822.62
4797.52
4822.17
4843.08
4850.79
4827.02
4796.65
4854.96
4870.81
4891.06
4881.38
4921.43
4956.21
4962.81
4949.38
4977.99
4992.73
5009.02
4990.98
5014.96
5022.23
5028.83
4894.36
4918.13
4936.4
4899.87
4862.89
4882.69
4895.46
4883.8
4855.4
4874.33
4880.94
4861.79
4851.44
4840.22
4842.42
4827.02
4749.77
4866.63
4734.37
4726.44
4753.51
4867.29
4793.35
4822.4
4865.09
4987.67
4900.96
4904.71
4889.52
5015.63
4938.81
4924.73
4871.48
4998.24
4891.06
4876.54
4824.15


Summary of computational transaction
Raw Input view raw input (R code)
Raw Outputview raw output of R engine
Computing time1 seconds
R ServerBig Analytics Cloud Computing Center

\begin{tabular}{lllllllll}
\hline
Summary of computational transaction \tabularnewline
Raw Input view raw input (R code)  \tabularnewline
Raw Outputview raw output of R engine  \tabularnewline
Computing time1 seconds \tabularnewline
R ServerBig Analytics Cloud Computing Center \tabularnewline
\hline
\end{tabular}
%Source: https://freestatistics.org/blog/index.php?pk=302535&T=0

[TABLE]
[ROW]
Summary of computational transaction[/C][/ROW] [ROW]Raw Input[/C] view raw input (R code) [/C][/ROW] [ROW]Raw Output[/C]view raw output of R engine [/C][/ROW] [ROW]Computing time[/C]1 seconds[/C][/ROW] [ROW]R Server[/C]Big Analytics Cloud Computing Center[/C][/ROW] [/TABLE] Source: https://freestatistics.org/blog/index.php?pk=302535&T=0

Globally Unique Identifier (entire table): ba.freestatistics.org/blog/index.php?pk=302535&T=0

As an alternative you can also use a QR Code:  

The GUIDs for individual cells are displayed in the table below:

Summary of computational transaction
Raw Input view raw input (R code)
Raw Outputview raw output of R engine
Computing time1 seconds
R ServerBig Analytics Cloud Computing Center


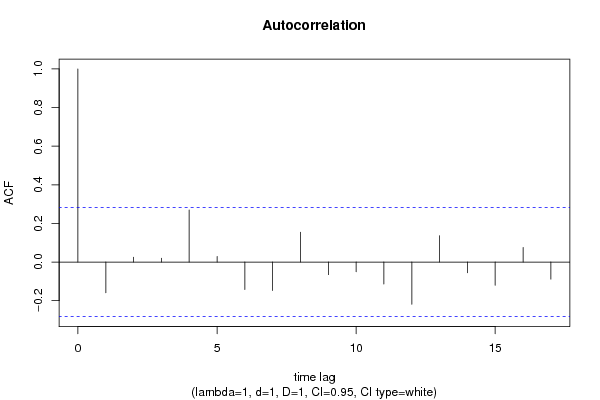
Autocorrelation Function
Time lag kACF(k)T-STATP-value
1-0.159012-1.10170.13805
20.024370.16880.433317
30.0195650.13560.446372
40.2691261.86460.034182
50.0284320.1970.422336
6-0.142749-0.9890.163813
7-0.147586-1.02250.155834
80.1544471.070.144976
9-0.065486-0.45370.326044
10-0.050413-0.34930.364207
11-0.113967-0.78960.216826
12-0.218622-1.51470.068208
130.135830.94110.175695
14-0.055915-0.38740.35009
15-0.12001-0.83150.204917
160.0753640.52210.301987
17-0.088648-0.61420.271001

\begin{tabular}{lllllllll}
\hline
Autocorrelation Function \tabularnewline
Time lag k & ACF(k) & T-STAT & P-value \tabularnewline
1 & -0.159012 & -1.1017 & 0.13805 \tabularnewline
2 & 0.02437 & 0.1688 & 0.433317 \tabularnewline
3 & 0.019565 & 0.1356 & 0.446372 \tabularnewline
4 & 0.269126 & 1.8646 & 0.034182 \tabularnewline
5 & 0.028432 & 0.197 & 0.422336 \tabularnewline
6 & -0.142749 & -0.989 & 0.163813 \tabularnewline
7 & -0.147586 & -1.0225 & 0.155834 \tabularnewline
8 & 0.154447 & 1.07 & 0.144976 \tabularnewline
9 & -0.065486 & -0.4537 & 0.326044 \tabularnewline
10 & -0.050413 & -0.3493 & 0.364207 \tabularnewline
11 & -0.113967 & -0.7896 & 0.216826 \tabularnewline
12 & -0.218622 & -1.5147 & 0.068208 \tabularnewline
13 & 0.13583 & 0.9411 & 0.175695 \tabularnewline
14 & -0.055915 & -0.3874 & 0.35009 \tabularnewline
15 & -0.12001 & -0.8315 & 0.204917 \tabularnewline
16 & 0.075364 & 0.5221 & 0.301987 \tabularnewline
17 & -0.088648 & -0.6142 & 0.271001 \tabularnewline
\hline
\end{tabular}
%Source: https://freestatistics.org/blog/index.php?pk=302535&T=1

[TABLE]
[ROW][C]Autocorrelation Function[/C][/ROW]
[ROW][C]Time lag k[/C][C]ACF(k)[/C][C]T-STAT[/C][C]P-value[/C][/ROW]
[ROW][C]1[/C][C]-0.159012[/C][C]-1.1017[/C][C]0.13805[/C][/ROW]
[ROW][C]2[/C][C]0.02437[/C][C]0.1688[/C][C]0.433317[/C][/ROW]
[ROW][C]3[/C][C]0.019565[/C][C]0.1356[/C][C]0.446372[/C][/ROW]
[ROW][C]4[/C][C]0.269126[/C][C]1.8646[/C][C]0.034182[/C][/ROW]
[ROW][C]5[/C][C]0.028432[/C][C]0.197[/C][C]0.422336[/C][/ROW]
[ROW][C]6[/C][C]-0.142749[/C][C]-0.989[/C][C]0.163813[/C][/ROW]
[ROW][C]7[/C][C]-0.147586[/C][C]-1.0225[/C][C]0.155834[/C][/ROW]
[ROW][C]8[/C][C]0.154447[/C][C]1.07[/C][C]0.144976[/C][/ROW]
[ROW][C]9[/C][C]-0.065486[/C][C]-0.4537[/C][C]0.326044[/C][/ROW]
[ROW][C]10[/C][C]-0.050413[/C][C]-0.3493[/C][C]0.364207[/C][/ROW]
[ROW][C]11[/C][C]-0.113967[/C][C]-0.7896[/C][C]0.216826[/C][/ROW]
[ROW][C]12[/C][C]-0.218622[/C][C]-1.5147[/C][C]0.068208[/C][/ROW]
[ROW][C]13[/C][C]0.13583[/C][C]0.9411[/C][C]0.175695[/C][/ROW]
[ROW][C]14[/C][C]-0.055915[/C][C]-0.3874[/C][C]0.35009[/C][/ROW]
[ROW][C]15[/C][C]-0.12001[/C][C]-0.8315[/C][C]0.204917[/C][/ROW]
[ROW][C]16[/C][C]0.075364[/C][C]0.5221[/C][C]0.301987[/C][/ROW]
[ROW][C]17[/C][C]-0.088648[/C][C]-0.6142[/C][C]0.271001[/C][/ROW]
[/TABLE]
Source: https://freestatistics.org/blog/index.php?pk=302535&T=1

Globally Unique Identifier (entire table): ba.freestatistics.org/blog/index.php?pk=302535&T=1

As an alternative you can also use a QR Code:  

The GUIDs for individual cells are displayed in the table below:

Autocorrelation Function
Time lag kACF(k)T-STATP-value
1-0.159012-1.10170.13805
20.024370.16880.433317
30.0195650.13560.446372
40.2691261.86460.034182
50.0284320.1970.422336
6-0.142749-0.9890.163813
7-0.147586-1.02250.155834
80.1544471.070.144976
9-0.065486-0.45370.326044
10-0.050413-0.34930.364207
11-0.113967-0.78960.216826
12-0.218622-1.51470.068208
130.135830.94110.175695
14-0.055915-0.38740.35009
15-0.12001-0.83150.204917
160.0753640.52210.301987
17-0.088648-0.61420.271001


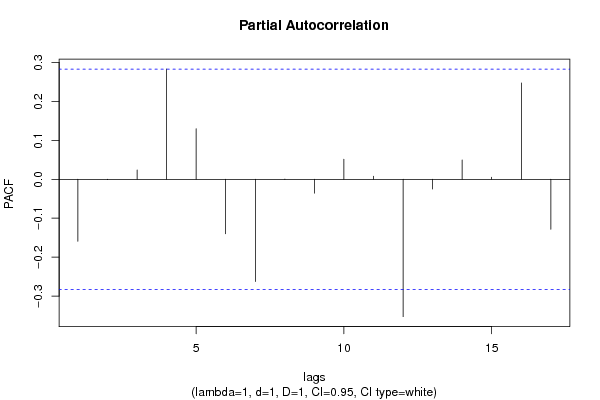
Partial Autocorrelation Function
Time lag kPACF(k)T-STATP-value
1-0.159012-1.10170.13805
2-0.000939-0.00650.497418
30.0238990.16560.434593
40.2832911.96270.027746
50.1299230.90010.186271
6-0.139909-0.96930.168622
7-0.262494-1.81860.037606
8-0.000536-0.00370.498526
9-0.035606-0.24670.403101
100.0516530.35790.361009
110.0079310.05490.478205
12-0.352688-2.44350.009137
13-0.025179-0.17440.431126
140.0493350.34180.366995
150.0053040.03670.485421
160.2473741.71390.046503
17-0.128488-0.89020.188901

\begin{tabular}{lllllllll}
\hline
Partial Autocorrelation Function \tabularnewline
Time lag k & PACF(k) & T-STAT & P-value \tabularnewline
1 & -0.159012 & -1.1017 & 0.13805 \tabularnewline
2 & -0.000939 & -0.0065 & 0.497418 \tabularnewline
3 & 0.023899 & 0.1656 & 0.434593 \tabularnewline
4 & 0.283291 & 1.9627 & 0.027746 \tabularnewline
5 & 0.129923 & 0.9001 & 0.186271 \tabularnewline
6 & -0.139909 & -0.9693 & 0.168622 \tabularnewline
7 & -0.262494 & -1.8186 & 0.037606 \tabularnewline
8 & -0.000536 & -0.0037 & 0.498526 \tabularnewline
9 & -0.035606 & -0.2467 & 0.403101 \tabularnewline
10 & 0.051653 & 0.3579 & 0.361009 \tabularnewline
11 & 0.007931 & 0.0549 & 0.478205 \tabularnewline
12 & -0.352688 & -2.4435 & 0.009137 \tabularnewline
13 & -0.025179 & -0.1744 & 0.431126 \tabularnewline
14 & 0.049335 & 0.3418 & 0.366995 \tabularnewline
15 & 0.005304 & 0.0367 & 0.485421 \tabularnewline
16 & 0.247374 & 1.7139 & 0.046503 \tabularnewline
17 & -0.128488 & -0.8902 & 0.188901 \tabularnewline
\hline
\end{tabular}
%Source: https://freestatistics.org/blog/index.php?pk=302535&T=2

[TABLE]
[ROW][C]Partial Autocorrelation Function[/C][/ROW]
[ROW][C]Time lag k[/C][C]PACF(k)[/C][C]T-STAT[/C][C]P-value[/C][/ROW]
[ROW][C]1[/C][C]-0.159012[/C][C]-1.1017[/C][C]0.13805[/C][/ROW]
[ROW][C]2[/C][C]-0.000939[/C][C]-0.0065[/C][C]0.497418[/C][/ROW]
[ROW][C]3[/C][C]0.023899[/C][C]0.1656[/C][C]0.434593[/C][/ROW]
[ROW][C]4[/C][C]0.283291[/C][C]1.9627[/C][C]0.027746[/C][/ROW]
[ROW][C]5[/C][C]0.129923[/C][C]0.9001[/C][C]0.186271[/C][/ROW]
[ROW][C]6[/C][C]-0.139909[/C][C]-0.9693[/C][C]0.168622[/C][/ROW]
[ROW][C]7[/C][C]-0.262494[/C][C]-1.8186[/C][C]0.037606[/C][/ROW]
[ROW][C]8[/C][C]-0.000536[/C][C]-0.0037[/C][C]0.498526[/C][/ROW]
[ROW][C]9[/C][C]-0.035606[/C][C]-0.2467[/C][C]0.403101[/C][/ROW]
[ROW][C]10[/C][C]0.051653[/C][C]0.3579[/C][C]0.361009[/C][/ROW]
[ROW][C]11[/C][C]0.007931[/C][C]0.0549[/C][C]0.478205[/C][/ROW]
[ROW][C]12[/C][C]-0.352688[/C][C]-2.4435[/C][C]0.009137[/C][/ROW]
[ROW][C]13[/C][C]-0.025179[/C][C]-0.1744[/C][C]0.431126[/C][/ROW]
[ROW][C]14[/C][C]0.049335[/C][C]0.3418[/C][C]0.366995[/C][/ROW]
[ROW][C]15[/C][C]0.005304[/C][C]0.0367[/C][C]0.485421[/C][/ROW]
[ROW][C]16[/C][C]0.247374[/C][C]1.7139[/C][C]0.046503[/C][/ROW]
[ROW][C]17[/C][C]-0.128488[/C][C]-0.8902[/C][C]0.188901[/C][/ROW]
[/TABLE]
Source: https://freestatistics.org/blog/index.php?pk=302535&T=2

Globally Unique Identifier (entire table): ba.freestatistics.org/blog/index.php?pk=302535&T=2

As an alternative you can also use a QR Code:  

The GUIDs for individual cells are displayed in the table below:

Partial Autocorrelation Function
Time lag kPACF(k)T-STATP-value
1-0.159012-1.10170.13805
2-0.000939-0.00650.497418
30.0238990.16560.434593
40.2832911.96270.027746
50.1299230.90010.186271
6-0.139909-0.96930.168622
7-0.262494-1.81860.037606
8-0.000536-0.00370.498526
9-0.035606-0.24670.403101
100.0516530.35790.361009
110.0079310.05490.478205
12-0.352688-2.44350.009137
13-0.025179-0.17440.431126
140.0493350.34180.366995
150.0053040.03670.485421
160.2473741.71390.046503
17-0.128488-0.89020.188901


Parameters (Session):
par1 = Default ; par2 = 1 ; par3 = 1 ; par4 = 1 ; par5 = 12 ; par6 = White Noise ; par7 = 0.95 ;
Parameters (R input):
par1 = Default ; par2 = 1 ; par3 = 1 ; par4 = 1 ; par5 = 12 ; par6 = White Noise ; par7 = 0.95 ; par8 = ;
R code (references can be found in the software module):
if (par1 == 'Default') {
par1 = 10*log10(length(x))
} else {
par1 <- as.numeric(par1)
}
par2 <- as.numeric(par2)
par3 <- as.numeric(par3)
par4 <- as.numeric(par4)
par5 <- as.numeric(par5)
if (par6 == 'White Noise') par6 <- 'white' else par6 <- 'ma'
par7 <- as.numeric(par7)
if (par8 != '') par8 <- as.numeric(par8)
x <- na.omit(x)
ox <- x
if (par8 == '') {
if (par2 == 0) {
x <- log(x)
} else {
x <- (x ^ par2 - 1) / par2
}
} else {
x <- log(x,base=par8)
}
if (par3 > 0) x <- diff(x,lag=1,difference=par3)
if (par4 > 0) x <- diff(x,lag=par5,difference=par4)
bitmap(file='picts.png')
op <- par(mfrow=c(2,1))
plot(ox,type='l',main='Original Time Series',xlab='time',ylab='value')
if (par8=='') {
mytitle <- paste('Working Time Series (lambda=',par2,', d=',par3,', D=',par4,')',sep='')
mysub <- paste('(lambda=',par2,', d=',par3,', D=',par4,', CI=', par7, ', CI type=',par6,')',sep='')
} else {
mytitle <- paste('Working Time Series (base=',par8,', d=',par3,', D=',par4,')',sep='')
mysub <- paste('(base=',par8,', d=',par3,', D=',par4,', CI=', par7, ', CI type=',par6,')',sep='')
}
plot(x,type='l', main=mytitle,xlab='time',ylab='value')
par(op)
dev.off()
bitmap(file='pic1.png')
racf <- acf(x, par1, main='Autocorrelation', xlab='time lag', ylab='ACF', ci.type=par6, ci=par7, sub=mysub)
dev.off()
bitmap(file='pic2.png')
rpacf <- pacf(x,par1,main='Partial Autocorrelation',xlab='lags',ylab='PACF',sub=mysub)
dev.off()
(myacf <- c(racf$acf))
(mypacf <- c(rpacf$acf))
lengthx <- length(x)
sqrtn <- sqrt(lengthx)
load(file='createtable')
a<-table.start()
a<-table.row.start(a)
a<-table.element(a,'Autocorrelation Function',4,TRUE)
a<-table.row.end(a)
a<-table.row.start(a)
a<-table.element(a,'Time lag k',header=TRUE)
a<-table.element(a,'ACF(k)',header=TRUE)
a<-table.element(a,'T-STAT',header=TRUE)
a<-table.element(a,'P-value',header=TRUE)
a<-table.row.end(a)
for (i in 2:(par1+1)) {
a<-table.row.start(a)
a<-table.element(a,i-1,header=TRUE)
a<-table.element(a,round(myacf[i],6))
mytstat <- myacf[i]*sqrtn
a<-table.element(a,round(mytstat,4))
a<-table.element(a,round(1-pt(abs(mytstat),lengthx),6))
a<-table.row.end(a)
}
a<-table.end(a)
table.save(a,file='mytable.tab')
a<-table.start()
a<-table.row.start(a)
a<-table.element(a,'Partial Autocorrelation Function',4,TRUE)
a<-table.row.end(a)
a<-table.row.start(a)
a<-table.element(a,'Time lag k',header=TRUE)
a<-table.element(a,'PACF(k)',header=TRUE)
a<-table.element(a,'T-STAT',header=TRUE)
a<-table.element(a,'P-value',header=TRUE)
a<-table.row.end(a)
for (i in 1:par1) {
a<-table.row.start(a)
a<-table.element(a,i,header=TRUE)
a<-table.element(a,round(mypacf[i],6))
mytstat <- mypacf[i]*sqrtn
a<-table.element(a,round(mytstat,4))
a<-table.element(a,round(1-pt(abs(mytstat),lengthx),6))
a<-table.row.end(a)
}
a<-table.end(a)
table.save(a,file='mytable1.tab')