Free Statistics

of Irreproducible Research!

Author's title

Author*The author of this computation has been verified*
R Software Modulerwasp_arimabackwardselection.wasp
Title produced by softwareARIMA Backward Selection
Date of computationThu, 22 Dec 2016 17:44:18 +0100
Cite this page as followsStatistical Computations at FreeStatistics.org, Office for Research Development and Education, URL https://freestatistics.org/blog/index.php?v=date/2016/Dec/22/t1482425678267uklqqgd2bly1.htm/, Retrieved Sun, 28 Apr 2024 18:58:53 +0000
Statistical Computations at FreeStatistics.org, Office for Research Development and Education, URL https://freestatistics.org/blog/index.php?pk=302570, Retrieved Sun, 28 Apr 2024 18:58:53 +0000
QR Codes:

Original text written by user:
IsPrivate?No (this computation is public)
User-defined keywords
Estimated Impact83
Family? (F = Feedback message, R = changed R code, M = changed R Module, P = changed Parameters, D = changed Data)
-       [ARIMA Backward Selection] [ARIMA N2322] [2016-12-22 16:44:18] [6f830dc7e8de22be3233942ffbe3aaba] [Current]
Feedback Forum

Post a new message
Dataseries X:
4526.1
4616.8
4558
4736.8
4771.1
4611.3
4687.1
4718.3
4731.6
4755.4
4849.8
4697.8
4720.2
4741.1
4794.2
4807.4
4836.9
4853
4902.9
4938
4910.4
4954.6
4937.3
5003.8
5005.6
4984.4
5050
5017.7
4984.8
5036.3
5093.6
5111.2
5090.7
5063.7
5007.5
5122.5
5172.3
5232.8
5183.3
5204.6
5255.4
5294.5
5308.9
5281.3
5413.9
5462.4
5568.7
5579.1
5590.3
5703.2
5717.7
5772.3
5876.6
6134.6
6155.6
6259.5
6180.7
6120.3
6097
6167.5
6207.1
6181.7
6196.2
6183.9
6184
6271.1
6204.9
6284.5
6293.9
6377.9
6400.2
6456.2
6372.8
6368.8
6497.8
6599.4
6696.9
6676.3
6731.7
6732.3
6760.2
6841.4
6917.5
6899.3
6972.9
6969.2
6941.6
6905.5
6971.3
6968.4
7012.2
7049.5
7095.6
7237.5
7230.5
7253.5
7289.4
7364.6
7428.1
7390.2
7279.9
7426.5
7480.1


Summary of computational transaction
Raw Input view raw input (R code)
Raw Outputview raw output of R engine
Computing time4 seconds
R ServerBig Analytics Cloud Computing Center

\begin{tabular}{lllllllll}
\hline
Summary of computational transaction \tabularnewline
Raw Input view raw input (R code)  \tabularnewline
Raw Outputview raw output of R engine  \tabularnewline
Computing time4 seconds \tabularnewline
R ServerBig Analytics Cloud Computing Center \tabularnewline
\hline
\end{tabular}
%Source: https://freestatistics.org/blog/index.php?pk=302570&T=0

[TABLE]
[ROW]
Summary of computational transaction[/C][/ROW] [ROW]Raw Input[/C] view raw input (R code) [/C][/ROW] [ROW]Raw Output[/C]view raw output of R engine [/C][/ROW] [ROW]Computing time[/C]4 seconds[/C][/ROW] [ROW]R Server[/C]Big Analytics Cloud Computing Center[/C][/ROW] [/TABLE] Source: https://freestatistics.org/blog/index.php?pk=302570&T=0

Globally Unique Identifier (entire table): ba.freestatistics.org/blog/index.php?pk=302570&T=0

As an alternative you can also use a QR Code:  

The GUIDs for individual cells are displayed in the table below:

Summary of computational transaction
Raw Input view raw input (R code)
Raw Outputview raw output of R engine
Computing time4 seconds
R ServerBig Analytics Cloud Computing Center


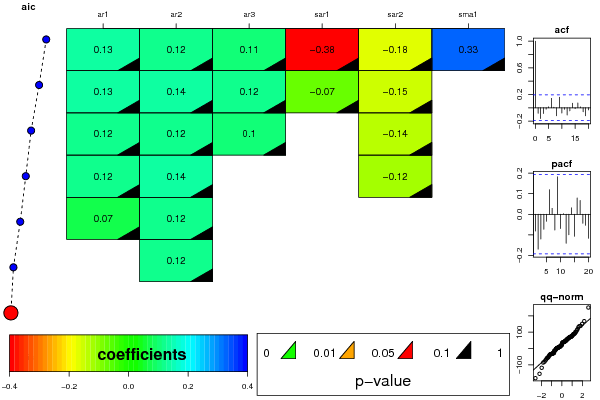
ARIMA Parameter Estimation and Backward Selection
Iterationar1ar2ar3sar1sar2sma1
Estimates ( 1 )0.13150.1240.111-0.3842-0.17570.3306
(p-val)(0.2388 )(0.2455 )(0.33 )(0.3705 )(0.1847 )(0.4412 )
Estimates ( 2 )0.12850.13750.1183-0.0672-0.15480
(p-val)(0.2521 )(0.1968 )(0.3026 )(0.6267 )(0.2417 )(NA )
Estimates ( 3 )0.11510.12370.09660-0.13750
(p-val)(0.2989 )(0.2308 )(0.3681 )(NA )(0.2905 )(NA )
Estimates ( 4 )0.11840.137800-0.11860
(p-val)(0.2958 )(0.183 )(NA )(NA )(0.3775 )(NA )
Estimates ( 5 )0.06930.11640000
(p-val)(0.4846 )(0.2517 )(NA )(NA )(NA )(NA )
Estimates ( 6 )00.12180000
(p-val)(NA )(0.2305 )(NA )(NA )(NA )(NA )
Estimates ( 7 )000000
(p-val)(NA )(NA )(NA )(NA )(NA )(NA )
Estimates ( 8 )NANANANANANA
(p-val)(NA )(NA )(NA )(NA )(NA )(NA )
Estimates ( 9 )NANANANANANA
(p-val)(NA )(NA )(NA )(NA )(NA )(NA )
Estimates ( 10 )NANANANANANA
(p-val)(NA )(NA )(NA )(NA )(NA )(NA )
Estimates ( 11 )NANANANANANA
(p-val)(NA )(NA )(NA )(NA )(NA )(NA )

\begin{tabular}{lllllllll}
\hline
ARIMA Parameter Estimation and Backward Selection \tabularnewline
Iteration & ar1 & ar2 & ar3 & sar1 & sar2 & sma1 \tabularnewline
Estimates ( 1 ) & 0.1315 & 0.124 & 0.111 & -0.3842 & -0.1757 & 0.3306 \tabularnewline
(p-val) & (0.2388 ) & (0.2455 ) & (0.33 ) & (0.3705 ) & (0.1847 ) & (0.4412 ) \tabularnewline
Estimates ( 2 ) & 0.1285 & 0.1375 & 0.1183 & -0.0672 & -0.1548 & 0 \tabularnewline
(p-val) & (0.2521 ) & (0.1968 ) & (0.3026 ) & (0.6267 ) & (0.2417 ) & (NA ) \tabularnewline
Estimates ( 3 ) & 0.1151 & 0.1237 & 0.0966 & 0 & -0.1375 & 0 \tabularnewline
(p-val) & (0.2989 ) & (0.2308 ) & (0.3681 ) & (NA ) & (0.2905 ) & (NA ) \tabularnewline
Estimates ( 4 ) & 0.1184 & 0.1378 & 0 & 0 & -0.1186 & 0 \tabularnewline
(p-val) & (0.2958 ) & (0.183 ) & (NA ) & (NA ) & (0.3775 ) & (NA ) \tabularnewline
Estimates ( 5 ) & 0.0693 & 0.1164 & 0 & 0 & 0 & 0 \tabularnewline
(p-val) & (0.4846 ) & (0.2517 ) & (NA ) & (NA ) & (NA ) & (NA ) \tabularnewline
Estimates ( 6 ) & 0 & 0.1218 & 0 & 0 & 0 & 0 \tabularnewline
(p-val) & (NA ) & (0.2305 ) & (NA ) & (NA ) & (NA ) & (NA ) \tabularnewline
Estimates ( 7 ) & 0 & 0 & 0 & 0 & 0 & 0 \tabularnewline
(p-val) & (NA ) & (NA ) & (NA ) & (NA ) & (NA ) & (NA ) \tabularnewline
Estimates ( 8 ) & NA & NA & NA & NA & NA & NA \tabularnewline
(p-val) & (NA ) & (NA ) & (NA ) & (NA ) & (NA ) & (NA ) \tabularnewline
Estimates ( 9 ) & NA & NA & NA & NA & NA & NA \tabularnewline
(p-val) & (NA ) & (NA ) & (NA ) & (NA ) & (NA ) & (NA ) \tabularnewline
Estimates ( 10 ) & NA & NA & NA & NA & NA & NA \tabularnewline
(p-val) & (NA ) & (NA ) & (NA ) & (NA ) & (NA ) & (NA ) \tabularnewline
Estimates ( 11 ) & NA & NA & NA & NA & NA & NA \tabularnewline
(p-val) & (NA ) & (NA ) & (NA ) & (NA ) & (NA ) & (NA ) \tabularnewline
\hline
\end{tabular}
%Source: https://freestatistics.org/blog/index.php?pk=302570&T=1

[TABLE]
[ROW][C]ARIMA Parameter Estimation and Backward Selection[/C][/ROW]
[ROW][C]Iteration[/C][C]ar1[/C][C]ar2[/C][C]ar3[/C][C]sar1[/C][C]sar2[/C][C]sma1[/C][/ROW]
[ROW][C]Estimates ( 1 )[/C][C]0.1315[/C][C]0.124[/C][C]0.111[/C][C]-0.3842[/C][C]-0.1757[/C][C]0.3306[/C][/ROW]
[ROW][C](p-val)[/C][C](0.2388 )[/C][C](0.2455 )[/C][C](0.33 )[/C][C](0.3705 )[/C][C](0.1847 )[/C][C](0.4412 )[/C][/ROW]
[ROW][C]Estimates ( 2 )[/C][C]0.1285[/C][C]0.1375[/C][C]0.1183[/C][C]-0.0672[/C][C]-0.1548[/C][C]0[/C][/ROW]
[ROW][C](p-val)[/C][C](0.2521 )[/C][C](0.1968 )[/C][C](0.3026 )[/C][C](0.6267 )[/C][C](0.2417 )[/C][C](NA )[/C][/ROW]
[ROW][C]Estimates ( 3 )[/C][C]0.1151[/C][C]0.1237[/C][C]0.0966[/C][C]0[/C][C]-0.1375[/C][C]0[/C][/ROW]
[ROW][C](p-val)[/C][C](0.2989 )[/C][C](0.2308 )[/C][C](0.3681 )[/C][C](NA )[/C][C](0.2905 )[/C][C](NA )[/C][/ROW]
[ROW][C]Estimates ( 4 )[/C][C]0.1184[/C][C]0.1378[/C][C]0[/C][C]0[/C][C]-0.1186[/C][C]0[/C][/ROW]
[ROW][C](p-val)[/C][C](0.2958 )[/C][C](0.183 )[/C][C](NA )[/C][C](NA )[/C][C](0.3775 )[/C][C](NA )[/C][/ROW]
[ROW][C]Estimates ( 5 )[/C][C]0.0693[/C][C]0.1164[/C][C]0[/C][C]0[/C][C]0[/C][C]0[/C][/ROW]
[ROW][C](p-val)[/C][C](0.4846 )[/C][C](0.2517 )[/C][C](NA )[/C][C](NA )[/C][C](NA )[/C][C](NA )[/C][/ROW]
[ROW][C]Estimates ( 6 )[/C][C]0[/C][C]0.1218[/C][C]0[/C][C]0[/C][C]0[/C][C]0[/C][/ROW]
[ROW][C](p-val)[/C][C](NA )[/C][C](0.2305 )[/C][C](NA )[/C][C](NA )[/C][C](NA )[/C][C](NA )[/C][/ROW]
[ROW][C]Estimates ( 7 )[/C][C]0[/C][C]0[/C][C]0[/C][C]0[/C][C]0[/C][C]0[/C][/ROW]
[ROW][C](p-val)[/C][C](NA )[/C][C](NA )[/C][C](NA )[/C][C](NA )[/C][C](NA )[/C][C](NA )[/C][/ROW]
[ROW][C]Estimates ( 8 )[/C][C]NA[/C][C]NA[/C][C]NA[/C][C]NA[/C][C]NA[/C][C]NA[/C][/ROW]
[ROW][C](p-val)[/C][C](NA )[/C][C](NA )[/C][C](NA )[/C][C](NA )[/C][C](NA )[/C][C](NA )[/C][/ROW]
[ROW][C]Estimates ( 9 )[/C][C]NA[/C][C]NA[/C][C]NA[/C][C]NA[/C][C]NA[/C][C]NA[/C][/ROW]
[ROW][C](p-val)[/C][C](NA )[/C][C](NA )[/C][C](NA )[/C][C](NA )[/C][C](NA )[/C][C](NA )[/C][/ROW]
[ROW][C]Estimates ( 10 )[/C][C]NA[/C][C]NA[/C][C]NA[/C][C]NA[/C][C]NA[/C][C]NA[/C][/ROW]
[ROW][C](p-val)[/C][C](NA )[/C][C](NA )[/C][C](NA )[/C][C](NA )[/C][C](NA )[/C][C](NA )[/C][/ROW]
[ROW][C]Estimates ( 11 )[/C][C]NA[/C][C]NA[/C][C]NA[/C][C]NA[/C][C]NA[/C][C]NA[/C][/ROW]
[ROW][C](p-val)[/C][C](NA )[/C][C](NA )[/C][C](NA )[/C][C](NA )[/C][C](NA )[/C][C](NA )[/C][/ROW]
[/TABLE]
Source: https://freestatistics.org/blog/index.php?pk=302570&T=1

Globally Unique Identifier (entire table): ba.freestatistics.org/blog/index.php?pk=302570&T=1

As an alternative you can also use a QR Code:  

The GUIDs for individual cells are displayed in the table below:

ARIMA Parameter Estimation and Backward Selection
Iterationar1ar2ar3sar1sar2sma1
Estimates ( 1 )0.13150.1240.111-0.3842-0.17570.3306
(p-val)(0.2388 )(0.2455 )(0.33 )(0.3705 )(0.1847 )(0.4412 )
Estimates ( 2 )0.12850.13750.1183-0.0672-0.15480
(p-val)(0.2521 )(0.1968 )(0.3026 )(0.6267 )(0.2417 )(NA )
Estimates ( 3 )0.11510.12370.09660-0.13750
(p-val)(0.2989 )(0.2308 )(0.3681 )(NA )(0.2905 )(NA )
Estimates ( 4 )0.11840.137800-0.11860
(p-val)(0.2958 )(0.183 )(NA )(NA )(0.3775 )(NA )
Estimates ( 5 )0.06930.11640000
(p-val)(0.4846 )(0.2517 )(NA )(NA )(NA )(NA )
Estimates ( 6 )00.12180000
(p-val)(NA )(0.2305 )(NA )(NA )(NA )(NA )
Estimates ( 7 )000000
(p-val)(NA )(NA )(NA )(NA )(NA )(NA )
Estimates ( 8 )NANANANANANA
(p-val)(NA )(NA )(NA )(NA )(NA )(NA )
Estimates ( 9 )NANANANANANA
(p-val)(NA )(NA )(NA )(NA )(NA )(NA )
Estimates ( 10 )NANANANANANA
(p-val)(NA )(NA )(NA )(NA )(NA )(NA )
Estimates ( 11 )NANANANANANA
(p-val)(NA )(NA )(NA )(NA )(NA )(NA )


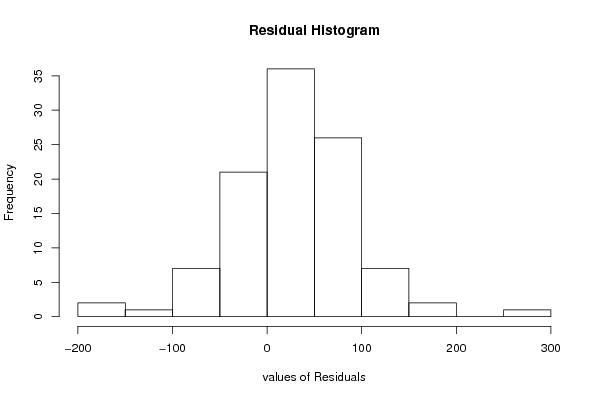
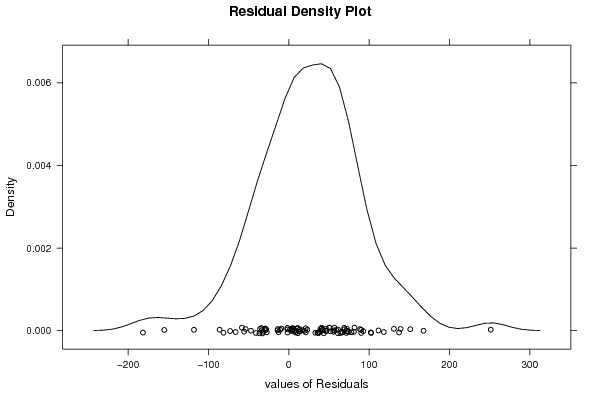
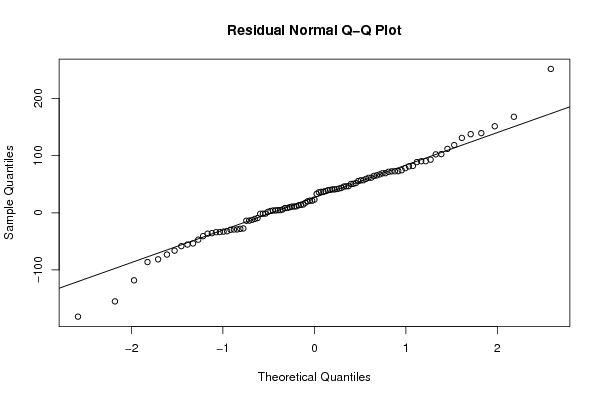
Estimated ARIMA Residuals
Value
4.5260977028923
90.0250802424305
-58.363011247074
167.755774033309
41.4598730634089
-181.571858907099
71.6234073796786
50.6582944818483
4.07009560873576
20.0008836806401
92.7805049023246
-154.898043858999
10.9052378029628
39.4085154020086
50.3724293091773
10.6550791322234
23.0341962641669
14.4926815571944
46.3078868134253
33.139558565972
-33.676150780002
39.9259941407208
-13.9392432559516
61.1179185475739
3.90656129246599
-29.297475488379
65.3808202123446
-29.7185491676146
-40.8878855945504
55.4330595229267
61.3061194521451
11.3290227420821
-27.477223240362
-29.143091257075
-53.7037857517025
118.28769681483
56.6432800367957
46.4968468997968
-55.5639741251316
13.9331238038058
56.8274441605217
36.5063725127457
8.21425932617058
-32.3610720540692
130.846561698757
51.8607567440486
90.153755642722
4.49432238817553
-1.74378412653641
111.633627893546
13.1362146545889
40.8525566520611
102.534385043888
251.351546441121
8.29974897085867
72.4842304360645
-81.3570975226457
-73.0515444096618
-13.7047959626434
77.8546995413244
42.43716058465
-33.9845416831686
9.67804467158203
-9.20712966308565
-1.66561495611222
88.5977285489789
-66.2121766548707
68.9941336084548
17.4609455237687
74.3073827236849
21.1553944422449
45.7716099094168
-86.1153940359518
-10.8189267270554
139.155330161365
102.087066194789
81.7921152180324
-32.9714813476576
43.5277615020013
3.10839090316676
21.1541332021625
81.1269400707815
72.7027132913427
-28.0874437542307
64.3335656441259
-1.48384881370657
-36.5620179841299
-35.6494637698197
69.1607567440487
1.4957724079768
35.7877610957094
37.6531229912225
40.7666251670535
137.358107733586
-12.6134378949509
5.7213267398356
36.7523658408818
72.3993693799603
59.1285809017627
-47.0568444620467
-118.032175842287
151.214952195633
67.0308503213264

\begin{tabular}{lllllllll}
\hline
Estimated ARIMA Residuals \tabularnewline
Value \tabularnewline
4.5260977028923 \tabularnewline
90.0250802424305 \tabularnewline
-58.363011247074 \tabularnewline
167.755774033309 \tabularnewline
41.4598730634089 \tabularnewline
-181.571858907099 \tabularnewline
71.6234073796786 \tabularnewline
50.6582944818483 \tabularnewline
4.07009560873576 \tabularnewline
20.0008836806401 \tabularnewline
92.7805049023246 \tabularnewline
-154.898043858999 \tabularnewline
10.9052378029628 \tabularnewline
39.4085154020086 \tabularnewline
50.3724293091773 \tabularnewline
10.6550791322234 \tabularnewline
23.0341962641669 \tabularnewline
14.4926815571944 \tabularnewline
46.3078868134253 \tabularnewline
33.139558565972 \tabularnewline
-33.676150780002 \tabularnewline
39.9259941407208 \tabularnewline
-13.9392432559516 \tabularnewline
61.1179185475739 \tabularnewline
3.90656129246599 \tabularnewline
-29.297475488379 \tabularnewline
65.3808202123446 \tabularnewline
-29.7185491676146 \tabularnewline
-40.8878855945504 \tabularnewline
55.4330595229267 \tabularnewline
61.3061194521451 \tabularnewline
11.3290227420821 \tabularnewline
-27.477223240362 \tabularnewline
-29.143091257075 \tabularnewline
-53.7037857517025 \tabularnewline
118.28769681483 \tabularnewline
56.6432800367957 \tabularnewline
46.4968468997968 \tabularnewline
-55.5639741251316 \tabularnewline
13.9331238038058 \tabularnewline
56.8274441605217 \tabularnewline
36.5063725127457 \tabularnewline
8.21425932617058 \tabularnewline
-32.3610720540692 \tabularnewline
130.846561698757 \tabularnewline
51.8607567440486 \tabularnewline
90.153755642722 \tabularnewline
4.49432238817553 \tabularnewline
-1.74378412653641 \tabularnewline
111.633627893546 \tabularnewline
13.1362146545889 \tabularnewline
40.8525566520611 \tabularnewline
102.534385043888 \tabularnewline
251.351546441121 \tabularnewline
8.29974897085867 \tabularnewline
72.4842304360645 \tabularnewline
-81.3570975226457 \tabularnewline
-73.0515444096618 \tabularnewline
-13.7047959626434 \tabularnewline
77.8546995413244 \tabularnewline
42.43716058465 \tabularnewline
-33.9845416831686 \tabularnewline
9.67804467158203 \tabularnewline
-9.20712966308565 \tabularnewline
-1.66561495611222 \tabularnewline
88.5977285489789 \tabularnewline
-66.2121766548707 \tabularnewline
68.9941336084548 \tabularnewline
17.4609455237687 \tabularnewline
74.3073827236849 \tabularnewline
21.1553944422449 \tabularnewline
45.7716099094168 \tabularnewline
-86.1153940359518 \tabularnewline
-10.8189267270554 \tabularnewline
139.155330161365 \tabularnewline
102.087066194789 \tabularnewline
81.7921152180324 \tabularnewline
-32.9714813476576 \tabularnewline
43.5277615020013 \tabularnewline
3.10839090316676 \tabularnewline
21.1541332021625 \tabularnewline
81.1269400707815 \tabularnewline
72.7027132913427 \tabularnewline
-28.0874437542307 \tabularnewline
64.3335656441259 \tabularnewline
-1.48384881370657 \tabularnewline
-36.5620179841299 \tabularnewline
-35.6494637698197 \tabularnewline
69.1607567440487 \tabularnewline
1.4957724079768 \tabularnewline
35.7877610957094 \tabularnewline
37.6531229912225 \tabularnewline
40.7666251670535 \tabularnewline
137.358107733586 \tabularnewline
-12.6134378949509 \tabularnewline
5.7213267398356 \tabularnewline
36.7523658408818 \tabularnewline
72.3993693799603 \tabularnewline
59.1285809017627 \tabularnewline
-47.0568444620467 \tabularnewline
-118.032175842287 \tabularnewline
151.214952195633 \tabularnewline
67.0308503213264 \tabularnewline
\hline
\end{tabular}
%Source: https://freestatistics.org/blog/index.php?pk=302570&T=2

[TABLE]
[ROW][C]Estimated ARIMA Residuals[/C][/ROW]
[ROW][C]Value[/C][/ROW]
[ROW][C]4.5260977028923[/C][/ROW]
[ROW][C]90.0250802424305[/C][/ROW]
[ROW][C]-58.363011247074[/C][/ROW]
[ROW][C]167.755774033309[/C][/ROW]
[ROW][C]41.4598730634089[/C][/ROW]
[ROW][C]-181.571858907099[/C][/ROW]
[ROW][C]71.6234073796786[/C][/ROW]
[ROW][C]50.6582944818483[/C][/ROW]
[ROW][C]4.07009560873576[/C][/ROW]
[ROW][C]20.0008836806401[/C][/ROW]
[ROW][C]92.7805049023246[/C][/ROW]
[ROW][C]-154.898043858999[/C][/ROW]
[ROW][C]10.9052378029628[/C][/ROW]
[ROW][C]39.4085154020086[/C][/ROW]
[ROW][C]50.3724293091773[/C][/ROW]
[ROW][C]10.6550791322234[/C][/ROW]
[ROW][C]23.0341962641669[/C][/ROW]
[ROW][C]14.4926815571944[/C][/ROW]
[ROW][C]46.3078868134253[/C][/ROW]
[ROW][C]33.139558565972[/C][/ROW]
[ROW][C]-33.676150780002[/C][/ROW]
[ROW][C]39.9259941407208[/C][/ROW]
[ROW][C]-13.9392432559516[/C][/ROW]
[ROW][C]61.1179185475739[/C][/ROW]
[ROW][C]3.90656129246599[/C][/ROW]
[ROW][C]-29.297475488379[/C][/ROW]
[ROW][C]65.3808202123446[/C][/ROW]
[ROW][C]-29.7185491676146[/C][/ROW]
[ROW][C]-40.8878855945504[/C][/ROW]
[ROW][C]55.4330595229267[/C][/ROW]
[ROW][C]61.3061194521451[/C][/ROW]
[ROW][C]11.3290227420821[/C][/ROW]
[ROW][C]-27.477223240362[/C][/ROW]
[ROW][C]-29.143091257075[/C][/ROW]
[ROW][C]-53.7037857517025[/C][/ROW]
[ROW][C]118.28769681483[/C][/ROW]
[ROW][C]56.6432800367957[/C][/ROW]
[ROW][C]46.4968468997968[/C][/ROW]
[ROW][C]-55.5639741251316[/C][/ROW]
[ROW][C]13.9331238038058[/C][/ROW]
[ROW][C]56.8274441605217[/C][/ROW]
[ROW][C]36.5063725127457[/C][/ROW]
[ROW][C]8.21425932617058[/C][/ROW]
[ROW][C]-32.3610720540692[/C][/ROW]
[ROW][C]130.846561698757[/C][/ROW]
[ROW][C]51.8607567440486[/C][/ROW]
[ROW][C]90.153755642722[/C][/ROW]
[ROW][C]4.49432238817553[/C][/ROW]
[ROW][C]-1.74378412653641[/C][/ROW]
[ROW][C]111.633627893546[/C][/ROW]
[ROW][C]13.1362146545889[/C][/ROW]
[ROW][C]40.8525566520611[/C][/ROW]
[ROW][C]102.534385043888[/C][/ROW]
[ROW][C]251.351546441121[/C][/ROW]
[ROW][C]8.29974897085867[/C][/ROW]
[ROW][C]72.4842304360645[/C][/ROW]
[ROW][C]-81.3570975226457[/C][/ROW]
[ROW][C]-73.0515444096618[/C][/ROW]
[ROW][C]-13.7047959626434[/C][/ROW]
[ROW][C]77.8546995413244[/C][/ROW]
[ROW][C]42.43716058465[/C][/ROW]
[ROW][C]-33.9845416831686[/C][/ROW]
[ROW][C]9.67804467158203[/C][/ROW]
[ROW][C]-9.20712966308565[/C][/ROW]
[ROW][C]-1.66561495611222[/C][/ROW]
[ROW][C]88.5977285489789[/C][/ROW]
[ROW][C]-66.2121766548707[/C][/ROW]
[ROW][C]68.9941336084548[/C][/ROW]
[ROW][C]17.4609455237687[/C][/ROW]
[ROW][C]74.3073827236849[/C][/ROW]
[ROW][C]21.1553944422449[/C][/ROW]
[ROW][C]45.7716099094168[/C][/ROW]
[ROW][C]-86.1153940359518[/C][/ROW]
[ROW][C]-10.8189267270554[/C][/ROW]
[ROW][C]139.155330161365[/C][/ROW]
[ROW][C]102.087066194789[/C][/ROW]
[ROW][C]81.7921152180324[/C][/ROW]
[ROW][C]-32.9714813476576[/C][/ROW]
[ROW][C]43.5277615020013[/C][/ROW]
[ROW][C]3.10839090316676[/C][/ROW]
[ROW][C]21.1541332021625[/C][/ROW]
[ROW][C]81.1269400707815[/C][/ROW]
[ROW][C]72.7027132913427[/C][/ROW]
[ROW][C]-28.0874437542307[/C][/ROW]
[ROW][C]64.3335656441259[/C][/ROW]
[ROW][C]-1.48384881370657[/C][/ROW]
[ROW][C]-36.5620179841299[/C][/ROW]
[ROW][C]-35.6494637698197[/C][/ROW]
[ROW][C]69.1607567440487[/C][/ROW]
[ROW][C]1.4957724079768[/C][/ROW]
[ROW][C]35.7877610957094[/C][/ROW]
[ROW][C]37.6531229912225[/C][/ROW]
[ROW][C]40.7666251670535[/C][/ROW]
[ROW][C]137.358107733586[/C][/ROW]
[ROW][C]-12.6134378949509[/C][/ROW]
[ROW][C]5.7213267398356[/C][/ROW]
[ROW][C]36.7523658408818[/C][/ROW]
[ROW][C]72.3993693799603[/C][/ROW]
[ROW][C]59.1285809017627[/C][/ROW]
[ROW][C]-47.0568444620467[/C][/ROW]
[ROW][C]-118.032175842287[/C][/ROW]
[ROW][C]151.214952195633[/C][/ROW]
[ROW][C]67.0308503213264[/C][/ROW]
[/TABLE]
Source: https://freestatistics.org/blog/index.php?pk=302570&T=2

Globally Unique Identifier (entire table): ba.freestatistics.org/blog/index.php?pk=302570&T=2

As an alternative you can also use a QR Code:  

The GUIDs for individual cells are displayed in the table below:

Estimated ARIMA Residuals
Value
4.5260977028923
90.0250802424305
-58.363011247074
167.755774033309
41.4598730634089
-181.571858907099
71.6234073796786
50.6582944818483
4.07009560873576
20.0008836806401
92.7805049023246
-154.898043858999
10.9052378029628
39.4085154020086
50.3724293091773
10.6550791322234
23.0341962641669
14.4926815571944
46.3078868134253
33.139558565972
-33.676150780002
39.9259941407208
-13.9392432559516
61.1179185475739
3.90656129246599
-29.297475488379
65.3808202123446
-29.7185491676146
-40.8878855945504
55.4330595229267
61.3061194521451
11.3290227420821
-27.477223240362
-29.143091257075
-53.7037857517025
118.28769681483
56.6432800367957
46.4968468997968
-55.5639741251316
13.9331238038058
56.8274441605217
36.5063725127457
8.21425932617058
-32.3610720540692
130.846561698757
51.8607567440486
90.153755642722
4.49432238817553
-1.74378412653641
111.633627893546
13.1362146545889
40.8525566520611
102.534385043888
251.351546441121
8.29974897085867
72.4842304360645
-81.3570975226457
-73.0515444096618
-13.7047959626434
77.8546995413244
42.43716058465
-33.9845416831686
9.67804467158203
-9.20712966308565
-1.66561495611222
88.5977285489789
-66.2121766548707
68.9941336084548
17.4609455237687
74.3073827236849
21.1553944422449
45.7716099094168
-86.1153940359518
-10.8189267270554
139.155330161365
102.087066194789
81.7921152180324
-32.9714813476576
43.5277615020013
3.10839090316676
21.1541332021625
81.1269400707815
72.7027132913427
-28.0874437542307
64.3335656441259
-1.48384881370657
-36.5620179841299
-35.6494637698197
69.1607567440487
1.4957724079768
35.7877610957094
37.6531229912225
40.7666251670535
137.358107733586
-12.6134378949509
5.7213267398356
36.7523658408818
72.3993693799603
59.1285809017627
-47.0568444620467
-118.032175842287
151.214952195633
67.0308503213264


Parameters (Session):
par1 = 1 ; par2 = 2 ; par3 = Exact Pearson Chi-Squared by Simulation ;
Parameters (R input):
par1 = FALSE ; par2 = 1 ; par3 = 1 ; par4 = 0 ; par5 = 12 ; par6 = 3 ; par7 = 0 ; par8 = 2 ; par9 = 1 ;
R code (references can be found in the software module):
library(lattice)
if (par1 == 'TRUE') par1 <- TRUE
if (par1 == 'FALSE') par1 <- FALSE
par2 <- as.numeric(par2) #Box-Cox lambda transformation parameter
par3 <- as.numeric(par3) #degree of non-seasonal differencing
par4 <- as.numeric(par4) #degree of seasonal differencing
par5 <- as.numeric(par5) #seasonal period
par6 <- as.numeric(par6) #degree (p) of the non-seasonal AR(p) polynomial
par7 <- as.numeric(par7) #degree (q) of the non-seasonal MA(q) polynomial
par8 <- as.numeric(par8) #degree (P) of the seasonal AR(P) polynomial
par9 <- as.numeric(par9) #degree (Q) of the seasonal MA(Q) polynomial
armaGR <- function(arima.out, names, n){
try1 <- arima.out$coef
try2 <- sqrt(diag(arima.out$var.coef))
try.data.frame <- data.frame(matrix(NA,ncol=4,nrow=length(names)))
dimnames(try.data.frame) <- list(names,c('coef','std','tstat','pv'))
try.data.frame[,1] <- try1
for(i in 1:length(try2)) try.data.frame[which(rownames(try.data.frame)==names(try2)[i]),2] <- try2[i]
try.data.frame[,3] <- try.data.frame[,1] / try.data.frame[,2]
try.data.frame[,4] <- round((1-pt(abs(try.data.frame[,3]),df=n-(length(try2)+1)))*2,5)
vector <- rep(NA,length(names))
vector[is.na(try.data.frame[,4])] <- 0
maxi <- which.max(try.data.frame[,4])
continue <- max(try.data.frame[,4],na.rm=TRUE) > .05
vector[maxi] <- 0
list(summary=try.data.frame,next.vector=vector,continue=continue)
}
arimaSelect <- function(series, order=c(13,0,0), seasonal=list(order=c(2,0,0),period=12), include.mean=F){
nrc <- order[1]+order[3]+seasonal$order[1]+seasonal$order[3]
coeff <- matrix(NA, nrow=nrc*2, ncol=nrc)
pval <- matrix(NA, nrow=nrc*2, ncol=nrc)
mylist <- rep(list(NULL), nrc)
names <- NULL
if(order[1] > 0) names <- paste('ar',1:order[1],sep='')
if(order[3] > 0) names <- c( names , paste('ma',1:order[3],sep='') )
if(seasonal$order[1] > 0) names <- c(names, paste('sar',1:seasonal$order[1],sep=''))
if(seasonal$order[3] > 0) names <- c(names, paste('sma',1:seasonal$order[3],sep=''))
arima.out <- arima(series, order=order, seasonal=seasonal, include.mean=include.mean, method='ML')
mylist[[1]] <- arima.out
last.arma <- armaGR(arima.out, names, length(series))
mystop <- FALSE
i <- 1
coeff[i,] <- last.arma[[1]][,1]
pval [i,] <- last.arma[[1]][,4]
i <- 2
aic <- arima.out$aic
while(!mystop){
mylist[[i]] <- arima.out
arima.out <- arima(series, order=order, seasonal=seasonal, include.mean=include.mean, method='ML', fixed=last.arma$next.vector)
aic <- c(aic, arima.out$aic)
last.arma <- armaGR(arima.out, names, length(series))
mystop <- !last.arma$continue
coeff[i,] <- last.arma[[1]][,1]
pval [i,] <- last.arma[[1]][,4]
i <- i+1
}
list(coeff, pval, mylist, aic=aic)
}
arimaSelectplot <- function(arimaSelect.out,noms,choix){
noms <- names(arimaSelect.out[[3]][[1]]$coef)
coeff <- arimaSelect.out[[1]]
k <- min(which(is.na(coeff[,1])))-1
coeff <- coeff[1:k,]
pval <- arimaSelect.out[[2]][1:k,]
aic <- arimaSelect.out$aic[1:k]
coeff[coeff==0] <- NA
n <- ncol(coeff)
if(missing(choix)) choix <- k
layout(matrix(c(1,1,1,2,
3,3,3,2,
3,3,3,4,
5,6,7,7),nr=4),
widths=c(10,35,45,15),
heights=c(30,30,15,15))
couleurs <- rainbow(75)[1:50]#(50)
ticks <- pretty(coeff)
par(mar=c(1,1,3,1))
plot(aic,k:1-.5,type='o',pch=21,bg='blue',cex=2,axes=F,lty=2,xpd=NA)
points(aic[choix],k-choix+.5,pch=21,cex=4,bg=2,xpd=NA)
title('aic',line=2)
par(mar=c(3,0,0,0))
plot(0,axes=F,xlab='',ylab='',xlim=range(ticks),ylim=c(.1,1))
rect(xleft = min(ticks) + (0:49)/50*(max(ticks)-min(ticks)),
xright = min(ticks) + (1:50)/50*(max(ticks)-min(ticks)),
ytop = rep(1,50),
ybottom= rep(0,50),col=couleurs,border=NA)
axis(1,ticks)
rect(xleft=min(ticks),xright=max(ticks),ytop=1,ybottom=0)
text(mean(coeff,na.rm=T),.5,'coefficients',cex=2,font=2)
par(mar=c(1,1,3,1))
image(1:n,1:k,t(coeff[k:1,]),axes=F,col=couleurs,zlim=range(ticks))
for(i in 1:n) for(j in 1:k) if(!is.na(coeff[j,i])) {
if(pval[j,i]<.01) symb = 'green'
else if( (pval[j,i]<.05) & (pval[j,i]>=.01)) symb = 'orange'
else if( (pval[j,i]<.1) & (pval[j,i]>=.05)) symb = 'red'
else symb = 'black'
polygon(c(i+.5 ,i+.2 ,i+.5 ,i+.5),
c(k-j+0.5,k-j+0.5,k-j+0.8,k-j+0.5),
col=symb)
if(j==choix) {
rect(xleft=i-.5,
xright=i+.5,
ybottom=k-j+1.5,
ytop=k-j+.5,
lwd=4)
text(i,
k-j+1,
round(coeff[j,i],2),
cex=1.2,
font=2)
}
else{
rect(xleft=i-.5,xright=i+.5,ybottom=k-j+1.5,ytop=k-j+.5)
text(i,k-j+1,round(coeff[j,i],2),cex=1.2,font=1)
}
}
axis(3,1:n,noms)
par(mar=c(0.5,0,0,0.5))
plot(0,axes=F,xlab='',ylab='',type='n',xlim=c(0,8),ylim=c(-.2,.8))
cols <- c('green','orange','red','black')
niv <- c('0','0.01','0.05','0.1')
for(i in 0:3){
polygon(c(1+2*i ,1+2*i ,1+2*i-.5 ,1+2*i),
c(.4 ,.7 , .4 , .4),
col=cols[i+1])
text(2*i,0.5,niv[i+1],cex=1.5)
}
text(8,.5,1,cex=1.5)
text(4,0,'p-value',cex=2)
box()
residus <- arimaSelect.out[[3]][[choix]]$res
par(mar=c(1,2,4,1))
acf(residus,main='')
title('acf',line=.5)
par(mar=c(1,2,4,1))
pacf(residus,main='')
title('pacf',line=.5)
par(mar=c(2,2,4,1))
qqnorm(residus,main='')
title('qq-norm',line=.5)
qqline(residus)
residus
}
if (par2 == 0) x <- log(x)
if (par2 != 0) x <- x^par2
(selection <- arimaSelect(x, order=c(par6,par3,par7), seasonal=list(order=c(par8,par4,par9), period=par5)))
bitmap(file='test1.png')
resid <- arimaSelectplot(selection)
dev.off()
resid
bitmap(file='test2.png')
acf(resid,length(resid)/2, main='Residual Autocorrelation Function')
dev.off()
bitmap(file='test3.png')
pacf(resid,length(resid)/2, main='Residual Partial Autocorrelation Function')
dev.off()
bitmap(file='test4.png')
cpgram(resid, main='Residual Cumulative Periodogram')
dev.off()
bitmap(file='test5.png')
hist(resid, main='Residual Histogram', xlab='values of Residuals')
dev.off()
bitmap(file='test6.png')
densityplot(~resid,col='black',main='Residual Density Plot', xlab='values of Residuals')
dev.off()
bitmap(file='test7.png')
qqnorm(resid, main='Residual Normal Q-Q Plot')
qqline(resid)
dev.off()
ncols <- length(selection[[1]][1,])
nrows <- length(selection[[2]][,1])-1
load(file='createtable')
a<-table.start()
a<-table.row.start(a)
a<-table.element(a,'ARIMA Parameter Estimation and Backward Selection', ncols+1,TRUE)
a<-table.row.end(a)
a<-table.row.start(a)
a<-table.element(a,'Iteration', header=TRUE)
for (i in 1:ncols) {
a<-table.element(a,names(selection[[3]][[1]]$coef)[i],header=TRUE)
}
a<-table.row.end(a)
for (j in 1:nrows) {
a<-table.row.start(a)
mydum <- 'Estimates ('
mydum <- paste(mydum,j)
mydum <- paste(mydum,')')
a<-table.element(a,mydum, header=TRUE)
for (i in 1:ncols) {
a<-table.element(a,round(selection[[1]][j,i],4))
}
a<-table.row.end(a)
a<-table.row.start(a)
a<-table.element(a,'(p-val)', header=TRUE)
for (i in 1:ncols) {
mydum <- '('
mydum <- paste(mydum,round(selection[[2]][j,i],4),sep='')
mydum <- paste(mydum,')')
a<-table.element(a,mydum)
}
a<-table.row.end(a)
}
a<-table.end(a)
table.save(a,file='mytable.tab')
a<-table.start()
a<-table.row.start(a)
a<-table.element(a,'Estimated ARIMA Residuals', 1,TRUE)
a<-table.row.end(a)
a<-table.row.start(a)
a<-table.element(a,'Value', 1,TRUE)
a<-table.row.end(a)
for (i in (par4*par5+par3):length(resid)) {
a<-table.row.start(a)
a<-table.element(a,resid[i])
a<-table.row.end(a)
}
a<-table.end(a)
table.save(a,file='mytable1.tab')