Free Statistics

of Irreproducible Research!

Author's title

Author*The author of this computation has been verified*
R Software Modulerwasp_autocorrelation.wasp
Title produced by software(Partial) Autocorrelation Function
Date of computationThu, 22 Dec 2016 18:02:56 +0100
Cite this page as followsStatistical Computations at FreeStatistics.org, Office for Research Development and Education, URL https://freestatistics.org/blog/index.php?v=date/2016/Dec/22/t1482426205ocumm142ygi5vbb.htm/, Retrieved Mon, 29 Apr 2024 02:17:49 +0000
Statistical Computations at FreeStatistics.org, Office for Research Development and Education, URL https://freestatistics.org/blog/index.php?pk=302573, Retrieved Mon, 29 Apr 2024 02:17:49 +0000
QR Codes:

Original text written by user:
IsPrivate?No (this computation is public)
User-defined keywords
Estimated Impact82
Family? (F = Feedback message, R = changed R code, M = changed R Module, P = changed Parameters, D = changed Data)
-       [(Partial) Autocorrelation Function] [Autocorrelatie fu...] [2016-12-22 17:02:56] [0c0812954c36a879765e84a6a68f060c] [Current]
Feedback Forum

Post a new message
Dataseries X:
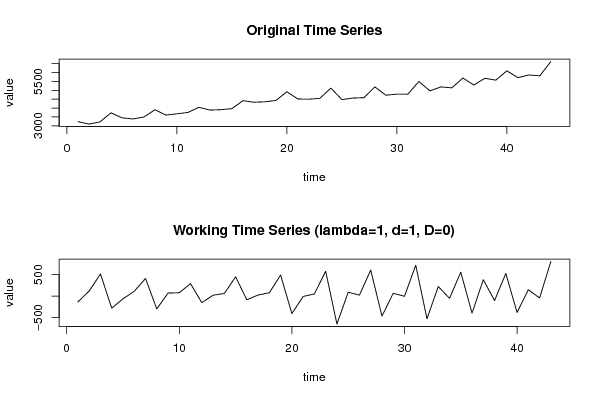
3233.7
3097.3
3216.8
3729.6
3447.7
3384.3
3494.7
3904.2
3605.2
3674.6
3751.1
4039.5
3885.9
3906.1
3965
4411.6
4325.1
4349.2
4426.1
4915
4506.9
4497.4
4546.5
5122
4471.3
4560.6
4581.6
5186.2
4719.8
4784.1
4778.6
5494.8
4966.8
5188.2
5135.4
5690.4
5293.5
5673.8
5568.9
6094.2
5712.7
5858.7
5814.6
6616.6


Summary of computational transaction
Raw Input view raw input (R code)
Raw Outputview raw output of R engine
Computing time1 seconds
R ServerBig Analytics Cloud Computing Center

\begin{tabular}{lllllllll}
\hline
Summary of computational transaction \tabularnewline
Raw Input view raw input (R code)  \tabularnewline
Raw Outputview raw output of R engine  \tabularnewline
Computing time1 seconds \tabularnewline
R ServerBig Analytics Cloud Computing Center \tabularnewline
\hline
\end{tabular}
%Source: https://freestatistics.org/blog/index.php?pk=302573&T=0

[TABLE]
[ROW]
Summary of computational transaction[/C][/ROW] [ROW]Raw Input[/C] view raw input (R code) [/C][/ROW] [ROW]Raw Output[/C]view raw output of R engine [/C][/ROW] [ROW]Computing time[/C]1 seconds[/C][/ROW] [ROW]R Server[/C]Big Analytics Cloud Computing Center[/C][/ROW] [/TABLE] Source: https://freestatistics.org/blog/index.php?pk=302573&T=0

Globally Unique Identifier (entire table): ba.freestatistics.org/blog/index.php?pk=302573&T=0

As an alternative you can also use a QR Code:  

The GUIDs for individual cells are displayed in the table below:

Summary of computational transaction
Raw Input view raw input (R code)
Raw Outputview raw output of R engine
Computing time1 seconds
R ServerBig Analytics Cloud Computing Center


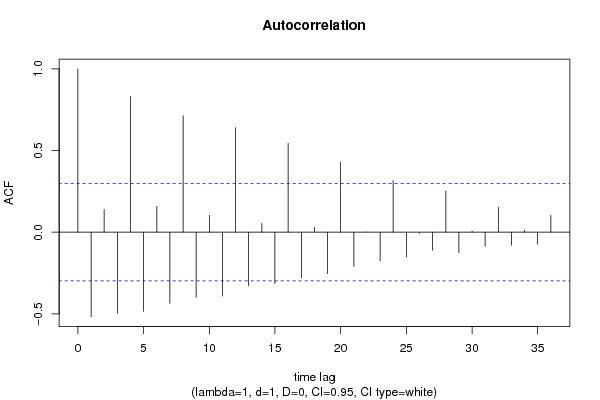
Autocorrelation Function
Time lag kACF(k)T-STATP-value
1-0.517631-3.39430.000744
20.1384520.90790.184498
3-0.49717-3.26020.001091
40.8314245.4521e-06
5-0.484495-3.1770.001377
60.1579021.03540.153127
7-0.435946-2.85870.003268
80.7129464.67511.5e-05
9-0.399245-2.6180.006081
100.1027620.67390.252004
11-0.391223-2.56540.006938
120.6402824.19866.6e-05
13-0.327724-2.1490.018652
140.0533890.35010.363987
15-0.31474-2.06390.022548
160.5438953.56660.000451
17-0.279853-1.83510.036705
180.0299310.19630.422662
19-0.25396-1.66530.051559
200.4264112.79620.00385
21-0.209667-1.37490.088145
220.0005110.00340.49867
23-0.174782-1.14610.129042
240.3159272.07170.022165
25-0.151688-0.99470.162727
26-0.006589-0.04320.482868
27-0.111371-0.73030.234581
280.2527131.65720.052384
29-0.124637-0.81730.209131
300.0061730.04050.483949
31-0.086399-0.56660.286981
320.1524240.99950.16157
33-0.080613-0.52860.299894
340.0117650.07710.469432
35-0.074066-0.48570.314828
360.1020820.66940.253411

\begin{tabular}{lllllllll}
\hline
Autocorrelation Function \tabularnewline
Time lag k & ACF(k) & T-STAT & P-value \tabularnewline
1 & -0.517631 & -3.3943 & 0.000744 \tabularnewline
2 & 0.138452 & 0.9079 & 0.184498 \tabularnewline
3 & -0.49717 & -3.2602 & 0.001091 \tabularnewline
4 & 0.831424 & 5.452 & 1e-06 \tabularnewline
5 & -0.484495 & -3.177 & 0.001377 \tabularnewline
6 & 0.157902 & 1.0354 & 0.153127 \tabularnewline
7 & -0.435946 & -2.8587 & 0.003268 \tabularnewline
8 & 0.712946 & 4.6751 & 1.5e-05 \tabularnewline
9 & -0.399245 & -2.618 & 0.006081 \tabularnewline
10 & 0.102762 & 0.6739 & 0.252004 \tabularnewline
11 & -0.391223 & -2.5654 & 0.006938 \tabularnewline
12 & 0.640282 & 4.1986 & 6.6e-05 \tabularnewline
13 & -0.327724 & -2.149 & 0.018652 \tabularnewline
14 & 0.053389 & 0.3501 & 0.363987 \tabularnewline
15 & -0.31474 & -2.0639 & 0.022548 \tabularnewline
16 & 0.543895 & 3.5666 & 0.000451 \tabularnewline
17 & -0.279853 & -1.8351 & 0.036705 \tabularnewline
18 & 0.029931 & 0.1963 & 0.422662 \tabularnewline
19 & -0.25396 & -1.6653 & 0.051559 \tabularnewline
20 & 0.426411 & 2.7962 & 0.00385 \tabularnewline
21 & -0.209667 & -1.3749 & 0.088145 \tabularnewline
22 & 0.000511 & 0.0034 & 0.49867 \tabularnewline
23 & -0.174782 & -1.1461 & 0.129042 \tabularnewline
24 & 0.315927 & 2.0717 & 0.022165 \tabularnewline
25 & -0.151688 & -0.9947 & 0.162727 \tabularnewline
26 & -0.006589 & -0.0432 & 0.482868 \tabularnewline
27 & -0.111371 & -0.7303 & 0.234581 \tabularnewline
28 & 0.252713 & 1.6572 & 0.052384 \tabularnewline
29 & -0.124637 & -0.8173 & 0.209131 \tabularnewline
30 & 0.006173 & 0.0405 & 0.483949 \tabularnewline
31 & -0.086399 & -0.5666 & 0.286981 \tabularnewline
32 & 0.152424 & 0.9995 & 0.16157 \tabularnewline
33 & -0.080613 & -0.5286 & 0.299894 \tabularnewline
34 & 0.011765 & 0.0771 & 0.469432 \tabularnewline
35 & -0.074066 & -0.4857 & 0.314828 \tabularnewline
36 & 0.102082 & 0.6694 & 0.253411 \tabularnewline
\hline
\end{tabular}
%Source: https://freestatistics.org/blog/index.php?pk=302573&T=1

[TABLE]
[ROW][C]Autocorrelation Function[/C][/ROW]
[ROW][C]Time lag k[/C][C]ACF(k)[/C][C]T-STAT[/C][C]P-value[/C][/ROW]
[ROW][C]1[/C][C]-0.517631[/C][C]-3.3943[/C][C]0.000744[/C][/ROW]
[ROW][C]2[/C][C]0.138452[/C][C]0.9079[/C][C]0.184498[/C][/ROW]
[ROW][C]3[/C][C]-0.49717[/C][C]-3.2602[/C][C]0.001091[/C][/ROW]
[ROW][C]4[/C][C]0.831424[/C][C]5.452[/C][C]1e-06[/C][/ROW]
[ROW][C]5[/C][C]-0.484495[/C][C]-3.177[/C][C]0.001377[/C][/ROW]
[ROW][C]6[/C][C]0.157902[/C][C]1.0354[/C][C]0.153127[/C][/ROW]
[ROW][C]7[/C][C]-0.435946[/C][C]-2.8587[/C][C]0.003268[/C][/ROW]
[ROW][C]8[/C][C]0.712946[/C][C]4.6751[/C][C]1.5e-05[/C][/ROW]
[ROW][C]9[/C][C]-0.399245[/C][C]-2.618[/C][C]0.006081[/C][/ROW]
[ROW][C]10[/C][C]0.102762[/C][C]0.6739[/C][C]0.252004[/C][/ROW]
[ROW][C]11[/C][C]-0.391223[/C][C]-2.5654[/C][C]0.006938[/C][/ROW]
[ROW][C]12[/C][C]0.640282[/C][C]4.1986[/C][C]6.6e-05[/C][/ROW]
[ROW][C]13[/C][C]-0.327724[/C][C]-2.149[/C][C]0.018652[/C][/ROW]
[ROW][C]14[/C][C]0.053389[/C][C]0.3501[/C][C]0.363987[/C][/ROW]
[ROW][C]15[/C][C]-0.31474[/C][C]-2.0639[/C][C]0.022548[/C][/ROW]
[ROW][C]16[/C][C]0.543895[/C][C]3.5666[/C][C]0.000451[/C][/ROW]
[ROW][C]17[/C][C]-0.279853[/C][C]-1.8351[/C][C]0.036705[/C][/ROW]
[ROW][C]18[/C][C]0.029931[/C][C]0.1963[/C][C]0.422662[/C][/ROW]
[ROW][C]19[/C][C]-0.25396[/C][C]-1.6653[/C][C]0.051559[/C][/ROW]
[ROW][C]20[/C][C]0.426411[/C][C]2.7962[/C][C]0.00385[/C][/ROW]
[ROW][C]21[/C][C]-0.209667[/C][C]-1.3749[/C][C]0.088145[/C][/ROW]
[ROW][C]22[/C][C]0.000511[/C][C]0.0034[/C][C]0.49867[/C][/ROW]
[ROW][C]23[/C][C]-0.174782[/C][C]-1.1461[/C][C]0.129042[/C][/ROW]
[ROW][C]24[/C][C]0.315927[/C][C]2.0717[/C][C]0.022165[/C][/ROW]
[ROW][C]25[/C][C]-0.151688[/C][C]-0.9947[/C][C]0.162727[/C][/ROW]
[ROW][C]26[/C][C]-0.006589[/C][C]-0.0432[/C][C]0.482868[/C][/ROW]
[ROW][C]27[/C][C]-0.111371[/C][C]-0.7303[/C][C]0.234581[/C][/ROW]
[ROW][C]28[/C][C]0.252713[/C][C]1.6572[/C][C]0.052384[/C][/ROW]
[ROW][C]29[/C][C]-0.124637[/C][C]-0.8173[/C][C]0.209131[/C][/ROW]
[ROW][C]30[/C][C]0.006173[/C][C]0.0405[/C][C]0.483949[/C][/ROW]
[ROW][C]31[/C][C]-0.086399[/C][C]-0.5666[/C][C]0.286981[/C][/ROW]
[ROW][C]32[/C][C]0.152424[/C][C]0.9995[/C][C]0.16157[/C][/ROW]
[ROW][C]33[/C][C]-0.080613[/C][C]-0.5286[/C][C]0.299894[/C][/ROW]
[ROW][C]34[/C][C]0.011765[/C][C]0.0771[/C][C]0.469432[/C][/ROW]
[ROW][C]35[/C][C]-0.074066[/C][C]-0.4857[/C][C]0.314828[/C][/ROW]
[ROW][C]36[/C][C]0.102082[/C][C]0.6694[/C][C]0.253411[/C][/ROW]
[/TABLE]
Source: https://freestatistics.org/blog/index.php?pk=302573&T=1

Globally Unique Identifier (entire table): ba.freestatistics.org/blog/index.php?pk=302573&T=1

As an alternative you can also use a QR Code:  

The GUIDs for individual cells are displayed in the table below:

Autocorrelation Function
Time lag kACF(k)T-STATP-value
1-0.517631-3.39430.000744
20.1384520.90790.184498
3-0.49717-3.26020.001091
40.8314245.4521e-06
5-0.484495-3.1770.001377
60.1579021.03540.153127
7-0.435946-2.85870.003268
80.7129464.67511.5e-05
9-0.399245-2.6180.006081
100.1027620.67390.252004
11-0.391223-2.56540.006938
120.6402824.19866.6e-05
13-0.327724-2.1490.018652
140.0533890.35010.363987
15-0.31474-2.06390.022548
160.5438953.56660.000451
17-0.279853-1.83510.036705
180.0299310.19630.422662
19-0.25396-1.66530.051559
200.4264112.79620.00385
21-0.209667-1.37490.088145
220.0005110.00340.49867
23-0.174782-1.14610.129042
240.3159272.07170.022165
25-0.151688-0.99470.162727
26-0.006589-0.04320.482868
27-0.111371-0.73030.234581
280.2527131.65720.052384
29-0.124637-0.81730.209131
300.0061730.04050.483949
31-0.086399-0.56660.286981
320.1524240.99950.16157
33-0.080613-0.52860.299894
340.0117650.07710.469432
35-0.074066-0.48570.314828
360.1020820.66940.253411


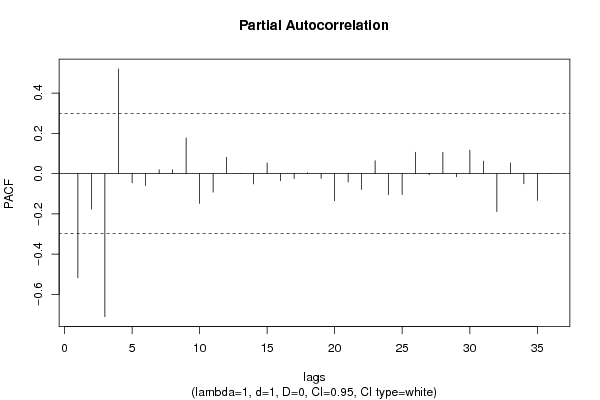
Partial Autocorrelation Function
Time lag kPACF(k)T-STATP-value
1-0.517631-3.39430.000744
2-0.176884-1.15990.126243
3-0.711252-4.6641.5e-05
40.5202993.41180.000708
5-0.045978-0.30150.382244
6-0.05913-0.38770.350061
70.0191650.12570.450288
80.0189880.12450.450744
90.1772291.16220.125789
10-0.148009-0.97060.168597
11-0.092147-0.60420.274427
120.0807420.52950.299606
130.0002320.00150.499396
14-0.051332-0.33660.369025
150.05290.34690.365183
16-0.035563-0.23320.408355
17-0.024828-0.16280.435717
180.0040810.02680.489388
19-0.024005-0.15740.437829
20-0.134903-0.88460.190641
21-0.041495-0.27210.393422
22-0.079173-0.51920.303151
230.0635610.41680.339449
24-0.104435-0.68480.248564
25-0.103849-0.6810.249767
260.1065470.69870.244258
27-0.00584-0.03830.484815
280.1056660.69290.24605
29-0.015917-0.10440.45868
300.1159310.76020.225639
310.0619370.40620.343323
32-0.188531-1.23630.111532
330.0526980.34560.365678
34-0.050497-0.33110.371078
35-0.133036-0.87240.193924
367e-055e-040.499819

\begin{tabular}{lllllllll}
\hline
Partial Autocorrelation Function \tabularnewline
Time lag k & PACF(k) & T-STAT & P-value \tabularnewline
1 & -0.517631 & -3.3943 & 0.000744 \tabularnewline
2 & -0.176884 & -1.1599 & 0.126243 \tabularnewline
3 & -0.711252 & -4.664 & 1.5e-05 \tabularnewline
4 & 0.520299 & 3.4118 & 0.000708 \tabularnewline
5 & -0.045978 & -0.3015 & 0.382244 \tabularnewline
6 & -0.05913 & -0.3877 & 0.350061 \tabularnewline
7 & 0.019165 & 0.1257 & 0.450288 \tabularnewline
8 & 0.018988 & 0.1245 & 0.450744 \tabularnewline
9 & 0.177229 & 1.1622 & 0.125789 \tabularnewline
10 & -0.148009 & -0.9706 & 0.168597 \tabularnewline
11 & -0.092147 & -0.6042 & 0.274427 \tabularnewline
12 & 0.080742 & 0.5295 & 0.299606 \tabularnewline
13 & 0.000232 & 0.0015 & 0.499396 \tabularnewline
14 & -0.051332 & -0.3366 & 0.369025 \tabularnewline
15 & 0.0529 & 0.3469 & 0.365183 \tabularnewline
16 & -0.035563 & -0.2332 & 0.408355 \tabularnewline
17 & -0.024828 & -0.1628 & 0.435717 \tabularnewline
18 & 0.004081 & 0.0268 & 0.489388 \tabularnewline
19 & -0.024005 & -0.1574 & 0.437829 \tabularnewline
20 & -0.134903 & -0.8846 & 0.190641 \tabularnewline
21 & -0.041495 & -0.2721 & 0.393422 \tabularnewline
22 & -0.079173 & -0.5192 & 0.303151 \tabularnewline
23 & 0.063561 & 0.4168 & 0.339449 \tabularnewline
24 & -0.104435 & -0.6848 & 0.248564 \tabularnewline
25 & -0.103849 & -0.681 & 0.249767 \tabularnewline
26 & 0.106547 & 0.6987 & 0.244258 \tabularnewline
27 & -0.00584 & -0.0383 & 0.484815 \tabularnewline
28 & 0.105666 & 0.6929 & 0.24605 \tabularnewline
29 & -0.015917 & -0.1044 & 0.45868 \tabularnewline
30 & 0.115931 & 0.7602 & 0.225639 \tabularnewline
31 & 0.061937 & 0.4062 & 0.343323 \tabularnewline
32 & -0.188531 & -1.2363 & 0.111532 \tabularnewline
33 & 0.052698 & 0.3456 & 0.365678 \tabularnewline
34 & -0.050497 & -0.3311 & 0.371078 \tabularnewline
35 & -0.133036 & -0.8724 & 0.193924 \tabularnewline
36 & 7e-05 & 5e-04 & 0.499819 \tabularnewline
\hline
\end{tabular}
%Source: https://freestatistics.org/blog/index.php?pk=302573&T=2

[TABLE]
[ROW][C]Partial Autocorrelation Function[/C][/ROW]
[ROW][C]Time lag k[/C][C]PACF(k)[/C][C]T-STAT[/C][C]P-value[/C][/ROW]
[ROW][C]1[/C][C]-0.517631[/C][C]-3.3943[/C][C]0.000744[/C][/ROW]
[ROW][C]2[/C][C]-0.176884[/C][C]-1.1599[/C][C]0.126243[/C][/ROW]
[ROW][C]3[/C][C]-0.711252[/C][C]-4.664[/C][C]1.5e-05[/C][/ROW]
[ROW][C]4[/C][C]0.520299[/C][C]3.4118[/C][C]0.000708[/C][/ROW]
[ROW][C]5[/C][C]-0.045978[/C][C]-0.3015[/C][C]0.382244[/C][/ROW]
[ROW][C]6[/C][C]-0.05913[/C][C]-0.3877[/C][C]0.350061[/C][/ROW]
[ROW][C]7[/C][C]0.019165[/C][C]0.1257[/C][C]0.450288[/C][/ROW]
[ROW][C]8[/C][C]0.018988[/C][C]0.1245[/C][C]0.450744[/C][/ROW]
[ROW][C]9[/C][C]0.177229[/C][C]1.1622[/C][C]0.125789[/C][/ROW]
[ROW][C]10[/C][C]-0.148009[/C][C]-0.9706[/C][C]0.168597[/C][/ROW]
[ROW][C]11[/C][C]-0.092147[/C][C]-0.6042[/C][C]0.274427[/C][/ROW]
[ROW][C]12[/C][C]0.080742[/C][C]0.5295[/C][C]0.299606[/C][/ROW]
[ROW][C]13[/C][C]0.000232[/C][C]0.0015[/C][C]0.499396[/C][/ROW]
[ROW][C]14[/C][C]-0.051332[/C][C]-0.3366[/C][C]0.369025[/C][/ROW]
[ROW][C]15[/C][C]0.0529[/C][C]0.3469[/C][C]0.365183[/C][/ROW]
[ROW][C]16[/C][C]-0.035563[/C][C]-0.2332[/C][C]0.408355[/C][/ROW]
[ROW][C]17[/C][C]-0.024828[/C][C]-0.1628[/C][C]0.435717[/C][/ROW]
[ROW][C]18[/C][C]0.004081[/C][C]0.0268[/C][C]0.489388[/C][/ROW]
[ROW][C]19[/C][C]-0.024005[/C][C]-0.1574[/C][C]0.437829[/C][/ROW]
[ROW][C]20[/C][C]-0.134903[/C][C]-0.8846[/C][C]0.190641[/C][/ROW]
[ROW][C]21[/C][C]-0.041495[/C][C]-0.2721[/C][C]0.393422[/C][/ROW]
[ROW][C]22[/C][C]-0.079173[/C][C]-0.5192[/C][C]0.303151[/C][/ROW]
[ROW][C]23[/C][C]0.063561[/C][C]0.4168[/C][C]0.339449[/C][/ROW]
[ROW][C]24[/C][C]-0.104435[/C][C]-0.6848[/C][C]0.248564[/C][/ROW]
[ROW][C]25[/C][C]-0.103849[/C][C]-0.681[/C][C]0.249767[/C][/ROW]
[ROW][C]26[/C][C]0.106547[/C][C]0.6987[/C][C]0.244258[/C][/ROW]
[ROW][C]27[/C][C]-0.00584[/C][C]-0.0383[/C][C]0.484815[/C][/ROW]
[ROW][C]28[/C][C]0.105666[/C][C]0.6929[/C][C]0.24605[/C][/ROW]
[ROW][C]29[/C][C]-0.015917[/C][C]-0.1044[/C][C]0.45868[/C][/ROW]
[ROW][C]30[/C][C]0.115931[/C][C]0.7602[/C][C]0.225639[/C][/ROW]
[ROW][C]31[/C][C]0.061937[/C][C]0.4062[/C][C]0.343323[/C][/ROW]
[ROW][C]32[/C][C]-0.188531[/C][C]-1.2363[/C][C]0.111532[/C][/ROW]
[ROW][C]33[/C][C]0.052698[/C][C]0.3456[/C][C]0.365678[/C][/ROW]
[ROW][C]34[/C][C]-0.050497[/C][C]-0.3311[/C][C]0.371078[/C][/ROW]
[ROW][C]35[/C][C]-0.133036[/C][C]-0.8724[/C][C]0.193924[/C][/ROW]
[ROW][C]36[/C][C]7e-05[/C][C]5e-04[/C][C]0.499819[/C][/ROW]
[/TABLE]
Source: https://freestatistics.org/blog/index.php?pk=302573&T=2

Globally Unique Identifier (entire table): ba.freestatistics.org/blog/index.php?pk=302573&T=2

As an alternative you can also use a QR Code:  

The GUIDs for individual cells are displayed in the table below:

Partial Autocorrelation Function
Time lag kPACF(k)T-STATP-value
1-0.517631-3.39430.000744
2-0.176884-1.15990.126243
3-0.711252-4.6641.5e-05
40.5202993.41180.000708
5-0.045978-0.30150.382244
6-0.05913-0.38770.350061
70.0191650.12570.450288
80.0189880.12450.450744
90.1772291.16220.125789
10-0.148009-0.97060.168597
11-0.092147-0.60420.274427
120.0807420.52950.299606
130.0002320.00150.499396
14-0.051332-0.33660.369025
150.05290.34690.365183
16-0.035563-0.23320.408355
17-0.024828-0.16280.435717
180.0040810.02680.489388
19-0.024005-0.15740.437829
20-0.134903-0.88460.190641
21-0.041495-0.27210.393422
22-0.079173-0.51920.303151
230.0635610.41680.339449
24-0.104435-0.68480.248564
25-0.103849-0.6810.249767
260.1065470.69870.244258
27-0.00584-0.03830.484815
280.1056660.69290.24605
29-0.015917-0.10440.45868
300.1159310.76020.225639
310.0619370.40620.343323
32-0.188531-1.23630.111532
330.0526980.34560.365678
34-0.050497-0.33110.371078
35-0.133036-0.87240.193924
367e-055e-040.499819


Parameters (Session):
par1 = 36 ; par2 = 1 ; par3 = 0 ; par4 = 2 ; par5 = 6 ; par6 = White Noise ; par7 = 0.95 ;
Parameters (R input):
par1 = 36 ; par2 = 1 ; par3 = 1 ; par4 = 0 ; par5 = 12 ; par6 = White Noise ; par7 = 0.95 ; par8 = ;
R code (references can be found in the software module):
if (par1 == 'Default') {
par1 = 10*log10(length(x))
} else {
par1 <- as.numeric(par1)
}
par2 <- as.numeric(par2)
par3 <- as.numeric(par3)
par4 <- as.numeric(par4)
par5 <- as.numeric(par5)
if (par6 == 'White Noise') par6 <- 'white' else par6 <- 'ma'
par7 <- as.numeric(par7)
if (par8 != '') par8 <- as.numeric(par8)
x <- na.omit(x)
ox <- x
if (par8 == '') {
if (par2 == 0) {
x <- log(x)
} else {
x <- (x ^ par2 - 1) / par2
}
} else {
x <- log(x,base=par8)
}
if (par3 > 0) x <- diff(x,lag=1,difference=par3)
if (par4 > 0) x <- diff(x,lag=par5,difference=par4)
bitmap(file='picts.png')
op <- par(mfrow=c(2,1))
plot(ox,type='l',main='Original Time Series',xlab='time',ylab='value')
if (par8=='') {
mytitle <- paste('Working Time Series (lambda=',par2,', d=',par3,', D=',par4,')',sep='')
mysub <- paste('(lambda=',par2,', d=',par3,', D=',par4,', CI=', par7, ', CI type=',par6,')',sep='')
} else {
mytitle <- paste('Working Time Series (base=',par8,', d=',par3,', D=',par4,')',sep='')
mysub <- paste('(base=',par8,', d=',par3,', D=',par4,', CI=', par7, ', CI type=',par6,')',sep='')
}
plot(x,type='l', main=mytitle,xlab='time',ylab='value')
par(op)
dev.off()
bitmap(file='pic1.png')
racf <- acf(x, par1, main='Autocorrelation', xlab='time lag', ylab='ACF', ci.type=par6, ci=par7, sub=mysub)
dev.off()
bitmap(file='pic2.png')
rpacf <- pacf(x,par1,main='Partial Autocorrelation',xlab='lags',ylab='PACF',sub=mysub)
dev.off()
(myacf <- c(racf$acf))
(mypacf <- c(rpacf$acf))
lengthx <- length(x)
sqrtn <- sqrt(lengthx)
load(file='createtable')
a<-table.start()
a<-table.row.start(a)
a<-table.element(a,'Autocorrelation Function',4,TRUE)
a<-table.row.end(a)
a<-table.row.start(a)
a<-table.element(a,'Time lag k',header=TRUE)
a<-table.element(a,'ACF(k)',header=TRUE)
a<-table.element(a,'T-STAT',header=TRUE)
a<-table.element(a,'P-value',header=TRUE)
a<-table.row.end(a)
for (i in 2:(par1+1)) {
a<-table.row.start(a)
a<-table.element(a,i-1,header=TRUE)
a<-table.element(a,round(myacf[i],6))
mytstat <- myacf[i]*sqrtn
a<-table.element(a,round(mytstat,4))
a<-table.element(a,round(1-pt(abs(mytstat),lengthx),6))
a<-table.row.end(a)
}
a<-table.end(a)
table.save(a,file='mytable.tab')
a<-table.start()
a<-table.row.start(a)
a<-table.element(a,'Partial Autocorrelation Function',4,TRUE)
a<-table.row.end(a)
a<-table.row.start(a)
a<-table.element(a,'Time lag k',header=TRUE)
a<-table.element(a,'PACF(k)',header=TRUE)
a<-table.element(a,'T-STAT',header=TRUE)
a<-table.element(a,'P-value',header=TRUE)
a<-table.row.end(a)
for (i in 1:par1) {
a<-table.row.start(a)
a<-table.element(a,i,header=TRUE)
a<-table.element(a,round(mypacf[i],6))
mytstat <- mypacf[i]*sqrtn
a<-table.element(a,round(mytstat,4))
a<-table.element(a,round(1-pt(abs(mytstat),lengthx),6))
a<-table.row.end(a)
}
a<-table.end(a)
table.save(a,file='mytable1.tab')