Free Statistics

of Irreproducible Research!

Author's title

Author*The author of this computation has been verified*
R Software Modulerwasp_autocorrelation.wasp
Title produced by software(Partial) Autocorrelation Function
Date of computationThu, 22 Dec 2016 18:10:26 +0100
Cite this page as followsStatistical Computations at FreeStatistics.org, Office for Research Development and Education, URL https://freestatistics.org/blog/index.php?v=date/2016/Dec/22/t1482426654ojju1bq3drbi50f.htm/, Retrieved Sun, 28 Apr 2024 21:08:58 +0000
Statistical Computations at FreeStatistics.org, Office for Research Development and Education, URL https://freestatistics.org/blog/index.php?pk=302575, Retrieved Sun, 28 Apr 2024 21:08:58 +0000
QR Codes:

Original text written by user:
IsPrivate?No (this computation is public)
User-defined keywords
Estimated Impact74
Family? (F = Feedback message, R = changed R code, M = changed R Module, P = changed Parameters, D = changed Data)
-       [(Partial) Autocorrelation Function] [Autocorrelatie fu...] [2016-12-22 17:10:26] [0c0812954c36a879765e84a6a68f060c] [Current]
Feedback Forum

Post a new message
Dataseries X:
3233.7
3097.3
3216.8
3729.6
3447.7
3384.3
3494.7
3904.2
3605.2
3674.6
3751.1
4039.5
3885.9
3906.1
3965
4411.6
4325.1
4349.2
4426.1
4915
4506.9
4497.4
4546.5
5122
4471.3
4560.6
4581.6
5186.2
4719.8
4784.1
4778.6
5494.8
4966.8
5188.2
5135.4
5690.4
5293.5
5673.8
5568.9
6094.2
5712.7
5858.7
5814.6
6616.6


Summary of computational transaction
Raw Input view raw input (R code)
Raw Outputview raw output of R engine
Computing time2 seconds
R ServerBig Analytics Cloud Computing Center

\begin{tabular}{lllllllll}
\hline
Summary of computational transaction \tabularnewline
Raw Input view raw input (R code)  \tabularnewline
Raw Outputview raw output of R engine  \tabularnewline
Computing time2 seconds \tabularnewline
R ServerBig Analytics Cloud Computing Center \tabularnewline
\hline
\end{tabular}
%Source: https://freestatistics.org/blog/index.php?pk=302575&T=0

[TABLE]
[ROW]
Summary of computational transaction[/C][/ROW] [ROW]Raw Input[/C] view raw input (R code) [/C][/ROW] [ROW]Raw Output[/C]view raw output of R engine [/C][/ROW] [ROW]Computing time[/C]2 seconds[/C][/ROW] [ROW]R Server[/C]Big Analytics Cloud Computing Center[/C][/ROW] [/TABLE] Source: https://freestatistics.org/blog/index.php?pk=302575&T=0

Globally Unique Identifier (entire table): ba.freestatistics.org/blog/index.php?pk=302575&T=0

As an alternative you can also use a QR Code:  

The GUIDs for individual cells are displayed in the table below:

Summary of computational transaction
Raw Input view raw input (R code)
Raw Outputview raw output of R engine
Computing time2 seconds
R ServerBig Analytics Cloud Computing Center


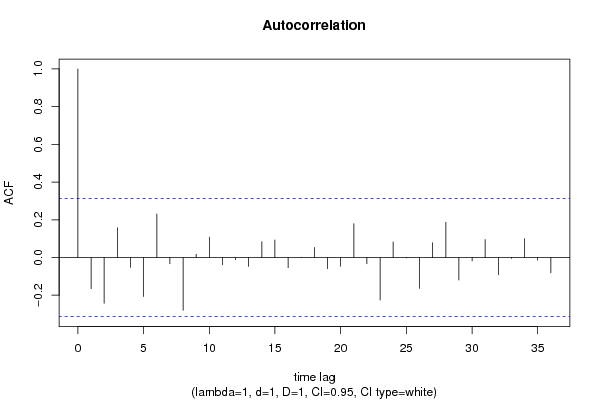
Autocorrelation Function
Time lag kACF(k)T-STATP-value
1-0.165412-1.0330.153984
2-0.242393-1.51370.069077
30.1571640.98150.166201
4-0.051649-0.32250.37438
5-0.207168-1.29380.101679
60.2309661.44240.078589
7-0.032988-0.2060.418927
8-0.279709-1.74680.044274
90.0176390.11020.456427
100.107820.67330.252353
11-0.038982-0.24340.404469
12-0.011633-0.07260.471229
13-0.04708-0.2940.385153
140.083390.52080.302737
150.0930350.5810.282291
16-0.05373-0.33550.369507
170.0003310.00210.499182
180.0529310.33060.371374
19-0.059272-0.37020.356636
20-0.046752-0.2920.38593
210.1790681.11830.135145
22-0.033425-0.20870.417868
23-0.225801-1.41010.083214
240.0818250.5110.306116
25-0.002248-0.0140.494435
26-0.163798-1.02290.156325
270.0779210.48660.314627
280.1862391.16310.125936
29-0.119364-0.74540.230241
30-0.017897-0.11180.45579
310.0948820.59250.278456
32-0.091443-0.57110.285617
33-0.004676-0.02920.488425
340.0989870.61820.270028
35-0.013984-0.08730.465429
36-0.081412-0.50840.307011

\begin{tabular}{lllllllll}
\hline
Autocorrelation Function \tabularnewline
Time lag k & ACF(k) & T-STAT & P-value \tabularnewline
1 & -0.165412 & -1.033 & 0.153984 \tabularnewline
2 & -0.242393 & -1.5137 & 0.069077 \tabularnewline
3 & 0.157164 & 0.9815 & 0.166201 \tabularnewline
4 & -0.051649 & -0.3225 & 0.37438 \tabularnewline
5 & -0.207168 & -1.2938 & 0.101679 \tabularnewline
6 & 0.230966 & 1.4424 & 0.078589 \tabularnewline
7 & -0.032988 & -0.206 & 0.418927 \tabularnewline
8 & -0.279709 & -1.7468 & 0.044274 \tabularnewline
9 & 0.017639 & 0.1102 & 0.456427 \tabularnewline
10 & 0.10782 & 0.6733 & 0.252353 \tabularnewline
11 & -0.038982 & -0.2434 & 0.404469 \tabularnewline
12 & -0.011633 & -0.0726 & 0.471229 \tabularnewline
13 & -0.04708 & -0.294 & 0.385153 \tabularnewline
14 & 0.08339 & 0.5208 & 0.302737 \tabularnewline
15 & 0.093035 & 0.581 & 0.282291 \tabularnewline
16 & -0.05373 & -0.3355 & 0.369507 \tabularnewline
17 & 0.000331 & 0.0021 & 0.499182 \tabularnewline
18 & 0.052931 & 0.3306 & 0.371374 \tabularnewline
19 & -0.059272 & -0.3702 & 0.356636 \tabularnewline
20 & -0.046752 & -0.292 & 0.38593 \tabularnewline
21 & 0.179068 & 1.1183 & 0.135145 \tabularnewline
22 & -0.033425 & -0.2087 & 0.417868 \tabularnewline
23 & -0.225801 & -1.4101 & 0.083214 \tabularnewline
24 & 0.081825 & 0.511 & 0.306116 \tabularnewline
25 & -0.002248 & -0.014 & 0.494435 \tabularnewline
26 & -0.163798 & -1.0229 & 0.156325 \tabularnewline
27 & 0.077921 & 0.4866 & 0.314627 \tabularnewline
28 & 0.186239 & 1.1631 & 0.125936 \tabularnewline
29 & -0.119364 & -0.7454 & 0.230241 \tabularnewline
30 & -0.017897 & -0.1118 & 0.45579 \tabularnewline
31 & 0.094882 & 0.5925 & 0.278456 \tabularnewline
32 & -0.091443 & -0.5711 & 0.285617 \tabularnewline
33 & -0.004676 & -0.0292 & 0.488425 \tabularnewline
34 & 0.098987 & 0.6182 & 0.270028 \tabularnewline
35 & -0.013984 & -0.0873 & 0.465429 \tabularnewline
36 & -0.081412 & -0.5084 & 0.307011 \tabularnewline
\hline
\end{tabular}
%Source: https://freestatistics.org/blog/index.php?pk=302575&T=1

[TABLE]
[ROW][C]Autocorrelation Function[/C][/ROW]
[ROW][C]Time lag k[/C][C]ACF(k)[/C][C]T-STAT[/C][C]P-value[/C][/ROW]
[ROW][C]1[/C][C]-0.165412[/C][C]-1.033[/C][C]0.153984[/C][/ROW]
[ROW][C]2[/C][C]-0.242393[/C][C]-1.5137[/C][C]0.069077[/C][/ROW]
[ROW][C]3[/C][C]0.157164[/C][C]0.9815[/C][C]0.166201[/C][/ROW]
[ROW][C]4[/C][C]-0.051649[/C][C]-0.3225[/C][C]0.37438[/C][/ROW]
[ROW][C]5[/C][C]-0.207168[/C][C]-1.2938[/C][C]0.101679[/C][/ROW]
[ROW][C]6[/C][C]0.230966[/C][C]1.4424[/C][C]0.078589[/C][/ROW]
[ROW][C]7[/C][C]-0.032988[/C][C]-0.206[/C][C]0.418927[/C][/ROW]
[ROW][C]8[/C][C]-0.279709[/C][C]-1.7468[/C][C]0.044274[/C][/ROW]
[ROW][C]9[/C][C]0.017639[/C][C]0.1102[/C][C]0.456427[/C][/ROW]
[ROW][C]10[/C][C]0.10782[/C][C]0.6733[/C][C]0.252353[/C][/ROW]
[ROW][C]11[/C][C]-0.038982[/C][C]-0.2434[/C][C]0.404469[/C][/ROW]
[ROW][C]12[/C][C]-0.011633[/C][C]-0.0726[/C][C]0.471229[/C][/ROW]
[ROW][C]13[/C][C]-0.04708[/C][C]-0.294[/C][C]0.385153[/C][/ROW]
[ROW][C]14[/C][C]0.08339[/C][C]0.5208[/C][C]0.302737[/C][/ROW]
[ROW][C]15[/C][C]0.093035[/C][C]0.581[/C][C]0.282291[/C][/ROW]
[ROW][C]16[/C][C]-0.05373[/C][C]-0.3355[/C][C]0.369507[/C][/ROW]
[ROW][C]17[/C][C]0.000331[/C][C]0.0021[/C][C]0.499182[/C][/ROW]
[ROW][C]18[/C][C]0.052931[/C][C]0.3306[/C][C]0.371374[/C][/ROW]
[ROW][C]19[/C][C]-0.059272[/C][C]-0.3702[/C][C]0.356636[/C][/ROW]
[ROW][C]20[/C][C]-0.046752[/C][C]-0.292[/C][C]0.38593[/C][/ROW]
[ROW][C]21[/C][C]0.179068[/C][C]1.1183[/C][C]0.135145[/C][/ROW]
[ROW][C]22[/C][C]-0.033425[/C][C]-0.2087[/C][C]0.417868[/C][/ROW]
[ROW][C]23[/C][C]-0.225801[/C][C]-1.4101[/C][C]0.083214[/C][/ROW]
[ROW][C]24[/C][C]0.081825[/C][C]0.511[/C][C]0.306116[/C][/ROW]
[ROW][C]25[/C][C]-0.002248[/C][C]-0.014[/C][C]0.494435[/C][/ROW]
[ROW][C]26[/C][C]-0.163798[/C][C]-1.0229[/C][C]0.156325[/C][/ROW]
[ROW][C]27[/C][C]0.077921[/C][C]0.4866[/C][C]0.314627[/C][/ROW]
[ROW][C]28[/C][C]0.186239[/C][C]1.1631[/C][C]0.125936[/C][/ROW]
[ROW][C]29[/C][C]-0.119364[/C][C]-0.7454[/C][C]0.230241[/C][/ROW]
[ROW][C]30[/C][C]-0.017897[/C][C]-0.1118[/C][C]0.45579[/C][/ROW]
[ROW][C]31[/C][C]0.094882[/C][C]0.5925[/C][C]0.278456[/C][/ROW]
[ROW][C]32[/C][C]-0.091443[/C][C]-0.5711[/C][C]0.285617[/C][/ROW]
[ROW][C]33[/C][C]-0.004676[/C][C]-0.0292[/C][C]0.488425[/C][/ROW]
[ROW][C]34[/C][C]0.098987[/C][C]0.6182[/C][C]0.270028[/C][/ROW]
[ROW][C]35[/C][C]-0.013984[/C][C]-0.0873[/C][C]0.465429[/C][/ROW]
[ROW][C]36[/C][C]-0.081412[/C][C]-0.5084[/C][C]0.307011[/C][/ROW]
[/TABLE]
Source: https://freestatistics.org/blog/index.php?pk=302575&T=1

Globally Unique Identifier (entire table): ba.freestatistics.org/blog/index.php?pk=302575&T=1

As an alternative you can also use a QR Code:  

The GUIDs for individual cells are displayed in the table below:

Autocorrelation Function
Time lag kACF(k)T-STATP-value
1-0.165412-1.0330.153984
2-0.242393-1.51370.069077
30.1571640.98150.166201
4-0.051649-0.32250.37438
5-0.207168-1.29380.101679
60.2309661.44240.078589
7-0.032988-0.2060.418927
8-0.279709-1.74680.044274
90.0176390.11020.456427
100.107820.67330.252353
11-0.038982-0.24340.404469
12-0.011633-0.07260.471229
13-0.04708-0.2940.385153
140.083390.52080.302737
150.0930350.5810.282291
16-0.05373-0.33550.369507
170.0003310.00210.499182
180.0529310.33060.371374
19-0.059272-0.37020.356636
20-0.046752-0.2920.38593
210.1790681.11830.135145
22-0.033425-0.20870.417868
23-0.225801-1.41010.083214
240.0818250.5110.306116
25-0.002248-0.0140.494435
26-0.163798-1.02290.156325
270.0779210.48660.314627
280.1862391.16310.125936
29-0.119364-0.74540.230241
30-0.017897-0.11180.45579
310.0948820.59250.278456
32-0.091443-0.57110.285617
33-0.004676-0.02920.488425
340.0989870.61820.270028
35-0.013984-0.08730.465429
36-0.081412-0.50840.307011


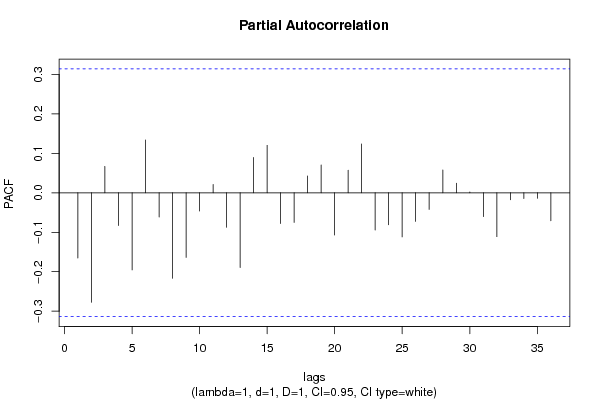
Partial Autocorrelation Function
Time lag kPACF(k)T-STATP-value
1-0.165412-1.0330.153984
2-0.277342-1.7320.045588
30.066910.41790.339173
4-0.082893-0.51770.303808
5-0.195351-1.220.114902
60.1336420.83460.204515
7-0.061531-0.38430.351436
8-0.216351-1.35110.092223
9-0.163596-1.02170.156619
10-0.046241-0.28880.387141
110.0210670.13160.448002
12-0.087489-0.54640.293963
13-0.189242-1.18180.122217
140.0893950.55830.289925
150.1201820.75050.228718
16-0.07775-0.48550.315003
17-0.074969-0.46820.32113
180.0427230.26680.395512
190.0703280.43920.33147
20-0.107138-0.66910.253693
210.0573760.35830.361021
220.1235570.77160.222498
23-0.094499-0.59010.279249
24-0.080971-0.50570.307969
25-0.111776-0.6980.244646
26-0.072401-0.45210.326835
27-0.041984-0.26220.397278
280.0579150.36170.359773
290.0243830.15230.43988
300.0019960.01250.495059
31-0.060307-0.37660.35425
32-0.111167-0.69420.245824
33-0.017592-0.10990.456542
34-0.014512-0.09060.464127
35-0.013921-0.08690.465582
36-0.070641-0.44120.330769

\begin{tabular}{lllllllll}
\hline
Partial Autocorrelation Function \tabularnewline
Time lag k & PACF(k) & T-STAT & P-value \tabularnewline
1 & -0.165412 & -1.033 & 0.153984 \tabularnewline
2 & -0.277342 & -1.732 & 0.045588 \tabularnewline
3 & 0.06691 & 0.4179 & 0.339173 \tabularnewline
4 & -0.082893 & -0.5177 & 0.303808 \tabularnewline
5 & -0.195351 & -1.22 & 0.114902 \tabularnewline
6 & 0.133642 & 0.8346 & 0.204515 \tabularnewline
7 & -0.061531 & -0.3843 & 0.351436 \tabularnewline
8 & -0.216351 & -1.3511 & 0.092223 \tabularnewline
9 & -0.163596 & -1.0217 & 0.156619 \tabularnewline
10 & -0.046241 & -0.2888 & 0.387141 \tabularnewline
11 & 0.021067 & 0.1316 & 0.448002 \tabularnewline
12 & -0.087489 & -0.5464 & 0.293963 \tabularnewline
13 & -0.189242 & -1.1818 & 0.122217 \tabularnewline
14 & 0.089395 & 0.5583 & 0.289925 \tabularnewline
15 & 0.120182 & 0.7505 & 0.228718 \tabularnewline
16 & -0.07775 & -0.4855 & 0.315003 \tabularnewline
17 & -0.074969 & -0.4682 & 0.32113 \tabularnewline
18 & 0.042723 & 0.2668 & 0.395512 \tabularnewline
19 & 0.070328 & 0.4392 & 0.33147 \tabularnewline
20 & -0.107138 & -0.6691 & 0.253693 \tabularnewline
21 & 0.057376 & 0.3583 & 0.361021 \tabularnewline
22 & 0.123557 & 0.7716 & 0.222498 \tabularnewline
23 & -0.094499 & -0.5901 & 0.279249 \tabularnewline
24 & -0.080971 & -0.5057 & 0.307969 \tabularnewline
25 & -0.111776 & -0.698 & 0.244646 \tabularnewline
26 & -0.072401 & -0.4521 & 0.326835 \tabularnewline
27 & -0.041984 & -0.2622 & 0.397278 \tabularnewline
28 & 0.057915 & 0.3617 & 0.359773 \tabularnewline
29 & 0.024383 & 0.1523 & 0.43988 \tabularnewline
30 & 0.001996 & 0.0125 & 0.495059 \tabularnewline
31 & -0.060307 & -0.3766 & 0.35425 \tabularnewline
32 & -0.111167 & -0.6942 & 0.245824 \tabularnewline
33 & -0.017592 & -0.1099 & 0.456542 \tabularnewline
34 & -0.014512 & -0.0906 & 0.464127 \tabularnewline
35 & -0.013921 & -0.0869 & 0.465582 \tabularnewline
36 & -0.070641 & -0.4412 & 0.330769 \tabularnewline
\hline
\end{tabular}
%Source: https://freestatistics.org/blog/index.php?pk=302575&T=2

[TABLE]
[ROW][C]Partial Autocorrelation Function[/C][/ROW]
[ROW][C]Time lag k[/C][C]PACF(k)[/C][C]T-STAT[/C][C]P-value[/C][/ROW]
[ROW][C]1[/C][C]-0.165412[/C][C]-1.033[/C][C]0.153984[/C][/ROW]
[ROW][C]2[/C][C]-0.277342[/C][C]-1.732[/C][C]0.045588[/C][/ROW]
[ROW][C]3[/C][C]0.06691[/C][C]0.4179[/C][C]0.339173[/C][/ROW]
[ROW][C]4[/C][C]-0.082893[/C][C]-0.5177[/C][C]0.303808[/C][/ROW]
[ROW][C]5[/C][C]-0.195351[/C][C]-1.22[/C][C]0.114902[/C][/ROW]
[ROW][C]6[/C][C]0.133642[/C][C]0.8346[/C][C]0.204515[/C][/ROW]
[ROW][C]7[/C][C]-0.061531[/C][C]-0.3843[/C][C]0.351436[/C][/ROW]
[ROW][C]8[/C][C]-0.216351[/C][C]-1.3511[/C][C]0.092223[/C][/ROW]
[ROW][C]9[/C][C]-0.163596[/C][C]-1.0217[/C][C]0.156619[/C][/ROW]
[ROW][C]10[/C][C]-0.046241[/C][C]-0.2888[/C][C]0.387141[/C][/ROW]
[ROW][C]11[/C][C]0.021067[/C][C]0.1316[/C][C]0.448002[/C][/ROW]
[ROW][C]12[/C][C]-0.087489[/C][C]-0.5464[/C][C]0.293963[/C][/ROW]
[ROW][C]13[/C][C]-0.189242[/C][C]-1.1818[/C][C]0.122217[/C][/ROW]
[ROW][C]14[/C][C]0.089395[/C][C]0.5583[/C][C]0.289925[/C][/ROW]
[ROW][C]15[/C][C]0.120182[/C][C]0.7505[/C][C]0.228718[/C][/ROW]
[ROW][C]16[/C][C]-0.07775[/C][C]-0.4855[/C][C]0.315003[/C][/ROW]
[ROW][C]17[/C][C]-0.074969[/C][C]-0.4682[/C][C]0.32113[/C][/ROW]
[ROW][C]18[/C][C]0.042723[/C][C]0.2668[/C][C]0.395512[/C][/ROW]
[ROW][C]19[/C][C]0.070328[/C][C]0.4392[/C][C]0.33147[/C][/ROW]
[ROW][C]20[/C][C]-0.107138[/C][C]-0.6691[/C][C]0.253693[/C][/ROW]
[ROW][C]21[/C][C]0.057376[/C][C]0.3583[/C][C]0.361021[/C][/ROW]
[ROW][C]22[/C][C]0.123557[/C][C]0.7716[/C][C]0.222498[/C][/ROW]
[ROW][C]23[/C][C]-0.094499[/C][C]-0.5901[/C][C]0.279249[/C][/ROW]
[ROW][C]24[/C][C]-0.080971[/C][C]-0.5057[/C][C]0.307969[/C][/ROW]
[ROW][C]25[/C][C]-0.111776[/C][C]-0.698[/C][C]0.244646[/C][/ROW]
[ROW][C]26[/C][C]-0.072401[/C][C]-0.4521[/C][C]0.326835[/C][/ROW]
[ROW][C]27[/C][C]-0.041984[/C][C]-0.2622[/C][C]0.397278[/C][/ROW]
[ROW][C]28[/C][C]0.057915[/C][C]0.3617[/C][C]0.359773[/C][/ROW]
[ROW][C]29[/C][C]0.024383[/C][C]0.1523[/C][C]0.43988[/C][/ROW]
[ROW][C]30[/C][C]0.001996[/C][C]0.0125[/C][C]0.495059[/C][/ROW]
[ROW][C]31[/C][C]-0.060307[/C][C]-0.3766[/C][C]0.35425[/C][/ROW]
[ROW][C]32[/C][C]-0.111167[/C][C]-0.6942[/C][C]0.245824[/C][/ROW]
[ROW][C]33[/C][C]-0.017592[/C][C]-0.1099[/C][C]0.456542[/C][/ROW]
[ROW][C]34[/C][C]-0.014512[/C][C]-0.0906[/C][C]0.464127[/C][/ROW]
[ROW][C]35[/C][C]-0.013921[/C][C]-0.0869[/C][C]0.465582[/C][/ROW]
[ROW][C]36[/C][C]-0.070641[/C][C]-0.4412[/C][C]0.330769[/C][/ROW]
[/TABLE]
Source: https://freestatistics.org/blog/index.php?pk=302575&T=2

Globally Unique Identifier (entire table): ba.freestatistics.org/blog/index.php?pk=302575&T=2

As an alternative you can also use a QR Code:  

The GUIDs for individual cells are displayed in the table below:

Partial Autocorrelation Function
Time lag kPACF(k)T-STATP-value
1-0.165412-1.0330.153984
2-0.277342-1.7320.045588
30.066910.41790.339173
4-0.082893-0.51770.303808
5-0.195351-1.220.114902
60.1336420.83460.204515
7-0.061531-0.38430.351436
8-0.216351-1.35110.092223
9-0.163596-1.02170.156619
10-0.046241-0.28880.387141
110.0210670.13160.448002
12-0.087489-0.54640.293963
13-0.189242-1.18180.122217
140.0893950.55830.289925
150.1201820.75050.228718
16-0.07775-0.48550.315003
17-0.074969-0.46820.32113
180.0427230.26680.395512
190.0703280.43920.33147
20-0.107138-0.66910.253693
210.0573760.35830.361021
220.1235570.77160.222498
23-0.094499-0.59010.279249
24-0.080971-0.50570.307969
25-0.111776-0.6980.244646
26-0.072401-0.45210.326835
27-0.041984-0.26220.397278
280.0579150.36170.359773
290.0243830.15230.43988
300.0019960.01250.495059
31-0.060307-0.37660.35425
32-0.111167-0.69420.245824
33-0.017592-0.10990.456542
34-0.014512-0.09060.464127
35-0.013921-0.08690.465582
36-0.070641-0.44120.330769


Parameters (Session):
par1 = 36 ; par2 = 1 ; par3 = 0 ; par4 = 2 ; par5 = 6 ; par6 = White Noise ; par7 = 0.95 ;
Parameters (R input):
par1 = 36 ; par2 = 1 ; par3 = 1 ; par4 = 1 ; par5 = 4 ; par6 = White Noise ; par7 = 0.95 ; par8 = ;
R code (references can be found in the software module):
if (par1 == 'Default') {
par1 = 10*log10(length(x))
} else {
par1 <- as.numeric(par1)
}
par2 <- as.numeric(par2)
par3 <- as.numeric(par3)
par4 <- as.numeric(par4)
par5 <- as.numeric(par5)
if (par6 == 'White Noise') par6 <- 'white' else par6 <- 'ma'
par7 <- as.numeric(par7)
if (par8 != '') par8 <- as.numeric(par8)
x <- na.omit(x)
ox <- x
if (par8 == '') {
if (par2 == 0) {
x <- log(x)
} else {
x <- (x ^ par2 - 1) / par2
}
} else {
x <- log(x,base=par8)
}
if (par3 > 0) x <- diff(x,lag=1,difference=par3)
if (par4 > 0) x <- diff(x,lag=par5,difference=par4)
bitmap(file='picts.png')
op <- par(mfrow=c(2,1))
plot(ox,type='l',main='Original Time Series',xlab='time',ylab='value')
if (par8=='') {
mytitle <- paste('Working Time Series (lambda=',par2,', d=',par3,', D=',par4,')',sep='')
mysub <- paste('(lambda=',par2,', d=',par3,', D=',par4,', CI=', par7, ', CI type=',par6,')',sep='')
} else {
mytitle <- paste('Working Time Series (base=',par8,', d=',par3,', D=',par4,')',sep='')
mysub <- paste('(base=',par8,', d=',par3,', D=',par4,', CI=', par7, ', CI type=',par6,')',sep='')
}
plot(x,type='l', main=mytitle,xlab='time',ylab='value')
par(op)
dev.off()
bitmap(file='pic1.png')
racf <- acf(x, par1, main='Autocorrelation', xlab='time lag', ylab='ACF', ci.type=par6, ci=par7, sub=mysub)
dev.off()
bitmap(file='pic2.png')
rpacf <- pacf(x,par1,main='Partial Autocorrelation',xlab='lags',ylab='PACF',sub=mysub)
dev.off()
(myacf <- c(racf$acf))
(mypacf <- c(rpacf$acf))
lengthx <- length(x)
sqrtn <- sqrt(lengthx)
load(file='createtable')
a<-table.start()
a<-table.row.start(a)
a<-table.element(a,'Autocorrelation Function',4,TRUE)
a<-table.row.end(a)
a<-table.row.start(a)
a<-table.element(a,'Time lag k',header=TRUE)
a<-table.element(a,'ACF(k)',header=TRUE)
a<-table.element(a,'T-STAT',header=TRUE)
a<-table.element(a,'P-value',header=TRUE)
a<-table.row.end(a)
for (i in 2:(par1+1)) {
a<-table.row.start(a)
a<-table.element(a,i-1,header=TRUE)
a<-table.element(a,round(myacf[i],6))
mytstat <- myacf[i]*sqrtn
a<-table.element(a,round(mytstat,4))
a<-table.element(a,round(1-pt(abs(mytstat),lengthx),6))
a<-table.row.end(a)
}
a<-table.end(a)
table.save(a,file='mytable.tab')
a<-table.start()
a<-table.row.start(a)
a<-table.element(a,'Partial Autocorrelation Function',4,TRUE)
a<-table.row.end(a)
a<-table.row.start(a)
a<-table.element(a,'Time lag k',header=TRUE)
a<-table.element(a,'PACF(k)',header=TRUE)
a<-table.element(a,'T-STAT',header=TRUE)
a<-table.element(a,'P-value',header=TRUE)
a<-table.row.end(a)
for (i in 1:par1) {
a<-table.row.start(a)
a<-table.element(a,i,header=TRUE)
a<-table.element(a,round(mypacf[i],6))
mytstat <- mypacf[i]*sqrtn
a<-table.element(a,round(mytstat,4))
a<-table.element(a,round(1-pt(abs(mytstat),lengthx),6))
a<-table.row.end(a)
}
a<-table.end(a)
table.save(a,file='mytable1.tab')