Free Statistics

of Irreproducible Research!

Author's title

Author*The author of this computation has been verified*
R Software Modulerwasp_spectrum.wasp
Title produced by softwareSpectral Analysis
Date of computationThu, 22 Dec 2016 18:36:55 +0100
Cite this page as followsStatistical Computations at FreeStatistics.org, Office for Research Development and Education, URL https://freestatistics.org/blog/index.php?v=date/2016/Dec/22/t1482428253dm6nnvm9fqt6i6l.htm/, Retrieved Mon, 29 Apr 2024 06:39:35 +0000
Statistical Computations at FreeStatistics.org, Office for Research Development and Education, URL https://freestatistics.org/blog/index.php?pk=302593, Retrieved Mon, 29 Apr 2024 06:39:35 +0000
QR Codes:

Original text written by user:
IsPrivate?No (this computation is public)
User-defined keywords
Estimated Impact57
Family? (F = Feedback message, R = changed R code, M = changed R Module, P = changed Parameters, D = changed Data)
-       [Spectral Analysis] [f1 paper] [2016-12-22 17:36:55] [d92250bd36540c2281a4ec15b45df1dd] [Current]
Feedback Forum

Post a new message
Dataseries X:
4511.15
4497.61
4497.61
4524.68
4569.79
4596.85
4614.9
4632.94
4660.02
4714.15
4772.79
4817.9
4872.04
4926.17
4971.28
5020.9
5066.02
5088.57
5084.06
5066.02


Summary of computational transaction
Raw Input view raw input (R code)
Raw Outputview raw output of R engine
Computing time1 seconds
R ServerBig Analytics Cloud Computing Center

\begin{tabular}{lllllllll}
\hline
Summary of computational transaction \tabularnewline
Raw Input view raw input (R code)  \tabularnewline
Raw Outputview raw output of R engine  \tabularnewline
Computing time1 seconds \tabularnewline
R ServerBig Analytics Cloud Computing Center \tabularnewline
\hline
\end{tabular}
%Source: https://freestatistics.org/blog/index.php?pk=302593&T=0

[TABLE]
[ROW]
Summary of computational transaction[/C][/ROW] [ROW]Raw Input[/C] view raw input (R code) [/C][/ROW] [ROW]Raw Output[/C]view raw output of R engine [/C][/ROW] [ROW]Computing time[/C]1 seconds[/C][/ROW] [ROW]R Server[/C]Big Analytics Cloud Computing Center[/C][/ROW] [/TABLE] Source: https://freestatistics.org/blog/index.php?pk=302593&T=0

Globally Unique Identifier (entire table): ba.freestatistics.org/blog/index.php?pk=302593&T=0

As an alternative you can also use a QR Code:  

The GUIDs for individual cells are displayed in the table below:

Summary of computational transaction
Raw Input view raw input (R code)
Raw Outputview raw output of R engine
Computing time1 seconds
R ServerBig Analytics Cloud Computing Center


Raw Periodogram
ParameterValue
Box-Cox transformation parameter (lambda)1
Degree of non-seasonal differencing (d)0
Degree of seasonal differencing (D)1
Seasonal Period (s)12
Frequency (Period)Spectrum
0.125 (8)6280.528712
0.25 (4)455.020888
0.375 (2.6667)29.302972
0.5 (2)25.349682

\begin{tabular}{lllllllll}
\hline
Raw Periodogram \tabularnewline
Parameter & Value \tabularnewline
Box-Cox transformation parameter (lambda) & 1 \tabularnewline
Degree of non-seasonal differencing (d) & 0 \tabularnewline
Degree of seasonal differencing (D) & 1 \tabularnewline
Seasonal Period (s) & 12 \tabularnewline
Frequency (Period) & Spectrum \tabularnewline
0.125 (8) & 6280.528712 \tabularnewline
0.25 (4) & 455.020888 \tabularnewline
0.375 (2.6667) & 29.302972 \tabularnewline
0.5 (2) & 25.349682 \tabularnewline
\hline
\end{tabular}
%Source: https://freestatistics.org/blog/index.php?pk=302593&T=1

[TABLE]
[ROW][C]Raw Periodogram[/C][/ROW]
[ROW][C]Parameter[/C][C]Value[/C][/ROW]
[ROW][C]Box-Cox transformation parameter (lambda)[/C][C]1[/C][/ROW]
[ROW][C]Degree of non-seasonal differencing (d)[/C][C]0[/C][/ROW]
[ROW][C]Degree of seasonal differencing (D)[/C][C]1[/C][/ROW]
[ROW][C]Seasonal Period (s)[/C][C]12[/C][/ROW]
[ROW][C]Frequency (Period)[/C][C]Spectrum[/C][/ROW]
[ROW][C]0.125 (8)[/C][C]6280.528712[/C][/ROW]
[ROW][C]0.25 (4)[/C][C]455.020888[/C][/ROW]
[ROW][C]0.375 (2.6667)[/C][C]29.302972[/C][/ROW]
[ROW][C]0.5 (2)[/C][C]25.349682[/C][/ROW]
[/TABLE]
Source: https://freestatistics.org/blog/index.php?pk=302593&T=1

Globally Unique Identifier (entire table): ba.freestatistics.org/blog/index.php?pk=302593&T=1

As an alternative you can also use a QR Code:  

The GUIDs for individual cells are displayed in the table below:

Raw Periodogram
ParameterValue
Box-Cox transformation parameter (lambda)1
Degree of non-seasonal differencing (d)0
Degree of seasonal differencing (D)1
Seasonal Period (s)12
Frequency (Period)Spectrum
0.125 (8)6280.528712
0.25 (4)455.020888
0.375 (2.6667)29.302972
0.5 (2)25.349682


Parameters (Session):
par1 = 1 ; par2 = 0 ; par3 = 1 ; par4 = 12 ;
Parameters (R input):
par1 = 1 ; par2 = 0 ; par3 = 1 ; par4 = 12 ;
R code (references can be found in the software module):
par4 <- '12'
par3 <- '1'
par2 <- '0'
par1 <- '1'
par1 <- as.numeric(par1)
par2 <- as.numeric(par2)
par3 <- as.numeric(par3)
par4 <- as.numeric(par4)
if (par1 == 0) {
x <- log(x)
} else {
x <- (x ^ par1 - 1) / par1
}
if (par2 > 0) x <- diff(x,lag=1,difference=par2)
if (par3 > 0) x <- diff(x,lag=par4,difference=par3)
bitmap(file='test1.png')
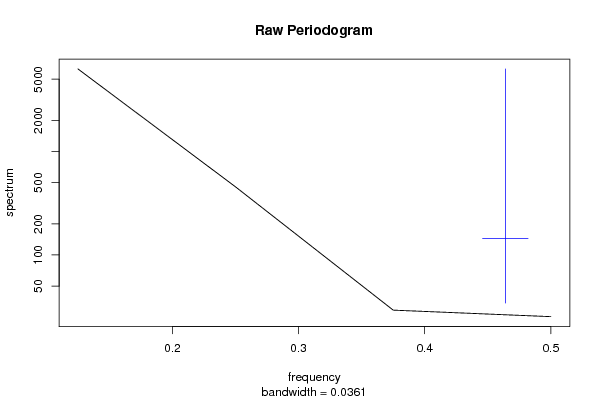
r <- spectrum(x,main='Raw Periodogram')
dev.off()
bitmap(file='test2.png')
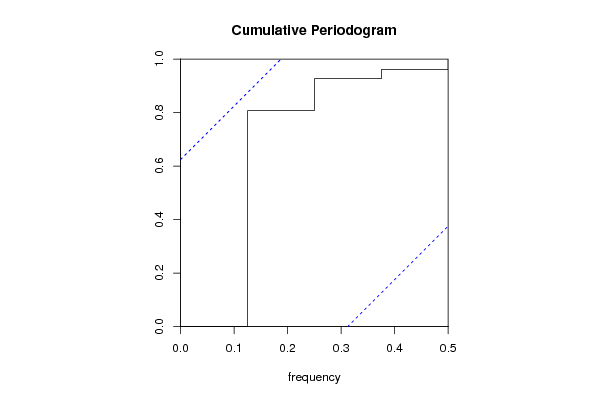
cpgram(x,main='Cumulative Periodogram')
dev.off()
load(file='createtable')
a<-table.start()
a<-table.row.start(a)
a<-table.element(a,'Raw Periodogram',2,TRUE)
a<-table.row.end(a)
a<-table.row.start(a)
a<-table.element(a,'Parameter',header=TRUE)
a<-table.element(a,'Value',header=TRUE)
a<-table.row.end(a)
a<-table.row.start(a)
a<-table.element(a,'Box-Cox transformation parameter (lambda)',header=TRUE)
a<-table.element(a,par1)
a<-table.row.end(a)
a<-table.row.start(a)
a<-table.element(a,'Degree of non-seasonal differencing (d)',header=TRUE)
a<-table.element(a,par2)
a<-table.row.end(a)
a<-table.row.start(a)
a<-table.element(a,'Degree of seasonal differencing (D)',header=TRUE)
a<-table.element(a,par3)
a<-table.row.end(a)
a<-table.row.start(a)
a<-table.element(a,'Seasonal Period (s)',header=TRUE)
a<-table.element(a,par4)
a<-table.row.end(a)
a<-table.row.start(a)
a<-table.element(a,'Frequency (Period)',header=TRUE)
a<-table.element(a,'Spectrum',header=TRUE)
a<-table.row.end(a)
for (i in 1:length(r$freq)) {
a<-table.row.start(a)
mylab <- round(r$freq[i],4)
mylab <- paste(mylab,' (',sep='')
mylab <- paste(mylab,round(1/r$freq[i],4),sep='')
mylab <- paste(mylab,')',sep='')
a<-table.element(a,mylab,header=TRUE)
a<-table.element(a,round(r$spec[i],6))
a<-table.row.end(a)
}
a<-table.end(a)
table.save(a,file='mytable.tab')