Free Statistics

of Irreproducible Research!

Author's title

Author*The author of this computation has been verified*
R Software Modulerwasp_autocorrelation.wasp
Title produced by software(Partial) Autocorrelation Function
Date of computationThu, 22 Dec 2016 18:53:07 +0100
Cite this page as followsStatistical Computations at FreeStatistics.org, Office for Research Development and Education, URL https://freestatistics.org/blog/index.php?v=date/2016/Dec/22/t1482429923vpvuhxekhnvzi6f.htm/, Retrieved Mon, 29 Apr 2024 04:02:46 +0000
Statistical Computations at FreeStatistics.org, Office for Research Development and Education, URL https://freestatistics.org/blog/index.php?pk=302604, Retrieved Mon, 29 Apr 2024 04:02:46 +0000
QR Codes:

Original text written by user:
IsPrivate?No (this computation is public)
User-defined keywords
Estimated Impact36
Family? (F = Feedback message, R = changed R code, M = changed R Module, P = changed Parameters, D = changed Data)
-       [(Partial) Autocorrelation Function] [Autocorrelation f...] [2016-12-22 17:53:07] [6c55ad42faec53ff18247bf53b5ba716] [Current]
Feedback Forum

Post a new message
Dataseries X:
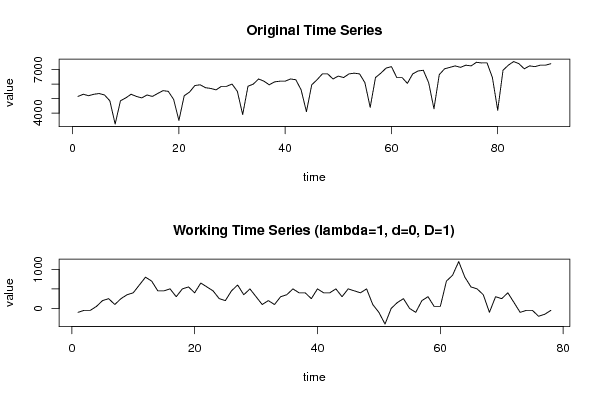
5150
5300
5200
5300
5350
5250
4850
3250
4850
5050
5300
5150
5050
5250
5150
5350
5550
5500
4950
3500
5200
5450
5900
5950
5750
5700
5600
5850
5850
6000
5500
3900
5850
6000
6350
6200
5950
6150
6200
6200
6350
6300
5600
4100
5950
6300
6700
6700
6350
6550
6450
6700
6750
6700
6100
4400
6450
6750
7100
7200
6450
6450
6050
6700
6900
6950
6100
4300
6650
7050
7150
7250
7150
7300
7250
7500
7450
7450
6450
4200
6950
7300
7550
7400
7050
7250
7200
7300
7300
7400


Summary of computational transaction
Raw Input view raw input (R code)
Raw Outputview raw output of R engine
Computing time1 seconds
R ServerBig Analytics Cloud Computing Center

\begin{tabular}{lllllllll}
\hline
Summary of computational transaction \tabularnewline
Raw Input view raw input (R code)  \tabularnewline
Raw Outputview raw output of R engine  \tabularnewline
Computing time1 seconds \tabularnewline
R ServerBig Analytics Cloud Computing Center \tabularnewline
\hline
\end{tabular}
%Source: https://freestatistics.org/blog/index.php?pk=302604&T=0

[TABLE]
[ROW]
Summary of computational transaction[/C][/ROW] [ROW]Raw Input[/C] view raw input (R code) [/C][/ROW] [ROW]Raw Output[/C]view raw output of R engine [/C][/ROW] [ROW]Computing time[/C]1 seconds[/C][/ROW] [ROW]R Server[/C]Big Analytics Cloud Computing Center[/C][/ROW] [/TABLE] Source: https://freestatistics.org/blog/index.php?pk=302604&T=0

Globally Unique Identifier (entire table): ba.freestatistics.org/blog/index.php?pk=302604&T=0

As an alternative you can also use a QR Code:  

The GUIDs for individual cells are displayed in the table below:

Summary of computational transaction
Raw Input view raw input (R code)
Raw Outputview raw output of R engine
Computing time1 seconds
R ServerBig Analytics Cloud Computing Center


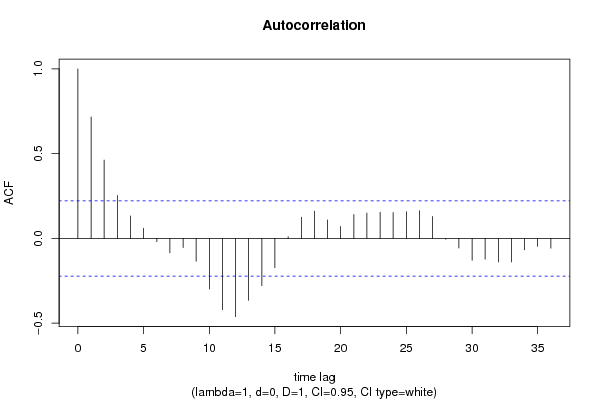
Autocorrelation Function
Time lag kACF(k)T-STATP-value
10.716046.32390
20.462254.08255.3e-05
30.2528722.23330.014197
40.1322821.16830.123125
50.0598540.52860.299286
6-0.018858-0.16650.434078
7-0.084175-0.74340.229733
8-0.053598-0.47340.318638
9-0.134034-1.18380.120052
10-0.298269-2.63420.005083
11-0.420169-3.71080.000193
12-0.461703-4.07765.4e-05
13-0.364993-3.22350.000925
14-0.278734-2.46170.008017
15-0.172813-1.52620.065497
160.0097260.08590.465885
170.1252941.10660.135942
180.1608391.42050.079725
190.108890.96170.169588
200.0703640.62140.268061
210.1402891.2390.10953
220.149491.32030.095305
230.1541251.36120.088686
240.1524861.34670.090985
250.157531.39130.08405
260.1629761.43940.077024
270.1290421.13970.128956
28-0.00453-0.040.484096
29-0.056457-0.49860.309728
30-0.128911-1.13850.129195
31-0.122209-1.07930.141886
32-0.138547-1.22360.11239
33-0.138542-1.22360.112399
34-0.067344-0.59480.276861
35-0.046402-0.40980.341532
36-0.057338-0.50640.307004

\begin{tabular}{lllllllll}
\hline
Autocorrelation Function \tabularnewline
Time lag k & ACF(k) & T-STAT & P-value \tabularnewline
1 & 0.71604 & 6.3239 & 0 \tabularnewline
2 & 0.46225 & 4.0825 & 5.3e-05 \tabularnewline
3 & 0.252872 & 2.2333 & 0.014197 \tabularnewline
4 & 0.132282 & 1.1683 & 0.123125 \tabularnewline
5 & 0.059854 & 0.5286 & 0.299286 \tabularnewline
6 & -0.018858 & -0.1665 & 0.434078 \tabularnewline
7 & -0.084175 & -0.7434 & 0.229733 \tabularnewline
8 & -0.053598 & -0.4734 & 0.318638 \tabularnewline
9 & -0.134034 & -1.1838 & 0.120052 \tabularnewline
10 & -0.298269 & -2.6342 & 0.005083 \tabularnewline
11 & -0.420169 & -3.7108 & 0.000193 \tabularnewline
12 & -0.461703 & -4.0776 & 5.4e-05 \tabularnewline
13 & -0.364993 & -3.2235 & 0.000925 \tabularnewline
14 & -0.278734 & -2.4617 & 0.008017 \tabularnewline
15 & -0.172813 & -1.5262 & 0.065497 \tabularnewline
16 & 0.009726 & 0.0859 & 0.465885 \tabularnewline
17 & 0.125294 & 1.1066 & 0.135942 \tabularnewline
18 & 0.160839 & 1.4205 & 0.079725 \tabularnewline
19 & 0.10889 & 0.9617 & 0.169588 \tabularnewline
20 & 0.070364 & 0.6214 & 0.268061 \tabularnewline
21 & 0.140289 & 1.239 & 0.10953 \tabularnewline
22 & 0.14949 & 1.3203 & 0.095305 \tabularnewline
23 & 0.154125 & 1.3612 & 0.088686 \tabularnewline
24 & 0.152486 & 1.3467 & 0.090985 \tabularnewline
25 & 0.15753 & 1.3913 & 0.08405 \tabularnewline
26 & 0.162976 & 1.4394 & 0.077024 \tabularnewline
27 & 0.129042 & 1.1397 & 0.128956 \tabularnewline
28 & -0.00453 & -0.04 & 0.484096 \tabularnewline
29 & -0.056457 & -0.4986 & 0.309728 \tabularnewline
30 & -0.128911 & -1.1385 & 0.129195 \tabularnewline
31 & -0.122209 & -1.0793 & 0.141886 \tabularnewline
32 & -0.138547 & -1.2236 & 0.11239 \tabularnewline
33 & -0.138542 & -1.2236 & 0.112399 \tabularnewline
34 & -0.067344 & -0.5948 & 0.276861 \tabularnewline
35 & -0.046402 & -0.4098 & 0.341532 \tabularnewline
36 & -0.057338 & -0.5064 & 0.307004 \tabularnewline
\hline
\end{tabular}
%Source: https://freestatistics.org/blog/index.php?pk=302604&T=1

[TABLE]
[ROW][C]Autocorrelation Function[/C][/ROW]
[ROW][C]Time lag k[/C][C]ACF(k)[/C][C]T-STAT[/C][C]P-value[/C][/ROW]
[ROW][C]1[/C][C]0.71604[/C][C]6.3239[/C][C]0[/C][/ROW]
[ROW][C]2[/C][C]0.46225[/C][C]4.0825[/C][C]5.3e-05[/C][/ROW]
[ROW][C]3[/C][C]0.252872[/C][C]2.2333[/C][C]0.014197[/C][/ROW]
[ROW][C]4[/C][C]0.132282[/C][C]1.1683[/C][C]0.123125[/C][/ROW]
[ROW][C]5[/C][C]0.059854[/C][C]0.5286[/C][C]0.299286[/C][/ROW]
[ROW][C]6[/C][C]-0.018858[/C][C]-0.1665[/C][C]0.434078[/C][/ROW]
[ROW][C]7[/C][C]-0.084175[/C][C]-0.7434[/C][C]0.229733[/C][/ROW]
[ROW][C]8[/C][C]-0.053598[/C][C]-0.4734[/C][C]0.318638[/C][/ROW]
[ROW][C]9[/C][C]-0.134034[/C][C]-1.1838[/C][C]0.120052[/C][/ROW]
[ROW][C]10[/C][C]-0.298269[/C][C]-2.6342[/C][C]0.005083[/C][/ROW]
[ROW][C]11[/C][C]-0.420169[/C][C]-3.7108[/C][C]0.000193[/C][/ROW]
[ROW][C]12[/C][C]-0.461703[/C][C]-4.0776[/C][C]5.4e-05[/C][/ROW]
[ROW][C]13[/C][C]-0.364993[/C][C]-3.2235[/C][C]0.000925[/C][/ROW]
[ROW][C]14[/C][C]-0.278734[/C][C]-2.4617[/C][C]0.008017[/C][/ROW]
[ROW][C]15[/C][C]-0.172813[/C][C]-1.5262[/C][C]0.065497[/C][/ROW]
[ROW][C]16[/C][C]0.009726[/C][C]0.0859[/C][C]0.465885[/C][/ROW]
[ROW][C]17[/C][C]0.125294[/C][C]1.1066[/C][C]0.135942[/C][/ROW]
[ROW][C]18[/C][C]0.160839[/C][C]1.4205[/C][C]0.079725[/C][/ROW]
[ROW][C]19[/C][C]0.10889[/C][C]0.9617[/C][C]0.169588[/C][/ROW]
[ROW][C]20[/C][C]0.070364[/C][C]0.6214[/C][C]0.268061[/C][/ROW]
[ROW][C]21[/C][C]0.140289[/C][C]1.239[/C][C]0.10953[/C][/ROW]
[ROW][C]22[/C][C]0.14949[/C][C]1.3203[/C][C]0.095305[/C][/ROW]
[ROW][C]23[/C][C]0.154125[/C][C]1.3612[/C][C]0.088686[/C][/ROW]
[ROW][C]24[/C][C]0.152486[/C][C]1.3467[/C][C]0.090985[/C][/ROW]
[ROW][C]25[/C][C]0.15753[/C][C]1.3913[/C][C]0.08405[/C][/ROW]
[ROW][C]26[/C][C]0.162976[/C][C]1.4394[/C][C]0.077024[/C][/ROW]
[ROW][C]27[/C][C]0.129042[/C][C]1.1397[/C][C]0.128956[/C][/ROW]
[ROW][C]28[/C][C]-0.00453[/C][C]-0.04[/C][C]0.484096[/C][/ROW]
[ROW][C]29[/C][C]-0.056457[/C][C]-0.4986[/C][C]0.309728[/C][/ROW]
[ROW][C]30[/C][C]-0.128911[/C][C]-1.1385[/C][C]0.129195[/C][/ROW]
[ROW][C]31[/C][C]-0.122209[/C][C]-1.0793[/C][C]0.141886[/C][/ROW]
[ROW][C]32[/C][C]-0.138547[/C][C]-1.2236[/C][C]0.11239[/C][/ROW]
[ROW][C]33[/C][C]-0.138542[/C][C]-1.2236[/C][C]0.112399[/C][/ROW]
[ROW][C]34[/C][C]-0.067344[/C][C]-0.5948[/C][C]0.276861[/C][/ROW]
[ROW][C]35[/C][C]-0.046402[/C][C]-0.4098[/C][C]0.341532[/C][/ROW]
[ROW][C]36[/C][C]-0.057338[/C][C]-0.5064[/C][C]0.307004[/C][/ROW]
[/TABLE]
Source: https://freestatistics.org/blog/index.php?pk=302604&T=1

Globally Unique Identifier (entire table): ba.freestatistics.org/blog/index.php?pk=302604&T=1

As an alternative you can also use a QR Code:  

The GUIDs for individual cells are displayed in the table below:

Autocorrelation Function
Time lag kACF(k)T-STATP-value
10.716046.32390
20.462254.08255.3e-05
30.2528722.23330.014197
40.1322821.16830.123125
50.0598540.52860.299286
6-0.018858-0.16650.434078
7-0.084175-0.74340.229733
8-0.053598-0.47340.318638
9-0.134034-1.18380.120052
10-0.298269-2.63420.005083
11-0.420169-3.71080.000193
12-0.461703-4.07765.4e-05
13-0.364993-3.22350.000925
14-0.278734-2.46170.008017
15-0.172813-1.52620.065497
160.0097260.08590.465885
170.1252941.10660.135942
180.1608391.42050.079725
190.108890.96170.169588
200.0703640.62140.268061
210.1402891.2390.10953
220.149491.32030.095305
230.1541251.36120.088686
240.1524861.34670.090985
250.157531.39130.08405
260.1629761.43940.077024
270.1290421.13970.128956
28-0.00453-0.040.484096
29-0.056457-0.49860.309728
30-0.128911-1.13850.129195
31-0.122209-1.07930.141886
32-0.138547-1.22360.11239
33-0.138542-1.22360.112399
34-0.067344-0.59480.276861
35-0.046402-0.40980.341532
36-0.057338-0.50640.307004


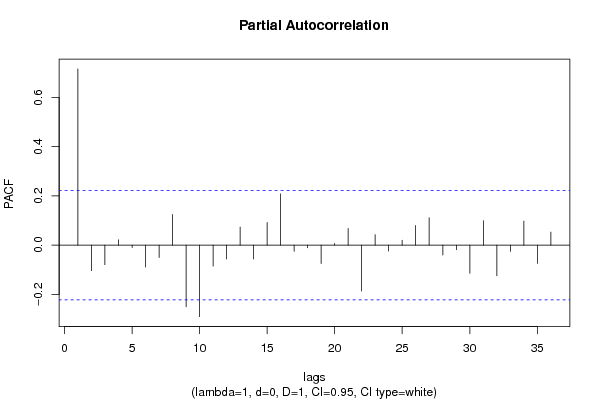
Partial Autocorrelation Function
Time lag kPACF(k)T-STATP-value
10.716046.32390
2-0.103562-0.91460.181602
3-0.079329-0.70060.242815
40.0213750.18880.425379
5-0.009619-0.0850.466257
6-0.088678-0.78320.217944
7-0.050122-0.44270.329618
80.1243361.09810.137768
9-0.250104-2.20890.01506
10-0.29056-2.56620.006099
11-0.08512-0.75180.227229
12-0.056259-0.49690.310341
130.0733980.64820.259368
14-0.056603-0.49990.309275
150.0923690.81580.208555
160.208421.84070.034733
17-0.025046-0.22120.412756
18-0.010371-0.09160.463626
19-0.074768-0.66030.255491
200.0068830.06080.47584
210.067580.59690.276167
22-0.186517-1.64730.051763
230.0426880.3770.353596
24-0.024065-0.21250.41612
250.019760.17450.430958
260.079630.70330.241991
270.1117310.98680.163402
28-0.039918-0.35250.362691
29-0.018737-0.16550.434498
30-0.113954-1.00640.158664
310.0992910.87690.191612
32-0.124102-1.0960.138218
33-0.025222-0.22280.412154
340.0975620.86160.195762
35-0.074235-0.65560.256997
360.052870.46690.320923

\begin{tabular}{lllllllll}
\hline
Partial Autocorrelation Function \tabularnewline
Time lag k & PACF(k) & T-STAT & P-value \tabularnewline
1 & 0.71604 & 6.3239 & 0 \tabularnewline
2 & -0.103562 & -0.9146 & 0.181602 \tabularnewline
3 & -0.079329 & -0.7006 & 0.242815 \tabularnewline
4 & 0.021375 & 0.1888 & 0.425379 \tabularnewline
5 & -0.009619 & -0.085 & 0.466257 \tabularnewline
6 & -0.088678 & -0.7832 & 0.217944 \tabularnewline
7 & -0.050122 & -0.4427 & 0.329618 \tabularnewline
8 & 0.124336 & 1.0981 & 0.137768 \tabularnewline
9 & -0.250104 & -2.2089 & 0.01506 \tabularnewline
10 & -0.29056 & -2.5662 & 0.006099 \tabularnewline
11 & -0.08512 & -0.7518 & 0.227229 \tabularnewline
12 & -0.056259 & -0.4969 & 0.310341 \tabularnewline
13 & 0.073398 & 0.6482 & 0.259368 \tabularnewline
14 & -0.056603 & -0.4999 & 0.309275 \tabularnewline
15 & 0.092369 & 0.8158 & 0.208555 \tabularnewline
16 & 0.20842 & 1.8407 & 0.034733 \tabularnewline
17 & -0.025046 & -0.2212 & 0.412756 \tabularnewline
18 & -0.010371 & -0.0916 & 0.463626 \tabularnewline
19 & -0.074768 & -0.6603 & 0.255491 \tabularnewline
20 & 0.006883 & 0.0608 & 0.47584 \tabularnewline
21 & 0.06758 & 0.5969 & 0.276167 \tabularnewline
22 & -0.186517 & -1.6473 & 0.051763 \tabularnewline
23 & 0.042688 & 0.377 & 0.353596 \tabularnewline
24 & -0.024065 & -0.2125 & 0.41612 \tabularnewline
25 & 0.01976 & 0.1745 & 0.430958 \tabularnewline
26 & 0.07963 & 0.7033 & 0.241991 \tabularnewline
27 & 0.111731 & 0.9868 & 0.163402 \tabularnewline
28 & -0.039918 & -0.3525 & 0.362691 \tabularnewline
29 & -0.018737 & -0.1655 & 0.434498 \tabularnewline
30 & -0.113954 & -1.0064 & 0.158664 \tabularnewline
31 & 0.099291 & 0.8769 & 0.191612 \tabularnewline
32 & -0.124102 & -1.096 & 0.138218 \tabularnewline
33 & -0.025222 & -0.2228 & 0.412154 \tabularnewline
34 & 0.097562 & 0.8616 & 0.195762 \tabularnewline
35 & -0.074235 & -0.6556 & 0.256997 \tabularnewline
36 & 0.05287 & 0.4669 & 0.320923 \tabularnewline
\hline
\end{tabular}
%Source: https://freestatistics.org/blog/index.php?pk=302604&T=2

[TABLE]
[ROW][C]Partial Autocorrelation Function[/C][/ROW]
[ROW][C]Time lag k[/C][C]PACF(k)[/C][C]T-STAT[/C][C]P-value[/C][/ROW]
[ROW][C]1[/C][C]0.71604[/C][C]6.3239[/C][C]0[/C][/ROW]
[ROW][C]2[/C][C]-0.103562[/C][C]-0.9146[/C][C]0.181602[/C][/ROW]
[ROW][C]3[/C][C]-0.079329[/C][C]-0.7006[/C][C]0.242815[/C][/ROW]
[ROW][C]4[/C][C]0.021375[/C][C]0.1888[/C][C]0.425379[/C][/ROW]
[ROW][C]5[/C][C]-0.009619[/C][C]-0.085[/C][C]0.466257[/C][/ROW]
[ROW][C]6[/C][C]-0.088678[/C][C]-0.7832[/C][C]0.217944[/C][/ROW]
[ROW][C]7[/C][C]-0.050122[/C][C]-0.4427[/C][C]0.329618[/C][/ROW]
[ROW][C]8[/C][C]0.124336[/C][C]1.0981[/C][C]0.137768[/C][/ROW]
[ROW][C]9[/C][C]-0.250104[/C][C]-2.2089[/C][C]0.01506[/C][/ROW]
[ROW][C]10[/C][C]-0.29056[/C][C]-2.5662[/C][C]0.006099[/C][/ROW]
[ROW][C]11[/C][C]-0.08512[/C][C]-0.7518[/C][C]0.227229[/C][/ROW]
[ROW][C]12[/C][C]-0.056259[/C][C]-0.4969[/C][C]0.310341[/C][/ROW]
[ROW][C]13[/C][C]0.073398[/C][C]0.6482[/C][C]0.259368[/C][/ROW]
[ROW][C]14[/C][C]-0.056603[/C][C]-0.4999[/C][C]0.309275[/C][/ROW]
[ROW][C]15[/C][C]0.092369[/C][C]0.8158[/C][C]0.208555[/C][/ROW]
[ROW][C]16[/C][C]0.20842[/C][C]1.8407[/C][C]0.034733[/C][/ROW]
[ROW][C]17[/C][C]-0.025046[/C][C]-0.2212[/C][C]0.412756[/C][/ROW]
[ROW][C]18[/C][C]-0.010371[/C][C]-0.0916[/C][C]0.463626[/C][/ROW]
[ROW][C]19[/C][C]-0.074768[/C][C]-0.6603[/C][C]0.255491[/C][/ROW]
[ROW][C]20[/C][C]0.006883[/C][C]0.0608[/C][C]0.47584[/C][/ROW]
[ROW][C]21[/C][C]0.06758[/C][C]0.5969[/C][C]0.276167[/C][/ROW]
[ROW][C]22[/C][C]-0.186517[/C][C]-1.6473[/C][C]0.051763[/C][/ROW]
[ROW][C]23[/C][C]0.042688[/C][C]0.377[/C][C]0.353596[/C][/ROW]
[ROW][C]24[/C][C]-0.024065[/C][C]-0.2125[/C][C]0.41612[/C][/ROW]
[ROW][C]25[/C][C]0.01976[/C][C]0.1745[/C][C]0.430958[/C][/ROW]
[ROW][C]26[/C][C]0.07963[/C][C]0.7033[/C][C]0.241991[/C][/ROW]
[ROW][C]27[/C][C]0.111731[/C][C]0.9868[/C][C]0.163402[/C][/ROW]
[ROW][C]28[/C][C]-0.039918[/C][C]-0.3525[/C][C]0.362691[/C][/ROW]
[ROW][C]29[/C][C]-0.018737[/C][C]-0.1655[/C][C]0.434498[/C][/ROW]
[ROW][C]30[/C][C]-0.113954[/C][C]-1.0064[/C][C]0.158664[/C][/ROW]
[ROW][C]31[/C][C]0.099291[/C][C]0.8769[/C][C]0.191612[/C][/ROW]
[ROW][C]32[/C][C]-0.124102[/C][C]-1.096[/C][C]0.138218[/C][/ROW]
[ROW][C]33[/C][C]-0.025222[/C][C]-0.2228[/C][C]0.412154[/C][/ROW]
[ROW][C]34[/C][C]0.097562[/C][C]0.8616[/C][C]0.195762[/C][/ROW]
[ROW][C]35[/C][C]-0.074235[/C][C]-0.6556[/C][C]0.256997[/C][/ROW]
[ROW][C]36[/C][C]0.05287[/C][C]0.4669[/C][C]0.320923[/C][/ROW]
[/TABLE]
Source: https://freestatistics.org/blog/index.php?pk=302604&T=2

Globally Unique Identifier (entire table): ba.freestatistics.org/blog/index.php?pk=302604&T=2

As an alternative you can also use a QR Code:  

The GUIDs for individual cells are displayed in the table below:

Partial Autocorrelation Function
Time lag kPACF(k)T-STATP-value
10.716046.32390
2-0.103562-0.91460.181602
3-0.079329-0.70060.242815
40.0213750.18880.425379
5-0.009619-0.0850.466257
6-0.088678-0.78320.217944
7-0.050122-0.44270.329618
80.1243361.09810.137768
9-0.250104-2.20890.01506
10-0.29056-2.56620.006099
11-0.08512-0.75180.227229
12-0.056259-0.49690.310341
130.0733980.64820.259368
14-0.056603-0.49990.309275
150.0923690.81580.208555
160.208421.84070.034733
17-0.025046-0.22120.412756
18-0.010371-0.09160.463626
19-0.074768-0.66030.255491
200.0068830.06080.47584
210.067580.59690.276167
22-0.186517-1.64730.051763
230.0426880.3770.353596
24-0.024065-0.21250.41612
250.019760.17450.430958
260.079630.70330.241991
270.1117310.98680.163402
28-0.039918-0.35250.362691
29-0.018737-0.16550.434498
30-0.113954-1.00640.158664
310.0992910.87690.191612
32-0.124102-1.0960.138218
33-0.025222-0.22280.412154
340.0975620.86160.195762
35-0.074235-0.65560.256997
360.052870.46690.320923


Parameters (Session):
par1 = 36 ; par2 = 1 ; par3 = 0 ; par4 = 1 ; par5 = 12 ; par6 = White Noise ; par7 = 0.95 ;
Parameters (R input):
par1 = 36 ; par2 = 1 ; par3 = 0 ; par4 = 1 ; par5 = 12 ; par6 = White Noise ; par7 = 0.95 ; par8 = ;
R code (references can be found in the software module):
par8 <- ''
par7 <- '0.95'
par6 <- 'White Noise'
par5 <- '1'
par4 <- '0'
par3 <- '0'
par2 <- '1'
par1 <- '36'
if (par1 == 'Default') {
par1 = 10*log10(length(x))
} else {
par1 <- as.numeric(par1)
}
par2 <- as.numeric(par2)
par3 <- as.numeric(par3)
par4 <- as.numeric(par4)
par5 <- as.numeric(par5)
if (par6 == 'White Noise') par6 <- 'white' else par6 <- 'ma'
par7 <- as.numeric(par7)
if (par8 != '') par8 <- as.numeric(par8)
x <- na.omit(x)
ox <- x
if (par8 == '') {
if (par2 == 0) {
x <- log(x)
} else {
x <- (x ^ par2 - 1) / par2
}
} else {
x <- log(x,base=par8)
}
if (par3 > 0) x <- diff(x,lag=1,difference=par3)
if (par4 > 0) x <- diff(x,lag=par5,difference=par4)
bitmap(file='picts.png')
op <- par(mfrow=c(2,1))
plot(ox,type='l',main='Original Time Series',xlab='time',ylab='value')
if (par8=='') {
mytitle <- paste('Working Time Series (lambda=',par2,', d=',par3,', D=',par4,')',sep='')
mysub <- paste('(lambda=',par2,', d=',par3,', D=',par4,', CI=', par7, ', CI type=',par6,')',sep='')
} else {
mytitle <- paste('Working Time Series (base=',par8,', d=',par3,', D=',par4,')',sep='')
mysub <- paste('(base=',par8,', d=',par3,', D=',par4,', CI=', par7, ', CI type=',par6,')',sep='')
}
plot(x,type='l', main=mytitle,xlab='time',ylab='value')
par(op)
dev.off()
bitmap(file='pic1.png')
racf <- acf(x, par1, main='Autocorrelation', xlab='time lag', ylab='ACF', ci.type=par6, ci=par7, sub=mysub)
dev.off()
bitmap(file='pic2.png')
rpacf <- pacf(x,par1,main='Partial Autocorrelation',xlab='lags',ylab='PACF',sub=mysub)
dev.off()
(myacf <- c(racf$acf))
(mypacf <- c(rpacf$acf))
lengthx <- length(x)
sqrtn <- sqrt(lengthx)
load(file='createtable')
a<-table.start()
a<-table.row.start(a)
a<-table.element(a,'Autocorrelation Function',4,TRUE)
a<-table.row.end(a)
a<-table.row.start(a)
a<-table.element(a,'Time lag k',header=TRUE)
a<-table.element(a,'ACF(k)',header=TRUE)
a<-table.element(a,'T-STAT',header=TRUE)
a<-table.element(a,'P-value',header=TRUE)
a<-table.row.end(a)
for (i in 2:(par1+1)) {
a<-table.row.start(a)
a<-table.element(a,i-1,header=TRUE)
a<-table.element(a,round(myacf[i],6))
mytstat <- myacf[i]*sqrtn
a<-table.element(a,round(mytstat,4))
a<-table.element(a,round(1-pt(abs(mytstat),lengthx),6))
a<-table.row.end(a)
}
a<-table.end(a)
table.save(a,file='mytable.tab')
a<-table.start()
a<-table.row.start(a)
a<-table.element(a,'Partial Autocorrelation Function',4,TRUE)
a<-table.row.end(a)
a<-table.row.start(a)
a<-table.element(a,'Time lag k',header=TRUE)
a<-table.element(a,'PACF(k)',header=TRUE)
a<-table.element(a,'T-STAT',header=TRUE)
a<-table.element(a,'P-value',header=TRUE)
a<-table.row.end(a)
for (i in 1:par1) {
a<-table.row.start(a)
a<-table.element(a,i,header=TRUE)
a<-table.element(a,round(mypacf[i],6))
mytstat <- mypacf[i]*sqrtn
a<-table.element(a,round(mytstat,4))
a<-table.element(a,round(1-pt(abs(mytstat),lengthx),6))
a<-table.row.end(a)
}
a<-table.end(a)
table.save(a,file='mytable1.tab')