Free Statistics

of Irreproducible Research!

Author's title

Author*The author of this computation has been verified*
R Software Modulerwasp_decompose.wasp
Title produced by softwareClassical Decomposition
Date of computationThu, 22 Dec 2016 19:29:06 +0100
Cite this page as followsStatistical Computations at FreeStatistics.org, Office for Research Development and Education, URL https://freestatistics.org/blog/index.php?v=date/2016/Dec/22/t14824313682y3xkng31c6qg6u.htm/, Retrieved Sun, 28 Apr 2024 23:55:20 +0000
Statistical Computations at FreeStatistics.org, Office for Research Development and Education, URL https://freestatistics.org/blog/index.php?pk=302613, Retrieved Sun, 28 Apr 2024 23:55:20 +0000
QR Codes:

Original text written by user:
IsPrivate?No (this computation is public)
User-defined keywords
Estimated Impact88
Family? (F = Feedback message, R = changed R code, M = changed R Module, P = changed Parameters, D = changed Data)
-     [Kendall tau Correlation Matrix] [Correlation matrices] [2016-12-21 16:26:17] [b011e1d1c3fc908d73f0b66878a70c1c]
- RMPD    [Classical Decomposition] [Classical decompo...] [2016-12-22 18:29:06] [0fd57913e31aa45e4c342a705351a504] [Current]
Feedback Forum

Post a new message
Dataseries X:
3233.7
3097.3
3216.8
3729.6
3447.7
3384.3
3494.7
3904.2
3605.2
3674.6
3751.1
4039.5
3885.9
3906.1
3965
4411.6
4325.1
4349.2
4426.1
4915
4506.9
4497.4
4546.5
5122
4471.3
4560.6
4581.6
5186.2
4719.8
4784.1
4778.6
5494.8
4966.8
5188.2
5135.4
5690.4
5293.5
5673.8
5568.9
6094.2
5712.7
5858.7
5814.6
6616.6


Summary of computational transaction
Raw Input view raw input (R code)
Raw Outputview raw output of R engine
Computing time2 seconds
R ServerBig Analytics Cloud Computing Center

\begin{tabular}{lllllllll}
\hline
Summary of computational transaction \tabularnewline
Raw Input view raw input (R code)  \tabularnewline
Raw Outputview raw output of R engine  \tabularnewline
Computing time2 seconds \tabularnewline
R ServerBig Analytics Cloud Computing Center \tabularnewline
\hline
\end{tabular}
%Source: https://freestatistics.org/blog/index.php?pk=302613&T=0

[TABLE]
[ROW]
Summary of computational transaction[/C][/ROW] [ROW]Raw Input[/C] view raw input (R code) [/C][/ROW] [ROW]Raw Output[/C]view raw output of R engine [/C][/ROW] [ROW]Computing time[/C]2 seconds[/C][/ROW] [ROW]R Server[/C]Big Analytics Cloud Computing Center[/C][/ROW] [/TABLE] Source: https://freestatistics.org/blog/index.php?pk=302613&T=0

Globally Unique Identifier (entire table): ba.freestatistics.org/blog/index.php?pk=302613&T=0

As an alternative you can also use a QR Code:  

The GUIDs for individual cells are displayed in the table below:

Summary of computational transaction
Raw Input view raw input (R code)
Raw Outputview raw output of R engine
Computing time2 seconds
R ServerBig Analytics Cloud Computing Center


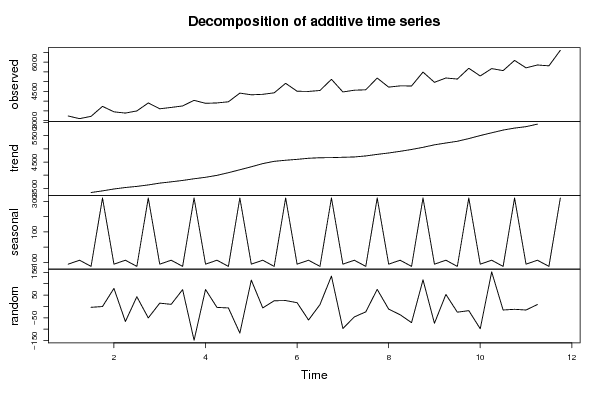
Classical Decomposition by Moving Averages
tObservationsFitTrendSeasonalRandom
13233.7NANA-110.844NA
23097.3NANA-85.1937NA
33216.83220.733346.1-125.369-3.93125
43729.63730.133408.72321.406-0.53125
53447.73368.493479.34-110.84479.2063
63384.33450.713535.9-85.1937-66.4062
73494.73452.043577.41-125.36942.6562
83904.23954.793633.39321.406-50.5938
93605.23590.883701.72-110.84414.3187
103674.63665.493750.69-85.19379.10625
113751.13677.323802.69-125.36973.7812
124039.54188.123866.71321.406-148.619
133885.93811.543922.39-110.84474.3563
143906.13910.443995.64-85.1937-4.34375
1539653971.684097.05-125.369-6.68125
164411.64528.744207.34321.406-117.144
174325.14209.524320.36-110.844115.581
184349.24355.734440.92-85.1937-6.53125
194426.14401.214526.58-125.36924.8938
2049154889.234567.82321.40625.7688
214506.94490.564601.4-110.84416.3438
224497.44557.134642.32-85.1937-59.7312
234546.54538.384663.75-125.3698.11875
2451224988.614667.2321.406133.394
254471.34568.644679.49-110.844-97.3438
264560.64606.714691.9-85.1937-46.1062
274581.64605.624730.99-125.369-24.0188
285186.25111.394789.99321.40674.8062
294719.84731.714842.55-110.844-11.9062
304784.14820.564905.75-85.1937-36.4562
314778.64849.834975.2-125.369-71.2313
325494.85377.995056.59321.406116.806
334966.85040.865151.7-110.844-74.0562
345188.25135.565220.75-85.193752.6438
355135.45160.675286.04-125.369-25.2688
365690.45708.985387.57321.406-18.5812
375293.55391.625502.46-110.844-98.1188
385673.85521.935607.12-85.1937151.869
395568.95584.635710-125.369-15.7313
406094.26106.925785.51321.406-12.7188
415712.75728.495839.34-110.844-15.7938
425858.75850.165935.35-85.19378.54375
435814.6NANA-125.369NA
446616.6NANA321.406NA

\begin{tabular}{lllllllll}
\hline
Classical Decomposition by Moving Averages \tabularnewline
t & Observations & Fit & Trend & Seasonal & Random \tabularnewline
1 & 3233.7 & NA & NA & -110.844 & NA \tabularnewline
2 & 3097.3 & NA & NA & -85.1937 & NA \tabularnewline
3 & 3216.8 & 3220.73 & 3346.1 & -125.369 & -3.93125 \tabularnewline
4 & 3729.6 & 3730.13 & 3408.72 & 321.406 & -0.53125 \tabularnewline
5 & 3447.7 & 3368.49 & 3479.34 & -110.844 & 79.2063 \tabularnewline
6 & 3384.3 & 3450.71 & 3535.9 & -85.1937 & -66.4062 \tabularnewline
7 & 3494.7 & 3452.04 & 3577.41 & -125.369 & 42.6562 \tabularnewline
8 & 3904.2 & 3954.79 & 3633.39 & 321.406 & -50.5938 \tabularnewline
9 & 3605.2 & 3590.88 & 3701.72 & -110.844 & 14.3187 \tabularnewline
10 & 3674.6 & 3665.49 & 3750.69 & -85.1937 & 9.10625 \tabularnewline
11 & 3751.1 & 3677.32 & 3802.69 & -125.369 & 73.7812 \tabularnewline
12 & 4039.5 & 4188.12 & 3866.71 & 321.406 & -148.619 \tabularnewline
13 & 3885.9 & 3811.54 & 3922.39 & -110.844 & 74.3563 \tabularnewline
14 & 3906.1 & 3910.44 & 3995.64 & -85.1937 & -4.34375 \tabularnewline
15 & 3965 & 3971.68 & 4097.05 & -125.369 & -6.68125 \tabularnewline
16 & 4411.6 & 4528.74 & 4207.34 & 321.406 & -117.144 \tabularnewline
17 & 4325.1 & 4209.52 & 4320.36 & -110.844 & 115.581 \tabularnewline
18 & 4349.2 & 4355.73 & 4440.92 & -85.1937 & -6.53125 \tabularnewline
19 & 4426.1 & 4401.21 & 4526.58 & -125.369 & 24.8938 \tabularnewline
20 & 4915 & 4889.23 & 4567.82 & 321.406 & 25.7688 \tabularnewline
21 & 4506.9 & 4490.56 & 4601.4 & -110.844 & 16.3438 \tabularnewline
22 & 4497.4 & 4557.13 & 4642.32 & -85.1937 & -59.7312 \tabularnewline
23 & 4546.5 & 4538.38 & 4663.75 & -125.369 & 8.11875 \tabularnewline
24 & 5122 & 4988.61 & 4667.2 & 321.406 & 133.394 \tabularnewline
25 & 4471.3 & 4568.64 & 4679.49 & -110.844 & -97.3438 \tabularnewline
26 & 4560.6 & 4606.71 & 4691.9 & -85.1937 & -46.1062 \tabularnewline
27 & 4581.6 & 4605.62 & 4730.99 & -125.369 & -24.0188 \tabularnewline
28 & 5186.2 & 5111.39 & 4789.99 & 321.406 & 74.8062 \tabularnewline
29 & 4719.8 & 4731.71 & 4842.55 & -110.844 & -11.9062 \tabularnewline
30 & 4784.1 & 4820.56 & 4905.75 & -85.1937 & -36.4562 \tabularnewline
31 & 4778.6 & 4849.83 & 4975.2 & -125.369 & -71.2313 \tabularnewline
32 & 5494.8 & 5377.99 & 5056.59 & 321.406 & 116.806 \tabularnewline
33 & 4966.8 & 5040.86 & 5151.7 & -110.844 & -74.0562 \tabularnewline
34 & 5188.2 & 5135.56 & 5220.75 & -85.1937 & 52.6438 \tabularnewline
35 & 5135.4 & 5160.67 & 5286.04 & -125.369 & -25.2688 \tabularnewline
36 & 5690.4 & 5708.98 & 5387.57 & 321.406 & -18.5812 \tabularnewline
37 & 5293.5 & 5391.62 & 5502.46 & -110.844 & -98.1188 \tabularnewline
38 & 5673.8 & 5521.93 & 5607.12 & -85.1937 & 151.869 \tabularnewline
39 & 5568.9 & 5584.63 & 5710 & -125.369 & -15.7313 \tabularnewline
40 & 6094.2 & 6106.92 & 5785.51 & 321.406 & -12.7188 \tabularnewline
41 & 5712.7 & 5728.49 & 5839.34 & -110.844 & -15.7938 \tabularnewline
42 & 5858.7 & 5850.16 & 5935.35 & -85.1937 & 8.54375 \tabularnewline
43 & 5814.6 & NA & NA & -125.369 & NA \tabularnewline
44 & 6616.6 & NA & NA & 321.406 & NA \tabularnewline
\hline
\end{tabular}
%Source: https://freestatistics.org/blog/index.php?pk=302613&T=1

[TABLE]
[ROW][C]Classical Decomposition by Moving Averages[/C][/ROW]
[ROW][C]t[/C][C]Observations[/C][C]Fit[/C][C]Trend[/C][C]Seasonal[/C][C]Random[/C][/ROW]
[ROW][C]1[/C][C]3233.7[/C][C]NA[/C][C]NA[/C][C]-110.844[/C][C]NA[/C][/ROW]
[ROW][C]2[/C][C]3097.3[/C][C]NA[/C][C]NA[/C][C]-85.1937[/C][C]NA[/C][/ROW]
[ROW][C]3[/C][C]3216.8[/C][C]3220.73[/C][C]3346.1[/C][C]-125.369[/C][C]-3.93125[/C][/ROW]
[ROW][C]4[/C][C]3729.6[/C][C]3730.13[/C][C]3408.72[/C][C]321.406[/C][C]-0.53125[/C][/ROW]
[ROW][C]5[/C][C]3447.7[/C][C]3368.49[/C][C]3479.34[/C][C]-110.844[/C][C]79.2063[/C][/ROW]
[ROW][C]6[/C][C]3384.3[/C][C]3450.71[/C][C]3535.9[/C][C]-85.1937[/C][C]-66.4062[/C][/ROW]
[ROW][C]7[/C][C]3494.7[/C][C]3452.04[/C][C]3577.41[/C][C]-125.369[/C][C]42.6562[/C][/ROW]
[ROW][C]8[/C][C]3904.2[/C][C]3954.79[/C][C]3633.39[/C][C]321.406[/C][C]-50.5938[/C][/ROW]
[ROW][C]9[/C][C]3605.2[/C][C]3590.88[/C][C]3701.72[/C][C]-110.844[/C][C]14.3187[/C][/ROW]
[ROW][C]10[/C][C]3674.6[/C][C]3665.49[/C][C]3750.69[/C][C]-85.1937[/C][C]9.10625[/C][/ROW]
[ROW][C]11[/C][C]3751.1[/C][C]3677.32[/C][C]3802.69[/C][C]-125.369[/C][C]73.7812[/C][/ROW]
[ROW][C]12[/C][C]4039.5[/C][C]4188.12[/C][C]3866.71[/C][C]321.406[/C][C]-148.619[/C][/ROW]
[ROW][C]13[/C][C]3885.9[/C][C]3811.54[/C][C]3922.39[/C][C]-110.844[/C][C]74.3563[/C][/ROW]
[ROW][C]14[/C][C]3906.1[/C][C]3910.44[/C][C]3995.64[/C][C]-85.1937[/C][C]-4.34375[/C][/ROW]
[ROW][C]15[/C][C]3965[/C][C]3971.68[/C][C]4097.05[/C][C]-125.369[/C][C]-6.68125[/C][/ROW]
[ROW][C]16[/C][C]4411.6[/C][C]4528.74[/C][C]4207.34[/C][C]321.406[/C][C]-117.144[/C][/ROW]
[ROW][C]17[/C][C]4325.1[/C][C]4209.52[/C][C]4320.36[/C][C]-110.844[/C][C]115.581[/C][/ROW]
[ROW][C]18[/C][C]4349.2[/C][C]4355.73[/C][C]4440.92[/C][C]-85.1937[/C][C]-6.53125[/C][/ROW]
[ROW][C]19[/C][C]4426.1[/C][C]4401.21[/C][C]4526.58[/C][C]-125.369[/C][C]24.8938[/C][/ROW]
[ROW][C]20[/C][C]4915[/C][C]4889.23[/C][C]4567.82[/C][C]321.406[/C][C]25.7688[/C][/ROW]
[ROW][C]21[/C][C]4506.9[/C][C]4490.56[/C][C]4601.4[/C][C]-110.844[/C][C]16.3438[/C][/ROW]
[ROW][C]22[/C][C]4497.4[/C][C]4557.13[/C][C]4642.32[/C][C]-85.1937[/C][C]-59.7312[/C][/ROW]
[ROW][C]23[/C][C]4546.5[/C][C]4538.38[/C][C]4663.75[/C][C]-125.369[/C][C]8.11875[/C][/ROW]
[ROW][C]24[/C][C]5122[/C][C]4988.61[/C][C]4667.2[/C][C]321.406[/C][C]133.394[/C][/ROW]
[ROW][C]25[/C][C]4471.3[/C][C]4568.64[/C][C]4679.49[/C][C]-110.844[/C][C]-97.3438[/C][/ROW]
[ROW][C]26[/C][C]4560.6[/C][C]4606.71[/C][C]4691.9[/C][C]-85.1937[/C][C]-46.1062[/C][/ROW]
[ROW][C]27[/C][C]4581.6[/C][C]4605.62[/C][C]4730.99[/C][C]-125.369[/C][C]-24.0188[/C][/ROW]
[ROW][C]28[/C][C]5186.2[/C][C]5111.39[/C][C]4789.99[/C][C]321.406[/C][C]74.8062[/C][/ROW]
[ROW][C]29[/C][C]4719.8[/C][C]4731.71[/C][C]4842.55[/C][C]-110.844[/C][C]-11.9062[/C][/ROW]
[ROW][C]30[/C][C]4784.1[/C][C]4820.56[/C][C]4905.75[/C][C]-85.1937[/C][C]-36.4562[/C][/ROW]
[ROW][C]31[/C][C]4778.6[/C][C]4849.83[/C][C]4975.2[/C][C]-125.369[/C][C]-71.2313[/C][/ROW]
[ROW][C]32[/C][C]5494.8[/C][C]5377.99[/C][C]5056.59[/C][C]321.406[/C][C]116.806[/C][/ROW]
[ROW][C]33[/C][C]4966.8[/C][C]5040.86[/C][C]5151.7[/C][C]-110.844[/C][C]-74.0562[/C][/ROW]
[ROW][C]34[/C][C]5188.2[/C][C]5135.56[/C][C]5220.75[/C][C]-85.1937[/C][C]52.6438[/C][/ROW]
[ROW][C]35[/C][C]5135.4[/C][C]5160.67[/C][C]5286.04[/C][C]-125.369[/C][C]-25.2688[/C][/ROW]
[ROW][C]36[/C][C]5690.4[/C][C]5708.98[/C][C]5387.57[/C][C]321.406[/C][C]-18.5812[/C][/ROW]
[ROW][C]37[/C][C]5293.5[/C][C]5391.62[/C][C]5502.46[/C][C]-110.844[/C][C]-98.1188[/C][/ROW]
[ROW][C]38[/C][C]5673.8[/C][C]5521.93[/C][C]5607.12[/C][C]-85.1937[/C][C]151.869[/C][/ROW]
[ROW][C]39[/C][C]5568.9[/C][C]5584.63[/C][C]5710[/C][C]-125.369[/C][C]-15.7313[/C][/ROW]
[ROW][C]40[/C][C]6094.2[/C][C]6106.92[/C][C]5785.51[/C][C]321.406[/C][C]-12.7188[/C][/ROW]
[ROW][C]41[/C][C]5712.7[/C][C]5728.49[/C][C]5839.34[/C][C]-110.844[/C][C]-15.7938[/C][/ROW]
[ROW][C]42[/C][C]5858.7[/C][C]5850.16[/C][C]5935.35[/C][C]-85.1937[/C][C]8.54375[/C][/ROW]
[ROW][C]43[/C][C]5814.6[/C][C]NA[/C][C]NA[/C][C]-125.369[/C][C]NA[/C][/ROW]
[ROW][C]44[/C][C]6616.6[/C][C]NA[/C][C]NA[/C][C]321.406[/C][C]NA[/C][/ROW]
[/TABLE]
Source: https://freestatistics.org/blog/index.php?pk=302613&T=1

Globally Unique Identifier (entire table): ba.freestatistics.org/blog/index.php?pk=302613&T=1

As an alternative you can also use a QR Code:  

The GUIDs for individual cells are displayed in the table below:

Classical Decomposition by Moving Averages
tObservationsFitTrendSeasonalRandom
13233.7NANA-110.844NA
23097.3NANA-85.1937NA
33216.83220.733346.1-125.369-3.93125
43729.63730.133408.72321.406-0.53125
53447.73368.493479.34-110.84479.2063
63384.33450.713535.9-85.1937-66.4062
73494.73452.043577.41-125.36942.6562
83904.23954.793633.39321.406-50.5938
93605.23590.883701.72-110.84414.3187
103674.63665.493750.69-85.19379.10625
113751.13677.323802.69-125.36973.7812
124039.54188.123866.71321.406-148.619
133885.93811.543922.39-110.84474.3563
143906.13910.443995.64-85.1937-4.34375
1539653971.684097.05-125.369-6.68125
164411.64528.744207.34321.406-117.144
174325.14209.524320.36-110.844115.581
184349.24355.734440.92-85.1937-6.53125
194426.14401.214526.58-125.36924.8938
2049154889.234567.82321.40625.7688
214506.94490.564601.4-110.84416.3438
224497.44557.134642.32-85.1937-59.7312
234546.54538.384663.75-125.3698.11875
2451224988.614667.2321.406133.394
254471.34568.644679.49-110.844-97.3438
264560.64606.714691.9-85.1937-46.1062
274581.64605.624730.99-125.369-24.0188
285186.25111.394789.99321.40674.8062
294719.84731.714842.55-110.844-11.9062
304784.14820.564905.75-85.1937-36.4562
314778.64849.834975.2-125.369-71.2313
325494.85377.995056.59321.406116.806
334966.85040.865151.7-110.844-74.0562
345188.25135.565220.75-85.193752.6438
355135.45160.675286.04-125.369-25.2688
365690.45708.985387.57321.406-18.5812
375293.55391.625502.46-110.844-98.1188
385673.85521.935607.12-85.1937151.869
395568.95584.635710-125.369-15.7313
406094.26106.925785.51321.406-12.7188
415712.75728.495839.34-110.844-15.7938
425858.75850.165935.35-85.19378.54375
435814.6NANA-125.369NA
446616.6NANA321.406NA


Parameters (Session):
par4 = 12 ;
Parameters (R input):
par1 = additive ; par2 = 4 ;
R code (references can be found in the software module):
par2 <- as.numeric(par2)
x <- ts(x,freq=par2)
m <- decompose(x,type=par1)
m$figure
bitmap(file='test1.png')
plot(m)
dev.off()
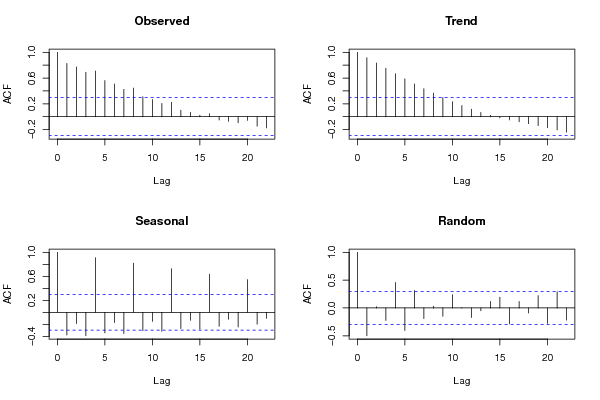
mylagmax <- length(x)/2
bitmap(file='test2.png')
op <- par(mfrow = c(2,2))
acf(as.numeric(x),lag.max = mylagmax,main='Observed')
acf(as.numeric(m$trend),na.action=na.pass,lag.max = mylagmax,main='Trend')
acf(as.numeric(m$seasonal),na.action=na.pass,lag.max = mylagmax,main='Seasonal')
acf(as.numeric(m$random),na.action=na.pass,lag.max = mylagmax,main='Random')
par(op)
dev.off()
bitmap(file='test3.png')
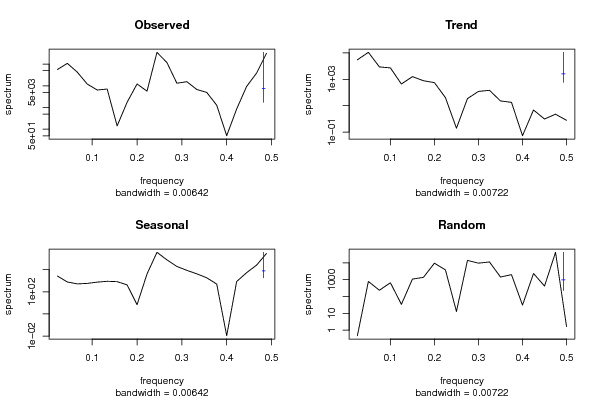
op <- par(mfrow = c(2,2))
spectrum(as.numeric(x),main='Observed')
spectrum(as.numeric(m$trend[!is.na(m$trend)]),main='Trend')
spectrum(as.numeric(m$seasonal[!is.na(m$seasonal)]),main='Seasonal')
spectrum(as.numeric(m$random[!is.na(m$random)]),main='Random')
par(op)
dev.off()
bitmap(file='test4.png')
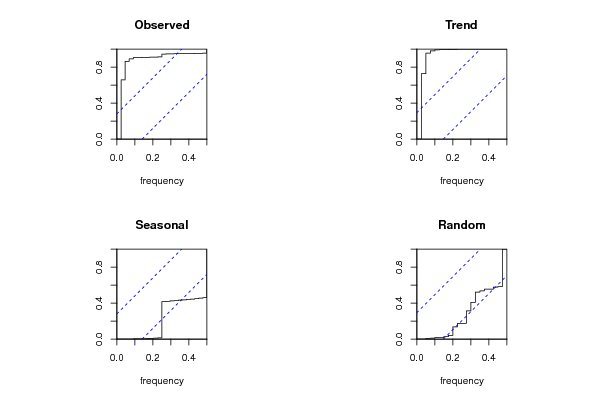
op <- par(mfrow = c(2,2))
cpgram(as.numeric(x),main='Observed')
cpgram(as.numeric(m$trend[!is.na(m$trend)]),main='Trend')
cpgram(as.numeric(m$seasonal[!is.na(m$seasonal)]),main='Seasonal')
cpgram(as.numeric(m$random[!is.na(m$random)]),main='Random')
par(op)
dev.off()
load(file='createtable')
a<-table.start()
a<-table.row.start(a)
a<-table.element(a,'Classical Decomposition by Moving Averages',6,TRUE)
a<-table.row.end(a)
a<-table.row.start(a)
a<-table.element(a,'t',header=TRUE)
a<-table.element(a,'Observations',header=TRUE)
a<-table.element(a,'Fit',header=TRUE)
a<-table.element(a,'Trend',header=TRUE)
a<-table.element(a,'Seasonal',header=TRUE)
a<-table.element(a,'Random',header=TRUE)
a<-table.row.end(a)
for (i in 1:length(m$trend)) {
a<-table.row.start(a)
a<-table.element(a,i,header=TRUE)
a<-table.element(a,x[i])
if (par1 == 'additive') a<-table.element(a,signif(m$trend[i]+m$seasonal[i],6)) else a<-table.element(a,signif(m$trend[i]*m$seasonal[i],6))
a<-table.element(a,signif(m$trend[i],6))
a<-table.element(a,signif(m$seasonal[i],6))
a<-table.element(a,signif(m$random[i],6))
a<-table.row.end(a)
}
a<-table.end(a)
table.save(a,file='mytable.tab')