Free Statistics

of Irreproducible Research!

Author's title

Author*The author of this computation has been verified*
R Software Modulerwasp_arimabackwardselection.wasp
Title produced by softwareARIMA Backward Selection
Date of computationThu, 22 Dec 2016 20:02:59 +0100
Cite this page as followsStatistical Computations at FreeStatistics.org, Office for Research Development and Education, URL https://freestatistics.org/blog/index.php?v=date/2016/Dec/22/t1482433468n4v2uulhipvprzg.htm/, Retrieved Mon, 29 Apr 2024 02:09:42 +0000
Statistical Computations at FreeStatistics.org, Office for Research Development and Education, URL https://freestatistics.org/blog/index.php?pk=302639, Retrieved Mon, 29 Apr 2024 02:09:42 +0000
QR Codes:

Original text written by user:
IsPrivate?No (this computation is public)
User-defined keywords
Estimated Impact73
Family? (F = Feedback message, R = changed R code, M = changed R Module, P = changed Parameters, D = changed Data)
-       [ARIMA Backward Selection] [ARIMA Backward Se...] [2016-12-22 19:02:59] [9b0b4f5f4290a2ed9efd388f9ce31ae7] [Current]
Feedback Forum

Post a new message
Dataseries X:
2312
1089
2742
3145
2966
2055
2450
2742
1697
2409
2233
2100
3434
1867
2365
3578
2845
2778
2056
2757
3325
3671
2147
3225
3556
4661
3344
5375
3907
3356
2184
3510
2834
3271
2834
2408
3261
1526
2938
2352
3915
3145
1566
2746
3572
2651
2805
3354
2523
1480
3278
5081
3332
2789
4111
2508
1833
2371
4268
2194
2935
3347
3034
5448
3427
3036
4196
3009
3369
4168
3403
1779
2761
2582
3153
3011
3419
4042
4379
4602
3249
4372
4328
3695
3614
2114
2839
2490
2610
2372
2833
4018
2734
3027
3862
3281
2746
2538
1805
2500
2601
3178
4193
2606
2491
4090
2786
2280
2403
2934
1601
1946
2554
2006
2830
3173
1960
3052
2151
2493
2752
2542
2027
1940
1877


Summary of computational transaction
Raw Input view raw input (R code)
Raw Outputview raw output of R engine
Computing time3 seconds
R ServerBig Analytics Cloud Computing Center

\begin{tabular}{lllllllll}
\hline
Summary of computational transaction \tabularnewline
Raw Input view raw input (R code)  \tabularnewline
Raw Outputview raw output of R engine  \tabularnewline
Computing time3 seconds \tabularnewline
R ServerBig Analytics Cloud Computing Center \tabularnewline
\hline
\end{tabular}
%Source: https://freestatistics.org/blog/index.php?pk=302639&T=0

[TABLE]
[ROW]
Summary of computational transaction[/C][/ROW] [ROW]Raw Input[/C] view raw input (R code) [/C][/ROW] [ROW]Raw Output[/C]view raw output of R engine [/C][/ROW] [ROW]Computing time[/C]3 seconds[/C][/ROW] [ROW]R Server[/C]Big Analytics Cloud Computing Center[/C][/ROW] [/TABLE] Source: https://freestatistics.org/blog/index.php?pk=302639&T=0

Globally Unique Identifier (entire table): ba.freestatistics.org/blog/index.php?pk=302639&T=0

As an alternative you can also use a QR Code:  

The GUIDs for individual cells are displayed in the table below:

Summary of computational transaction
Raw Input view raw input (R code)
Raw Outputview raw output of R engine
Computing time3 seconds
R ServerBig Analytics Cloud Computing Center


ARIMA Parameter Estimation and Backward Selection
Iterationar1ar2ar3sar1sma1
Estimates ( 1 )0.35940.20390.39010.659-0.4647
(p-val)(0 )(0.0212 )(0 )(0.0071 )(0.0852 )
Estimates ( 2 )0.37130.19590.39840.21230
(p-val)(0 )(0.0274 )(0 )(0.0213 )(NA )
Estimates ( 3 )NANANANANA
(p-val)(NA )(NA )(NA )(NA )(NA )
Estimates ( 4 )NANANANANA
(p-val)(NA )(NA )(NA )(NA )(NA )
Estimates ( 5 )NANANANANA
(p-val)(NA )(NA )(NA )(NA )(NA )
Estimates ( 6 )NANANANANA
(p-val)(NA )(NA )(NA )(NA )(NA )
Estimates ( 7 )NANANANANA
(p-val)(NA )(NA )(NA )(NA )(NA )
Estimates ( 8 )NANANANANA
(p-val)(NA )(NA )(NA )(NA )(NA )
Estimates ( 9 )NANANANANA
(p-val)(NA )(NA )(NA )(NA )(NA )

\begin{tabular}{lllllllll}
\hline
ARIMA Parameter Estimation and Backward Selection \tabularnewline
Iteration & ar1 & ar2 & ar3 & sar1 & sma1 \tabularnewline
Estimates ( 1 ) & 0.3594 & 0.2039 & 0.3901 & 0.659 & -0.4647 \tabularnewline
(p-val) & (0 ) & (0.0212 ) & (0 ) & (0.0071 ) & (0.0852 ) \tabularnewline
Estimates ( 2 ) & 0.3713 & 0.1959 & 0.3984 & 0.2123 & 0 \tabularnewline
(p-val) & (0 ) & (0.0274 ) & (0 ) & (0.0213 ) & (NA ) \tabularnewline
Estimates ( 3 ) & NA & NA & NA & NA & NA \tabularnewline
(p-val) & (NA ) & (NA ) & (NA ) & (NA ) & (NA ) \tabularnewline
Estimates ( 4 ) & NA & NA & NA & NA & NA \tabularnewline
(p-val) & (NA ) & (NA ) & (NA ) & (NA ) & (NA ) \tabularnewline
Estimates ( 5 ) & NA & NA & NA & NA & NA \tabularnewline
(p-val) & (NA ) & (NA ) & (NA ) & (NA ) & (NA ) \tabularnewline
Estimates ( 6 ) & NA & NA & NA & NA & NA \tabularnewline
(p-val) & (NA ) & (NA ) & (NA ) & (NA ) & (NA ) \tabularnewline
Estimates ( 7 ) & NA & NA & NA & NA & NA \tabularnewline
(p-val) & (NA ) & (NA ) & (NA ) & (NA ) & (NA ) \tabularnewline
Estimates ( 8 ) & NA & NA & NA & NA & NA \tabularnewline
(p-val) & (NA ) & (NA ) & (NA ) & (NA ) & (NA ) \tabularnewline
Estimates ( 9 ) & NA & NA & NA & NA & NA \tabularnewline
(p-val) & (NA ) & (NA ) & (NA ) & (NA ) & (NA ) \tabularnewline
\hline
\end{tabular}
%Source: https://freestatistics.org/blog/index.php?pk=302639&T=1

[TABLE]
[ROW][C]ARIMA Parameter Estimation and Backward Selection[/C][/ROW]
[ROW][C]Iteration[/C][C]ar1[/C][C]ar2[/C][C]ar3[/C][C]sar1[/C][C]sma1[/C][/ROW]
[ROW][C]Estimates ( 1 )[/C][C]0.3594[/C][C]0.2039[/C][C]0.3901[/C][C]0.659[/C][C]-0.4647[/C][/ROW]
[ROW][C](p-val)[/C][C](0 )[/C][C](0.0212 )[/C][C](0 )[/C][C](0.0071 )[/C][C](0.0852 )[/C][/ROW]
[ROW][C]Estimates ( 2 )[/C][C]0.3713[/C][C]0.1959[/C][C]0.3984[/C][C]0.2123[/C][C]0[/C][/ROW]
[ROW][C](p-val)[/C][C](0 )[/C][C](0.0274 )[/C][C](0 )[/C][C](0.0213 )[/C][C](NA )[/C][/ROW]
[ROW][C]Estimates ( 3 )[/C][C]NA[/C][C]NA[/C][C]NA[/C][C]NA[/C][C]NA[/C][/ROW]
[ROW][C](p-val)[/C][C](NA )[/C][C](NA )[/C][C](NA )[/C][C](NA )[/C][C](NA )[/C][/ROW]
[ROW][C]Estimates ( 4 )[/C][C]NA[/C][C]NA[/C][C]NA[/C][C]NA[/C][C]NA[/C][/ROW]
[ROW][C](p-val)[/C][C](NA )[/C][C](NA )[/C][C](NA )[/C][C](NA )[/C][C](NA )[/C][/ROW]
[ROW][C]Estimates ( 5 )[/C][C]NA[/C][C]NA[/C][C]NA[/C][C]NA[/C][C]NA[/C][/ROW]
[ROW][C](p-val)[/C][C](NA )[/C][C](NA )[/C][C](NA )[/C][C](NA )[/C][C](NA )[/C][/ROW]
[ROW][C]Estimates ( 6 )[/C][C]NA[/C][C]NA[/C][C]NA[/C][C]NA[/C][C]NA[/C][/ROW]
[ROW][C](p-val)[/C][C](NA )[/C][C](NA )[/C][C](NA )[/C][C](NA )[/C][C](NA )[/C][/ROW]
[ROW][C]Estimates ( 7 )[/C][C]NA[/C][C]NA[/C][C]NA[/C][C]NA[/C][C]NA[/C][/ROW]
[ROW][C](p-val)[/C][C](NA )[/C][C](NA )[/C][C](NA )[/C][C](NA )[/C][C](NA )[/C][/ROW]
[ROW][C]Estimates ( 8 )[/C][C]NA[/C][C]NA[/C][C]NA[/C][C]NA[/C][C]NA[/C][/ROW]
[ROW][C](p-val)[/C][C](NA )[/C][C](NA )[/C][C](NA )[/C][C](NA )[/C][C](NA )[/C][/ROW]
[ROW][C]Estimates ( 9 )[/C][C]NA[/C][C]NA[/C][C]NA[/C][C]NA[/C][C]NA[/C][/ROW]
[ROW][C](p-val)[/C][C](NA )[/C][C](NA )[/C][C](NA )[/C][C](NA )[/C][C](NA )[/C][/ROW]
[/TABLE]
Source: https://freestatistics.org/blog/index.php?pk=302639&T=1

Globally Unique Identifier (entire table): ba.freestatistics.org/blog/index.php?pk=302639&T=1

As an alternative you can also use a QR Code:  

The GUIDs for individual cells are displayed in the table below:

ARIMA Parameter Estimation and Backward Selection
Iterationar1ar2ar3sar1sma1
Estimates ( 1 )0.35940.20390.39010.659-0.4647
(p-val)(0 )(0.0212 )(0 )(0.0071 )(0.0852 )
Estimates ( 2 )0.37130.19590.39840.21230
(p-val)(0 )(0.0274 )(0 )(0.0213 )(NA )
Estimates ( 3 )NANANANANA
(p-val)(NA )(NA )(NA )(NA )(NA )
Estimates ( 4 )NANANANANA
(p-val)(NA )(NA )(NA )(NA )(NA )
Estimates ( 5 )NANANANANA
(p-val)(NA )(NA )(NA )(NA )(NA )
Estimates ( 6 )NANANANANA
(p-val)(NA )(NA )(NA )(NA )(NA )
Estimates ( 7 )NANANANANA
(p-val)(NA )(NA )(NA )(NA )(NA )
Estimates ( 8 )NANANANANA
(p-val)(NA )(NA )(NA )(NA )(NA )
Estimates ( 9 )NANANANANA
(p-val)(NA )(NA )(NA )(NA )(NA )


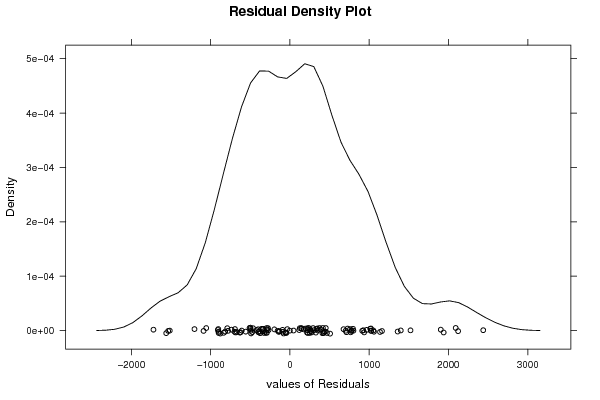
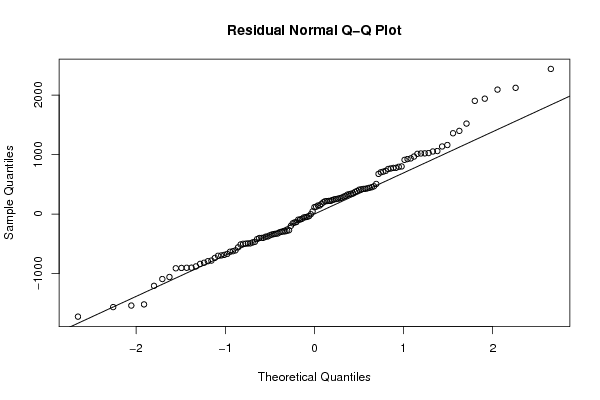
Estimated ARIMA Residuals
Value
726.920541180058
-835.464474963114
1052.17895048999
966.903327502056
795.150137066313
-736.211724631392
-155.290150134677
253.250362147399
-623.151553655914
222.471834385114
-33.2953522362827
45.9642984956699
1160.85464307857
-498.57849585193
-80.1905597728201
758.149338963244
145.285178471253
247.764827198772
-899.774413455089
266.612052435587
935.659053363758
1025.55459790085
-903.944091970662
333.783045467242
215.939961071106
2091.11125122594
-465.651015142686
1520.69371977184
-685.061716561409
-400.670215697265
-1722.22447860434
415.52770575946
-296.656285011034
425.095601199875
-93.4498414072714
-497.368431598716
291.492270567442
-1516.5488785967
775.923548658583
-791.019078287106
1902.46636578483
221.702303400163
-816.931803688331
-132.99125565604
1020.89020739846
-57.511526419763
199.129733923442
433.62063525211
-509.74296716723
-1090.26132254052
766.423910390642
2438.44891533092
-91.8566262708494
-694.16686029749
911.176618517199
-909.485042703343
-1204.78511996565
-558.841358734888
2121.34864780106
-608.43856539054
304.641170464506
467.237885910803
124.391364118122
1938.92560565835
-669.421255454137
-336.051503772931
409.63500630129
-325.413259482164
343.172788808719
712.517012997721
-329.888100204114
-1535.99737197761
-288.017907242907
-1.95204083386195
777.602314779239
-491.946261143132
675.688368638687
1136.02455017678
1059.7757417105
1018.81181062491
-878.373407519558
423.125245123225
116.536308990539
326.447908000776
-305.286429570862
-1561.27477432359
-375.536289351027
-780.526005455411
173.049387193163
-291.990093670529
274.6036066294
1398.02650855736
-44.9691624564928
-50.9143867075697
506.381092428069
373.704270040581
-344.400441685041
-278.148990846597
-1056.2373838281
144.46449054688
219.511444105443
1013.01062908489
1358.50474800822
-901.086582371793
-420.72835129178
925.013543408577
-401.02910794345
-491.169984172271
-475.426875756126
800.864895367658
-699.783252855806
-270.925679029953
258.725159401325
-140.764753344935
442.276808338505
703.213781698139
-379.53158529972
349.305865579528
-632.28631796445
452.021246623962
388.058063267012
235.885359778851
-196.61715462479
-397.519524053754
-357.721340913117

\begin{tabular}{lllllllll}
\hline
Estimated ARIMA Residuals \tabularnewline
Value \tabularnewline
 \tabularnewline
726.920541180058 \tabularnewline
-835.464474963114 \tabularnewline
1052.17895048999 \tabularnewline
966.903327502056 \tabularnewline
795.150137066313 \tabularnewline
-736.211724631392 \tabularnewline
-155.290150134677 \tabularnewline
253.250362147399 \tabularnewline
-623.151553655914 \tabularnewline
222.471834385114 \tabularnewline
-33.2953522362827 \tabularnewline
45.9642984956699 \tabularnewline
1160.85464307857 \tabularnewline
-498.57849585193 \tabularnewline
-80.1905597728201 \tabularnewline
758.149338963244 \tabularnewline
145.285178471253 \tabularnewline
247.764827198772 \tabularnewline
-899.774413455089 \tabularnewline
266.612052435587 \tabularnewline
935.659053363758 \tabularnewline
1025.55459790085 \tabularnewline
-903.944091970662 \tabularnewline
333.783045467242 \tabularnewline
215.939961071106 \tabularnewline
2091.11125122594 \tabularnewline
-465.651015142686 \tabularnewline
1520.69371977184 \tabularnewline
-685.061716561409 \tabularnewline
-400.670215697265 \tabularnewline
-1722.22447860434 \tabularnewline
415.52770575946 \tabularnewline
-296.656285011034 \tabularnewline
425.095601199875 \tabularnewline
-93.4498414072714 \tabularnewline
-497.368431598716 \tabularnewline
291.492270567442 \tabularnewline
-1516.5488785967 \tabularnewline
775.923548658583 \tabularnewline
-791.019078287106 \tabularnewline
1902.46636578483 \tabularnewline
221.702303400163 \tabularnewline
-816.931803688331 \tabularnewline
-132.99125565604 \tabularnewline
1020.89020739846 \tabularnewline
-57.511526419763 \tabularnewline
199.129733923442 \tabularnewline
433.62063525211 \tabularnewline
-509.74296716723 \tabularnewline
-1090.26132254052 \tabularnewline
766.423910390642 \tabularnewline
2438.44891533092 \tabularnewline
-91.8566262708494 \tabularnewline
-694.16686029749 \tabularnewline
911.176618517199 \tabularnewline
-909.485042703343 \tabularnewline
-1204.78511996565 \tabularnewline
-558.841358734888 \tabularnewline
2121.34864780106 \tabularnewline
-608.43856539054 \tabularnewline
304.641170464506 \tabularnewline
467.237885910803 \tabularnewline
124.391364118122 \tabularnewline
1938.92560565835 \tabularnewline
-669.421255454137 \tabularnewline
-336.051503772931 \tabularnewline
409.63500630129 \tabularnewline
-325.413259482164 \tabularnewline
343.172788808719 \tabularnewline
712.517012997721 \tabularnewline
-329.888100204114 \tabularnewline
-1535.99737197761 \tabularnewline
-288.017907242907 \tabularnewline
-1.95204083386195 \tabularnewline
777.602314779239 \tabularnewline
-491.946261143132 \tabularnewline
675.688368638687 \tabularnewline
1136.02455017678 \tabularnewline
1059.7757417105 \tabularnewline
1018.81181062491 \tabularnewline
-878.373407519558 \tabularnewline
423.125245123225 \tabularnewline
116.536308990539 \tabularnewline
326.447908000776 \tabularnewline
-305.286429570862 \tabularnewline
-1561.27477432359 \tabularnewline
-375.536289351027 \tabularnewline
-780.526005455411 \tabularnewline
173.049387193163 \tabularnewline
-291.990093670529 \tabularnewline
274.6036066294 \tabularnewline
1398.02650855736 \tabularnewline
-44.9691624564928 \tabularnewline
-50.9143867075697 \tabularnewline
506.381092428069 \tabularnewline
373.704270040581 \tabularnewline
-344.400441685041 \tabularnewline
-278.148990846597 \tabularnewline
-1056.2373838281 \tabularnewline
144.46449054688 \tabularnewline
219.511444105443 \tabularnewline
1013.01062908489 \tabularnewline
1358.50474800822 \tabularnewline
-901.086582371793 \tabularnewline
-420.72835129178 \tabularnewline
925.013543408577 \tabularnewline
-401.02910794345 \tabularnewline
-491.169984172271 \tabularnewline
-475.426875756126 \tabularnewline
800.864895367658 \tabularnewline
-699.783252855806 \tabularnewline
-270.925679029953 \tabularnewline
258.725159401325 \tabularnewline
-140.764753344935 \tabularnewline
442.276808338505 \tabularnewline
703.213781698139 \tabularnewline
-379.53158529972 \tabularnewline
349.305865579528 \tabularnewline
-632.28631796445 \tabularnewline
452.021246623962 \tabularnewline
388.058063267012 \tabularnewline
235.885359778851 \tabularnewline
-196.61715462479 \tabularnewline
-397.519524053754 \tabularnewline
-357.721340913117 \tabularnewline
\hline
\end{tabular}
%Source: https://freestatistics.org/blog/index.php?pk=302639&T=2

[TABLE]
[ROW][C]Estimated ARIMA Residuals[/C][/ROW]
[ROW][C]Value[/C][/ROW]
[ROW][C][/C][/ROW]
[ROW][C]726.920541180058[/C][/ROW]
[ROW][C]-835.464474963114[/C][/ROW]
[ROW][C]1052.17895048999[/C][/ROW]
[ROW][C]966.903327502056[/C][/ROW]
[ROW][C]795.150137066313[/C][/ROW]
[ROW][C]-736.211724631392[/C][/ROW]
[ROW][C]-155.290150134677[/C][/ROW]
[ROW][C]253.250362147399[/C][/ROW]
[ROW][C]-623.151553655914[/C][/ROW]
[ROW][C]222.471834385114[/C][/ROW]
[ROW][C]-33.2953522362827[/C][/ROW]
[ROW][C]45.9642984956699[/C][/ROW]
[ROW][C]1160.85464307857[/C][/ROW]
[ROW][C]-498.57849585193[/C][/ROW]
[ROW][C]-80.1905597728201[/C][/ROW]
[ROW][C]758.149338963244[/C][/ROW]
[ROW][C]145.285178471253[/C][/ROW]
[ROW][C]247.764827198772[/C][/ROW]
[ROW][C]-899.774413455089[/C][/ROW]
[ROW][C]266.612052435587[/C][/ROW]
[ROW][C]935.659053363758[/C][/ROW]
[ROW][C]1025.55459790085[/C][/ROW]
[ROW][C]-903.944091970662[/C][/ROW]
[ROW][C]333.783045467242[/C][/ROW]
[ROW][C]215.939961071106[/C][/ROW]
[ROW][C]2091.11125122594[/C][/ROW]
[ROW][C]-465.651015142686[/C][/ROW]
[ROW][C]1520.69371977184[/C][/ROW]
[ROW][C]-685.061716561409[/C][/ROW]
[ROW][C]-400.670215697265[/C][/ROW]
[ROW][C]-1722.22447860434[/C][/ROW]
[ROW][C]415.52770575946[/C][/ROW]
[ROW][C]-296.656285011034[/C][/ROW]
[ROW][C]425.095601199875[/C][/ROW]
[ROW][C]-93.4498414072714[/C][/ROW]
[ROW][C]-497.368431598716[/C][/ROW]
[ROW][C]291.492270567442[/C][/ROW]
[ROW][C]-1516.5488785967[/C][/ROW]
[ROW][C]775.923548658583[/C][/ROW]
[ROW][C]-791.019078287106[/C][/ROW]
[ROW][C]1902.46636578483[/C][/ROW]
[ROW][C]221.702303400163[/C][/ROW]
[ROW][C]-816.931803688331[/C][/ROW]
[ROW][C]-132.99125565604[/C][/ROW]
[ROW][C]1020.89020739846[/C][/ROW]
[ROW][C]-57.511526419763[/C][/ROW]
[ROW][C]199.129733923442[/C][/ROW]
[ROW][C]433.62063525211[/C][/ROW]
[ROW][C]-509.74296716723[/C][/ROW]
[ROW][C]-1090.26132254052[/C][/ROW]
[ROW][C]766.423910390642[/C][/ROW]
[ROW][C]2438.44891533092[/C][/ROW]
[ROW][C]-91.8566262708494[/C][/ROW]
[ROW][C]-694.16686029749[/C][/ROW]
[ROW][C]911.176618517199[/C][/ROW]
[ROW][C]-909.485042703343[/C][/ROW]
[ROW][C]-1204.78511996565[/C][/ROW]
[ROW][C]-558.841358734888[/C][/ROW]
[ROW][C]2121.34864780106[/C][/ROW]
[ROW][C]-608.43856539054[/C][/ROW]
[ROW][C]304.641170464506[/C][/ROW]
[ROW][C]467.237885910803[/C][/ROW]
[ROW][C]124.391364118122[/C][/ROW]
[ROW][C]1938.92560565835[/C][/ROW]
[ROW][C]-669.421255454137[/C][/ROW]
[ROW][C]-336.051503772931[/C][/ROW]
[ROW][C]409.63500630129[/C][/ROW]
[ROW][C]-325.413259482164[/C][/ROW]
[ROW][C]343.172788808719[/C][/ROW]
[ROW][C]712.517012997721[/C][/ROW]
[ROW][C]-329.888100204114[/C][/ROW]
[ROW][C]-1535.99737197761[/C][/ROW]
[ROW][C]-288.017907242907[/C][/ROW]
[ROW][C]-1.95204083386195[/C][/ROW]
[ROW][C]777.602314779239[/C][/ROW]
[ROW][C]-491.946261143132[/C][/ROW]
[ROW][C]675.688368638687[/C][/ROW]
[ROW][C]1136.02455017678[/C][/ROW]
[ROW][C]1059.7757417105[/C][/ROW]
[ROW][C]1018.81181062491[/C][/ROW]
[ROW][C]-878.373407519558[/C][/ROW]
[ROW][C]423.125245123225[/C][/ROW]
[ROW][C]116.536308990539[/C][/ROW]
[ROW][C]326.447908000776[/C][/ROW]
[ROW][C]-305.286429570862[/C][/ROW]
[ROW][C]-1561.27477432359[/C][/ROW]
[ROW][C]-375.536289351027[/C][/ROW]
[ROW][C]-780.526005455411[/C][/ROW]
[ROW][C]173.049387193163[/C][/ROW]
[ROW][C]-291.990093670529[/C][/ROW]
[ROW][C]274.6036066294[/C][/ROW]
[ROW][C]1398.02650855736[/C][/ROW]
[ROW][C]-44.9691624564928[/C][/ROW]
[ROW][C]-50.9143867075697[/C][/ROW]
[ROW][C]506.381092428069[/C][/ROW]
[ROW][C]373.704270040581[/C][/ROW]
[ROW][C]-344.400441685041[/C][/ROW]
[ROW][C]-278.148990846597[/C][/ROW]
[ROW][C]-1056.2373838281[/C][/ROW]
[ROW][C]144.46449054688[/C][/ROW]
[ROW][C]219.511444105443[/C][/ROW]
[ROW][C]1013.01062908489[/C][/ROW]
[ROW][C]1358.50474800822[/C][/ROW]
[ROW][C]-901.086582371793[/C][/ROW]
[ROW][C]-420.72835129178[/C][/ROW]
[ROW][C]925.013543408577[/C][/ROW]
[ROW][C]-401.02910794345[/C][/ROW]
[ROW][C]-491.169984172271[/C][/ROW]
[ROW][C]-475.426875756126[/C][/ROW]
[ROW][C]800.864895367658[/C][/ROW]
[ROW][C]-699.783252855806[/C][/ROW]
[ROW][C]-270.925679029953[/C][/ROW]
[ROW][C]258.725159401325[/C][/ROW]
[ROW][C]-140.764753344935[/C][/ROW]
[ROW][C]442.276808338505[/C][/ROW]
[ROW][C]703.213781698139[/C][/ROW]
[ROW][C]-379.53158529972[/C][/ROW]
[ROW][C]349.305865579528[/C][/ROW]
[ROW][C]-632.28631796445[/C][/ROW]
[ROW][C]452.021246623962[/C][/ROW]
[ROW][C]388.058063267012[/C][/ROW]
[ROW][C]235.885359778851[/C][/ROW]
[ROW][C]-196.61715462479[/C][/ROW]
[ROW][C]-397.519524053754[/C][/ROW]
[ROW][C]-357.721340913117[/C][/ROW]
[/TABLE]
Source: https://freestatistics.org/blog/index.php?pk=302639&T=2

Globally Unique Identifier (entire table): ba.freestatistics.org/blog/index.php?pk=302639&T=2

As an alternative you can also use a QR Code:  

The GUIDs for individual cells are displayed in the table below:

Estimated ARIMA Residuals
Value
726.920541180058
-835.464474963114
1052.17895048999
966.903327502056
795.150137066313
-736.211724631392
-155.290150134677
253.250362147399
-623.151553655914
222.471834385114
-33.2953522362827
45.9642984956699
1160.85464307857
-498.57849585193
-80.1905597728201
758.149338963244
145.285178471253
247.764827198772
-899.774413455089
266.612052435587
935.659053363758
1025.55459790085
-903.944091970662
333.783045467242
215.939961071106
2091.11125122594
-465.651015142686
1520.69371977184
-685.061716561409
-400.670215697265
-1722.22447860434
415.52770575946
-296.656285011034
425.095601199875
-93.4498414072714
-497.368431598716
291.492270567442
-1516.5488785967
775.923548658583
-791.019078287106
1902.46636578483
221.702303400163
-816.931803688331
-132.99125565604
1020.89020739846
-57.511526419763
199.129733923442
433.62063525211
-509.74296716723
-1090.26132254052
766.423910390642
2438.44891533092
-91.8566262708494
-694.16686029749
911.176618517199
-909.485042703343
-1204.78511996565
-558.841358734888
2121.34864780106
-608.43856539054
304.641170464506
467.237885910803
124.391364118122
1938.92560565835
-669.421255454137
-336.051503772931
409.63500630129
-325.413259482164
343.172788808719
712.517012997721
-329.888100204114
-1535.99737197761
-288.017907242907
-1.95204083386195
777.602314779239
-491.946261143132
675.688368638687
1136.02455017678
1059.7757417105
1018.81181062491
-878.373407519558
423.125245123225
116.536308990539
326.447908000776
-305.286429570862
-1561.27477432359
-375.536289351027
-780.526005455411
173.049387193163
-291.990093670529
274.6036066294
1398.02650855736
-44.9691624564928
-50.9143867075697
506.381092428069
373.704270040581
-344.400441685041
-278.148990846597
-1056.2373838281
144.46449054688
219.511444105443
1013.01062908489
1358.50474800822
-901.086582371793
-420.72835129178
925.013543408577
-401.02910794345
-491.169984172271
-475.426875756126
800.864895367658
-699.783252855806
-270.925679029953
258.725159401325
-140.764753344935
442.276808338505
703.213781698139
-379.53158529972
349.305865579528
-632.28631796445
452.021246623962
388.058063267012
235.885359778851
-196.61715462479
-397.519524053754
-357.721340913117


Parameters (Session):
par1 = FALSE ; par2 = 2.0 ; par3 = 0 ; par4 = 0 ; par5 = 1 ; par6 = 3 ; par7 = 1 ; par8 = 2 ; par9 = 1 ;
Parameters (R input):
par1 = FALSE ; par2 = 1 ; par3 = 0 ; par4 = 0 ; par5 = 12 ; par6 = 3 ; par7 = 0 ; par8 = 1 ; par9 = 1 ;
R code (references can be found in the software module):
library(lattice)
if (par1 == 'TRUE') par1 <- TRUE
if (par1 == 'FALSE') par1 <- FALSE
par2 <- as.numeric(par2) #Box-Cox lambda transformation parameter
par3 <- as.numeric(par3) #degree of non-seasonal differencing
par4 <- as.numeric(par4) #degree of seasonal differencing
par5 <- as.numeric(par5) #seasonal period
par6 <- as.numeric(par6) #degree (p) of the non-seasonal AR(p) polynomial
par7 <- as.numeric(par7) #degree (q) of the non-seasonal MA(q) polynomial
par8 <- as.numeric(par8) #degree (P) of the seasonal AR(P) polynomial
par9 <- as.numeric(par9) #degree (Q) of the seasonal MA(Q) polynomial
armaGR <- function(arima.out, names, n){
try1 <- arima.out$coef
try2 <- sqrt(diag(arima.out$var.coef))
try.data.frame <- data.frame(matrix(NA,ncol=4,nrow=length(names)))
dimnames(try.data.frame) <- list(names,c('coef','std','tstat','pv'))
try.data.frame[,1] <- try1
for(i in 1:length(try2)) try.data.frame[which(rownames(try.data.frame)==names(try2)[i]),2] <- try2[i]
try.data.frame[,3] <- try.data.frame[,1] / try.data.frame[,2]
try.data.frame[,4] <- round((1-pt(abs(try.data.frame[,3]),df=n-(length(try2)+1)))*2,5)
vector <- rep(NA,length(names))
vector[is.na(try.data.frame[,4])] <- 0
maxi <- which.max(try.data.frame[,4])
continue <- max(try.data.frame[,4],na.rm=TRUE) > .05
vector[maxi] <- 0
list(summary=try.data.frame,next.vector=vector,continue=continue)
}
arimaSelect <- function(series, order=c(13,0,0), seasonal=list(order=c(2,0,0),period=12), include.mean=F){
nrc <- order[1]+order[3]+seasonal$order[1]+seasonal$order[3]
coeff <- matrix(NA, nrow=nrc*2, ncol=nrc)
pval <- matrix(NA, nrow=nrc*2, ncol=nrc)
mylist <- rep(list(NULL), nrc)
names <- NULL
if(order[1] > 0) names <- paste('ar',1:order[1],sep='')
if(order[3] > 0) names <- c( names , paste('ma',1:order[3],sep='') )
if(seasonal$order[1] > 0) names <- c(names, paste('sar',1:seasonal$order[1],sep=''))
if(seasonal$order[3] > 0) names <- c(names, paste('sma',1:seasonal$order[3],sep=''))
arima.out <- arima(series, order=order, seasonal=seasonal, include.mean=include.mean, method='ML')
mylist[[1]] <- arima.out
last.arma <- armaGR(arima.out, names, length(series))
mystop <- FALSE
i <- 1
coeff[i,] <- last.arma[[1]][,1]
pval [i,] <- last.arma[[1]][,4]
i <- 2
aic <- arima.out$aic
while(!mystop){
mylist[[i]] <- arima.out
arima.out <- arima(series, order=order, seasonal=seasonal, include.mean=include.mean, method='ML', fixed=last.arma$next.vector)
aic <- c(aic, arima.out$aic)
last.arma <- armaGR(arima.out, names, length(series))
mystop <- !last.arma$continue
coeff[i,] <- last.arma[[1]][,1]
pval [i,] <- last.arma[[1]][,4]
i <- i+1
}
list(coeff, pval, mylist, aic=aic)
}
arimaSelectplot <- function(arimaSelect.out,noms,choix){
noms <- names(arimaSelect.out[[3]][[1]]$coef)
coeff <- arimaSelect.out[[1]]
k <- min(which(is.na(coeff[,1])))-1
coeff <- coeff[1:k,]
pval <- arimaSelect.out[[2]][1:k,]
aic <- arimaSelect.out$aic[1:k]
coeff[coeff==0] <- NA
n <- ncol(coeff)
if(missing(choix)) choix <- k
layout(matrix(c(1,1,1,2,
3,3,3,2,
3,3,3,4,
5,6,7,7),nr=4),
widths=c(10,35,45,15),
heights=c(30,30,15,15))
couleurs <- rainbow(75)[1:50]#(50)
ticks <- pretty(coeff)
par(mar=c(1,1,3,1))
plot(aic,k:1-.5,type='o',pch=21,bg='blue',cex=2,axes=F,lty=2,xpd=NA)
points(aic[choix],k-choix+.5,pch=21,cex=4,bg=2,xpd=NA)
title('aic',line=2)
par(mar=c(3,0,0,0))
plot(0,axes=F,xlab='',ylab='',xlim=range(ticks),ylim=c(.1,1))
rect(xleft = min(ticks) + (0:49)/50*(max(ticks)-min(ticks)),
xright = min(ticks) + (1:50)/50*(max(ticks)-min(ticks)),
ytop = rep(1,50),
ybottom= rep(0,50),col=couleurs,border=NA)
axis(1,ticks)
rect(xleft=min(ticks),xright=max(ticks),ytop=1,ybottom=0)
text(mean(coeff,na.rm=T),.5,'coefficients',cex=2,font=2)
par(mar=c(1,1,3,1))
image(1:n,1:k,t(coeff[k:1,]),axes=F,col=couleurs,zlim=range(ticks))
for(i in 1:n) for(j in 1:k) if(!is.na(coeff[j,i])) {
if(pval[j,i]<.01) symb = 'green'
else if( (pval[j,i]<.05) & (pval[j,i]>=.01)) symb = 'orange'
else if( (pval[j,i]<.1) & (pval[j,i]>=.05)) symb = 'red'
else symb = 'black'
polygon(c(i+.5 ,i+.2 ,i+.5 ,i+.5),
c(k-j+0.5,k-j+0.5,k-j+0.8,k-j+0.5),
col=symb)
if(j==choix) {
rect(xleft=i-.5,
xright=i+.5,
ybottom=k-j+1.5,
ytop=k-j+.5,
lwd=4)
text(i,
k-j+1,
round(coeff[j,i],2),
cex=1.2,
font=2)
}
else{
rect(xleft=i-.5,xright=i+.5,ybottom=k-j+1.5,ytop=k-j+.5)
text(i,k-j+1,round(coeff[j,i],2),cex=1.2,font=1)
}
}
axis(3,1:n,noms)
par(mar=c(0.5,0,0,0.5))
plot(0,axes=F,xlab='',ylab='',type='n',xlim=c(0,8),ylim=c(-.2,.8))
cols <- c('green','orange','red','black')
niv <- c('0','0.01','0.05','0.1')
for(i in 0:3){
polygon(c(1+2*i ,1+2*i ,1+2*i-.5 ,1+2*i),
c(.4 ,.7 , .4 , .4),
col=cols[i+1])
text(2*i,0.5,niv[i+1],cex=1.5)
}
text(8,.5,1,cex=1.5)
text(4,0,'p-value',cex=2)
box()
residus <- arimaSelect.out[[3]][[choix]]$res
par(mar=c(1,2,4,1))
acf(residus,main='')
title('acf',line=.5)
par(mar=c(1,2,4,1))
pacf(residus,main='')
title('pacf',line=.5)
par(mar=c(2,2,4,1))
qqnorm(residus,main='')
title('qq-norm',line=.5)
qqline(residus)
residus
}
if (par2 == 0) x <- log(x)
if (par2 != 0) x <- x^par2
(selection <- arimaSelect(x, order=c(par6,par3,par7), seasonal=list(order=c(par8,par4,par9), period=par5)))
bitmap(file='test1.png')
resid <- arimaSelectplot(selection)
dev.off()
resid
bitmap(file='test2.png')
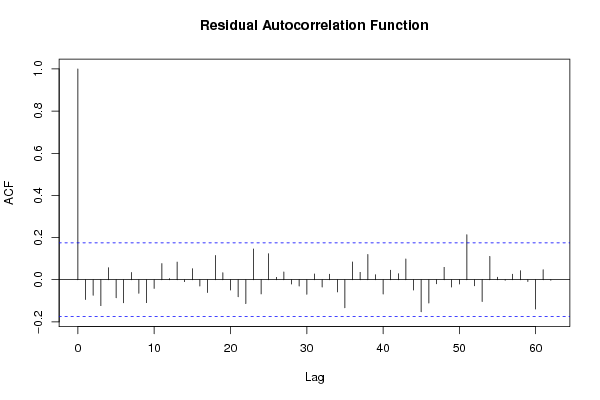
acf(resid,length(resid)/2, main='Residual Autocorrelation Function')
dev.off()
bitmap(file='test3.png')
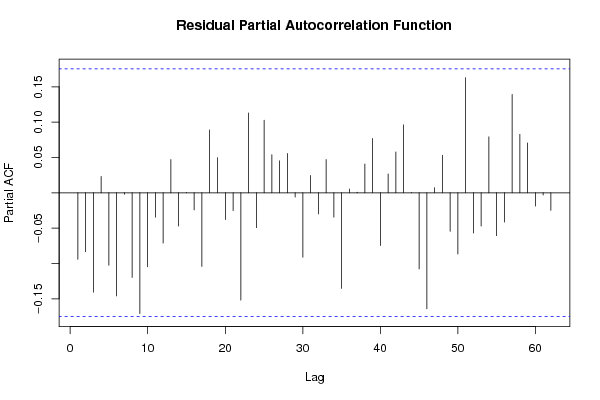
pacf(resid,length(resid)/2, main='Residual Partial Autocorrelation Function')
dev.off()
bitmap(file='test4.png')
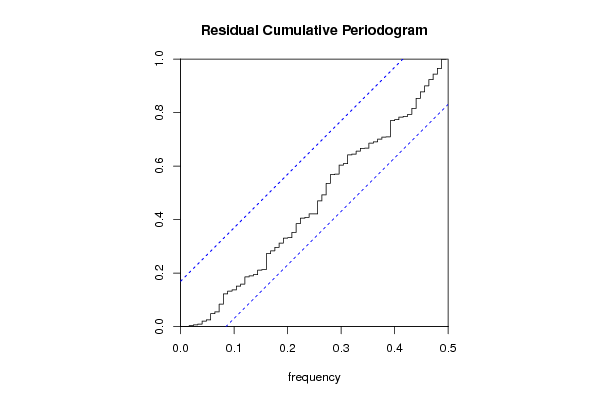
cpgram(resid, main='Residual Cumulative Periodogram')
dev.off()
bitmap(file='test5.png')
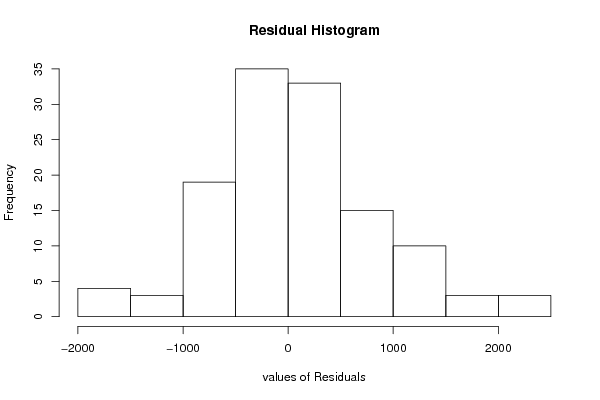
hist(resid, main='Residual Histogram', xlab='values of Residuals')
dev.off()
bitmap(file='test6.png')
densityplot(~resid,col='black',main='Residual Density Plot', xlab='values of Residuals')
dev.off()
bitmap(file='test7.png')
qqnorm(resid, main='Residual Normal Q-Q Plot')
qqline(resid)
dev.off()
ncols <- length(selection[[1]][1,])
nrows <- length(selection[[2]][,1])-1
load(file='createtable')
a<-table.start()
a<-table.row.start(a)
a<-table.element(a,'ARIMA Parameter Estimation and Backward Selection', ncols+1,TRUE)
a<-table.row.end(a)
a<-table.row.start(a)
a<-table.element(a,'Iteration', header=TRUE)
for (i in 1:ncols) {
a<-table.element(a,names(selection[[3]][[1]]$coef)[i],header=TRUE)
}
a<-table.row.end(a)
for (j in 1:nrows) {
a<-table.row.start(a)
mydum <- 'Estimates ('
mydum <- paste(mydum,j)
mydum <- paste(mydum,')')
a<-table.element(a,mydum, header=TRUE)
for (i in 1:ncols) {
a<-table.element(a,round(selection[[1]][j,i],4))
}
a<-table.row.end(a)
a<-table.row.start(a)
a<-table.element(a,'(p-val)', header=TRUE)
for (i in 1:ncols) {
mydum <- '('
mydum <- paste(mydum,round(selection[[2]][j,i],4),sep='')
mydum <- paste(mydum,')')
a<-table.element(a,mydum)
}
a<-table.row.end(a)
}
a<-table.end(a)
table.save(a,file='mytable.tab')
a<-table.start()
a<-table.row.start(a)
a<-table.element(a,'Estimated ARIMA Residuals', 1,TRUE)
a<-table.row.end(a)
a<-table.row.start(a)
a<-table.element(a,'Value', 1,TRUE)
a<-table.row.end(a)
for (i in (par4*par5+par3):length(resid)) {
a<-table.row.start(a)
a<-table.element(a,resid[i])
a<-table.row.end(a)
}
a<-table.end(a)
table.save(a,file='mytable1.tab')