Free Statistics

of Irreproducible Research!

Author's title

Author*The author of this computation has been verified*
R Software Modulerwasp_smp.wasp
Title produced by softwareStandard Deviation-Mean Plot
Date of computationThu, 22 Dec 2016 20:33:23 +0100
Cite this page as followsStatistical Computations at FreeStatistics.org, Office for Research Development and Education, URL https://freestatistics.org/blog/index.php?v=date/2016/Dec/22/t1482435849ih87xzjkmn9bqn1.htm/, Retrieved Mon, 29 Apr 2024 00:04:01 +0000
Statistical Computations at FreeStatistics.org, Office for Research Development and Education, URL https://freestatistics.org/blog/index.php?pk=302653, Retrieved Mon, 29 Apr 2024 00:04:01 +0000
QR Codes:

Original text written by user:
IsPrivate?No (this computation is public)
User-defined keywords
Estimated Impact65
Family? (F = Feedback message, R = changed R code, M = changed R Module, P = changed Parameters, D = changed Data)
-       [Standard Deviation-Mean Plot] [Lambda] [2016-12-22 19:33:23] [695928fec7566687630f1ba48b31beaa] [Current]
Feedback Forum

Post a new message
Dataseries X:
7687
6881
6033
5058
4171
3275
2608
2195
1878
3783
6896
8160
7734
6554
5252
4081
3124
2341
1822
1509
1578
3180
5070
5927
5846
5109
4227
3469
2808
2202
1687
1491
1940
4059
7064
9268
9488
8729
7921
7112
6292
5542
5269
4998
5293
7575
10190
11101
11101
10225
9713
8796
7930
7419
6656
6268
5814
7192
8665
8924
7643
6359
4997
3960
2993
2212
1757
1491
1432
3155
7486
7551
7580
6541
5644
4817
3989
3576
2908
2830
3726
6165
8963
10696
10726
10271
9624
9035
8645
7931
8124
7393
7996
9519
10148
10252
9942
9033
7894
6832
5870
4807
3809
3239
4864
7398
9456
10555
10197
9151
7972
7028
5987
5073
4714
4348
5027
8210
11722
13524
13141
12048
10734
9353
8229
6760


Summary of computational transaction
Raw Input view raw input (R code)
Raw Outputview raw output of R engine
Computing time1 seconds
R ServerBig Analytics Cloud Computing Center

\begin{tabular}{lllllllll}
\hline
Summary of computational transaction \tabularnewline
Raw Input view raw input (R code)  \tabularnewline
Raw Outputview raw output of R engine  \tabularnewline
Computing time1 seconds \tabularnewline
R ServerBig Analytics Cloud Computing Center \tabularnewline
\hline
\end{tabular}
%Source: https://freestatistics.org/blog/index.php?pk=302653&T=0

[TABLE]
[ROW]
Summary of computational transaction[/C][/ROW] [ROW]Raw Input[/C] view raw input (R code) [/C][/ROW] [ROW]Raw Output[/C]view raw output of R engine [/C][/ROW] [ROW]Computing time[/C]1 seconds[/C][/ROW] [ROW]R Server[/C]Big Analytics Cloud Computing Center[/C][/ROW] [/TABLE] Source: https://freestatistics.org/blog/index.php?pk=302653&T=0

Globally Unique Identifier (entire table): ba.freestatistics.org/blog/index.php?pk=302653&T=0

As an alternative you can also use a QR Code:  

The GUIDs for individual cells are displayed in the table below:

Summary of computational transaction
Raw Input view raw input (R code)
Raw Outputview raw output of R engine
Computing time1 seconds
R ServerBig Analytics Cloud Computing Center


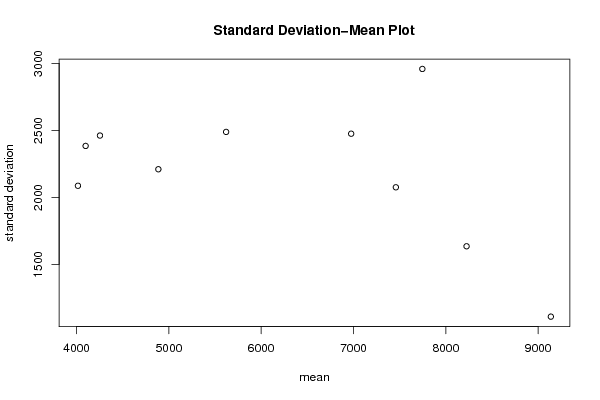
Standard Deviation-Mean Plot
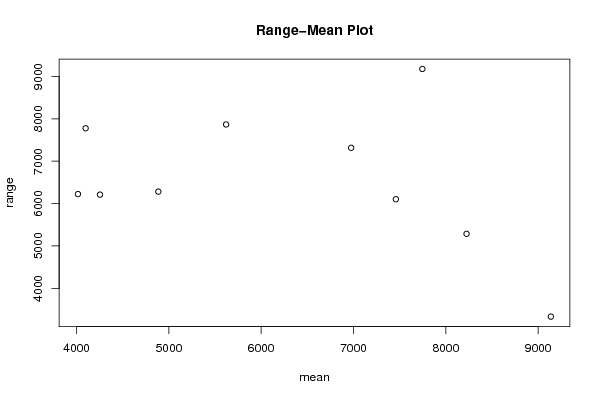
SectionMeanStandard DeviationRange
14885.416666666672210.141396477666282
24014.333333333332086.807188607576225
34097.52384.471182082487777
47459.166666666672075.408605260156103
58225.251634.90456351995287
642532461.917212994046211
75619.583333333332488.848783102647866
89138.666666666671109.290218057833333
96974.916666666672475.571098787417316
107746.083333333332959.247154209499176

\begin{tabular}{lllllllll}
\hline
Standard Deviation-Mean Plot \tabularnewline
Section & Mean & Standard Deviation & Range \tabularnewline
1 & 4885.41666666667 & 2210.14139647766 & 6282 \tabularnewline
2 & 4014.33333333333 & 2086.80718860757 & 6225 \tabularnewline
3 & 4097.5 & 2384.47118208248 & 7777 \tabularnewline
4 & 7459.16666666667 & 2075.40860526015 & 6103 \tabularnewline
5 & 8225.25 & 1634.9045635199 & 5287 \tabularnewline
6 & 4253 & 2461.91721299404 & 6211 \tabularnewline
7 & 5619.58333333333 & 2488.84878310264 & 7866 \tabularnewline
8 & 9138.66666666667 & 1109.29021805783 & 3333 \tabularnewline
9 & 6974.91666666667 & 2475.57109878741 & 7316 \tabularnewline
10 & 7746.08333333333 & 2959.24715420949 & 9176 \tabularnewline
\hline
\end{tabular}
%Source: https://freestatistics.org/blog/index.php?pk=302653&T=1

[TABLE]
[ROW][C]Standard Deviation-Mean Plot[/C][/ROW]
[ROW][C]Section[/C][C]Mean[/C][C]Standard Deviation[/C][C]Range[/C][/ROW]
[ROW][C]1[/C][C]4885.41666666667[/C][C]2210.14139647766[/C][C]6282[/C][/ROW]
[ROW][C]2[/C][C]4014.33333333333[/C][C]2086.80718860757[/C][C]6225[/C][/ROW]
[ROW][C]3[/C][C]4097.5[/C][C]2384.47118208248[/C][C]7777[/C][/ROW]
[ROW][C]4[/C][C]7459.16666666667[/C][C]2075.40860526015[/C][C]6103[/C][/ROW]
[ROW][C]5[/C][C]8225.25[/C][C]1634.9045635199[/C][C]5287[/C][/ROW]
[ROW][C]6[/C][C]4253[/C][C]2461.91721299404[/C][C]6211[/C][/ROW]
[ROW][C]7[/C][C]5619.58333333333[/C][C]2488.84878310264[/C][C]7866[/C][/ROW]
[ROW][C]8[/C][C]9138.66666666667[/C][C]1109.29021805783[/C][C]3333[/C][/ROW]
[ROW][C]9[/C][C]6974.91666666667[/C][C]2475.57109878741[/C][C]7316[/C][/ROW]
[ROW][C]10[/C][C]7746.08333333333[/C][C]2959.24715420949[/C][C]9176[/C][/ROW]
[/TABLE]
Source: https://freestatistics.org/blog/index.php?pk=302653&T=1

Globally Unique Identifier (entire table): ba.freestatistics.org/blog/index.php?pk=302653&T=1

As an alternative you can also use a QR Code:  

The GUIDs for individual cells are displayed in the table below:

Standard Deviation-Mean Plot
SectionMeanStandard DeviationRange
14885.416666666672210.141396477666282
24014.333333333332086.807188607576225
34097.52384.471182082487777
47459.166666666672075.408605260156103
58225.251634.90456351995287
642532461.917212994046211
75619.583333333332488.848783102647866
89138.666666666671109.290218057833333
96974.916666666672475.571098787417316
107746.083333333332959.247154209499176


Regression: S.E.(k) = alpha + beta * Mean(k)
alpha2949.94638617485
beta-0.121973701783646
S.D.0.0855316912490886
T-STAT-1.42606442129654
p-value0.191682943959083

\begin{tabular}{lllllllll}
\hline
Regression: S.E.(k) = alpha + beta * Mean(k) \tabularnewline
alpha & 2949.94638617485 \tabularnewline
beta & -0.121973701783646 \tabularnewline
S.D. & 0.0855316912490886 \tabularnewline
T-STAT & -1.42606442129654 \tabularnewline
p-value & 0.191682943959083 \tabularnewline
\hline
\end{tabular}
%Source: https://freestatistics.org/blog/index.php?pk=302653&T=2

[TABLE]
[ROW][C]Regression: S.E.(k) = alpha + beta * Mean(k)[/C][/ROW]
[ROW][C]alpha[/C][C]2949.94638617485[/C][/ROW]
[ROW][C]beta[/C][C]-0.121973701783646[/C][/ROW]
[ROW][C]S.D.[/C][C]0.0855316912490886[/C][/ROW]
[ROW][C]T-STAT[/C][C]-1.42606442129654[/C][/ROW]
[ROW][C]p-value[/C][C]0.191682943959083[/C][/ROW]
[/TABLE]
Source: https://freestatistics.org/blog/index.php?pk=302653&T=2

Globally Unique Identifier (entire table): ba.freestatistics.org/blog/index.php?pk=302653&T=2

As an alternative you can also use a QR Code:  

The GUIDs for individual cells are displayed in the table below:

Regression: S.E.(k) = alpha + beta * Mean(k)
alpha2949.94638617485
beta-0.121973701783646
S.D.0.0855316912490886
T-STAT-1.42606442129654
p-value0.191682943959083


Regression: ln S.E.(k) = alpha + beta * ln Mean(k)
alpha11.1987450358568
beta-0.406899463325357
S.D.0.276473108720616
T-STAT-1.47175059884953
p-value0.179300139360526
Lambda1.40689946332536

\begin{tabular}{lllllllll}
\hline
Regression: ln S.E.(k) = alpha + beta * ln Mean(k) \tabularnewline
alpha & 11.1987450358568 \tabularnewline
beta & -0.406899463325357 \tabularnewline
S.D. & 0.276473108720616 \tabularnewline
T-STAT & -1.47175059884953 \tabularnewline
p-value & 0.179300139360526 \tabularnewline
Lambda & 1.40689946332536 \tabularnewline
\hline
\end{tabular}
%Source: https://freestatistics.org/blog/index.php?pk=302653&T=3

[TABLE]
[ROW][C]Regression: ln S.E.(k) = alpha + beta * ln Mean(k)[/C][/ROW]
[ROW][C]alpha[/C][C]11.1987450358568[/C][/ROW]
[ROW][C]beta[/C][C]-0.406899463325357[/C][/ROW]
[ROW][C]S.D.[/C][C]0.276473108720616[/C][/ROW]
[ROW][C]T-STAT[/C][C]-1.47175059884953[/C][/ROW]
[ROW][C]p-value[/C][C]0.179300139360526[/C][/ROW]
[ROW][C]Lambda[/C][C]1.40689946332536[/C][/ROW]
[/TABLE]
Source: https://freestatistics.org/blog/index.php?pk=302653&T=3

Globally Unique Identifier (entire table): ba.freestatistics.org/blog/index.php?pk=302653&T=3

As an alternative you can also use a QR Code:  

The GUIDs for individual cells are displayed in the table below:

Regression: ln S.E.(k) = alpha + beta * ln Mean(k)
alpha11.1987450358568
beta-0.406899463325357
S.D.0.276473108720616
T-STAT-1.47175059884953
p-value0.179300139360526
Lambda1.40689946332536


Parameters (Session):
par1 = 1 ; par2 = 1 ; par3 = 1 ; par4 = 12 ;
Parameters (R input):
par1 = 12 ;
R code (references can be found in the software module):
par1 <- as.numeric(par1)
(n <- length(x))
(np <- floor(n / par1))
arr <- array(NA,dim=c(par1,np))
j <- 0
k <- 1
for (i in 1:(np*par1))
{
j = j + 1
arr[j,k] <- x[i]
if (j == par1) {
j = 0
k=k+1
}
}
arr
arr.mean <- array(NA,dim=np)
arr.sd <- array(NA,dim=np)
arr.range <- array(NA,dim=np)
for (j in 1:np)
{
arr.mean[j] <- mean(arr[,j],na.rm=TRUE)
arr.sd[j] <- sd(arr[,j],na.rm=TRUE)
arr.range[j] <- max(arr[,j],na.rm=TRUE) - min(arr[,j],na.rm=TRUE)
}
arr.mean
arr.sd
arr.range
(lm1 <- lm(arr.sd~arr.mean))
(lnlm1 <- lm(log(arr.sd)~log(arr.mean)))
(lm2 <- lm(arr.range~arr.mean))
bitmap(file='test1.png')
plot(arr.mean,arr.sd,main='Standard Deviation-Mean Plot',xlab='mean',ylab='standard deviation')
dev.off()
bitmap(file='test2.png')
plot(arr.mean,arr.range,main='Range-Mean Plot',xlab='mean',ylab='range')
dev.off()
load(file='createtable')
a<-table.start()
a<-table.row.start(a)
a<-table.element(a,'Standard Deviation-Mean Plot',4,TRUE)
a<-table.row.end(a)
a<-table.row.start(a)
a<-table.element(a,'Section',header=TRUE)
a<-table.element(a,'Mean',header=TRUE)
a<-table.element(a,'Standard Deviation',header=TRUE)
a<-table.element(a,'Range',header=TRUE)
a<-table.row.end(a)
for (j in 1:np) {
a<-table.row.start(a)
a<-table.element(a,j,header=TRUE)
a<-table.element(a,arr.mean[j])
a<-table.element(a,arr.sd[j] )
a<-table.element(a,arr.range[j] )
a<-table.row.end(a)
}
a<-table.end(a)
table.save(a,file='mytable.tab')
a<-table.start()
a<-table.row.start(a)
a<-table.element(a,'Regression: S.E.(k) = alpha + beta * Mean(k)',2,TRUE)
a<-table.row.end(a)
a<-table.row.start(a)
a<-table.element(a,'alpha',header=TRUE)
a<-table.element(a,lm1$coefficients[[1]])
a<-table.row.end(a)
a<-table.row.start(a)
a<-table.element(a,'beta',header=TRUE)
a<-table.element(a,lm1$coefficients[[2]])
a<-table.row.end(a)
a<-table.row.start(a)
a<-table.element(a,'S.D.',header=TRUE)
a<-table.element(a,summary(lm1)$coefficients[2,2])
a<-table.row.end(a)
a<-table.row.start(a)
a<-table.element(a,'T-STAT',header=TRUE)
a<-table.element(a,summary(lm1)$coefficients[2,3])
a<-table.row.end(a)
a<-table.row.start(a)
a<-table.element(a,'p-value',header=TRUE)
a<-table.element(a,summary(lm1)$coefficients[2,4])
a<-table.row.end(a)
a<-table.end(a)
table.save(a,file='mytable1.tab')
a<-table.start()
a<-table.row.start(a)
a<-table.element(a,'Regression: ln S.E.(k) = alpha + beta * ln Mean(k)',2,TRUE)
a<-table.row.end(a)
a<-table.row.start(a)
a<-table.element(a,'alpha',header=TRUE)
a<-table.element(a,lnlm1$coefficients[[1]])
a<-table.row.end(a)
a<-table.row.start(a)
a<-table.element(a,'beta',header=TRUE)
a<-table.element(a,lnlm1$coefficients[[2]])
a<-table.row.end(a)
a<-table.row.start(a)
a<-table.element(a,'S.D.',header=TRUE)
a<-table.element(a,summary(lnlm1)$coefficients[2,2])
a<-table.row.end(a)
a<-table.row.start(a)
a<-table.element(a,'T-STAT',header=TRUE)
a<-table.element(a,summary(lnlm1)$coefficients[2,3])
a<-table.row.end(a)
a<-table.row.start(a)
a<-table.element(a,'p-value',header=TRUE)
a<-table.element(a,summary(lnlm1)$coefficients[2,4])
a<-table.row.end(a)
a<-table.row.start(a)
a<-table.element(a,'Lambda',header=TRUE)
a<-table.element(a,1-lnlm1$coefficients[[2]])
a<-table.row.end(a)
a<-table.end(a)
table.save(a,file='mytable2.tab')