Free Statistics

of Irreproducible Research!

Author's title

Author*The author of this computation has been verified*
R Software Modulerwasp_autocorrelation.wasp
Title produced by software(Partial) Autocorrelation Function
Date of computationThu, 22 Dec 2016 21:33:43 +0100
Cite this page as followsStatistical Computations at FreeStatistics.org, Office for Research Development and Education, URL https://freestatistics.org/blog/index.php?v=date/2016/Dec/22/t1482438924zfk44hqe9reablp.htm/, Retrieved Sun, 28 Apr 2024 19:36:04 +0000
Statistical Computations at FreeStatistics.org, Office for Research Development and Education, URL https://freestatistics.org/blog/index.php?pk=302683, Retrieved Sun, 28 Apr 2024 19:36:04 +0000
QR Codes:

Original text written by user:
IsPrivate?No (this computation is public)
User-defined keywords
Estimated Impact71
Family? (F = Feedback message, R = changed R code, M = changed R Module, P = changed Parameters, D = changed Data)
-       [(Partial) Autocorrelation Function] [] [2016-12-22 20:33:43] [2802fcbee976b89d2ab84425d3d65dcf] [Current]
Feedback Forum

Post a new message
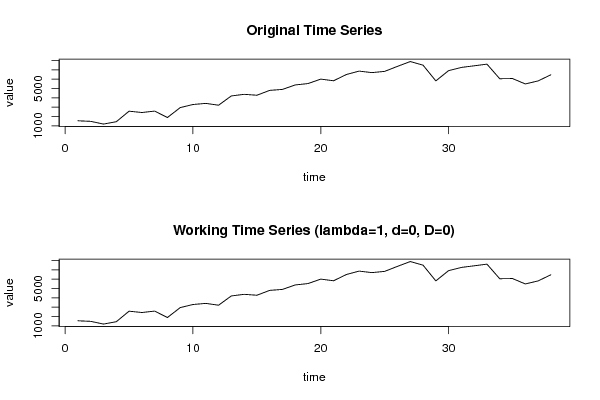
Dataseries X:
1550.61
1488.54
1200.03
1451.49
2576.19
2434.2
2586.21
1898.55
2958.18
3290.73
3408.39
3214.71
4205.43
4378.53
4279.68
4799.25
4902.84
5379.84
5527.05
6004.83
5827.71
6496.02
6858.99
6696.84
6831
7366.47
7881.03
7494.66
5813.55
6911.25
7252.59
7425.63
7603.5
6045.72
6064.35
5486.85
5808.27
6467.88


Summary of computational transaction
Raw Input view raw input (R code)
Raw Outputview raw output of R engine
Computing time1 seconds
R ServerBig Analytics Cloud Computing Center

\begin{tabular}{lllllllll}
\hline
Summary of computational transaction \tabularnewline
Raw Input view raw input (R code)  \tabularnewline
Raw Outputview raw output of R engine  \tabularnewline
Computing time1 seconds \tabularnewline
R ServerBig Analytics Cloud Computing Center \tabularnewline
\hline
\end{tabular}
%Source: https://freestatistics.org/blog/index.php?pk=302683&T=0

[TABLE]
[ROW]
Summary of computational transaction[/C][/ROW] [ROW]Raw Input[/C] view raw input (R code) [/C][/ROW] [ROW]Raw Output[/C]view raw output of R engine [/C][/ROW] [ROW]Computing time[/C]1 seconds[/C][/ROW] [ROW]R Server[/C]Big Analytics Cloud Computing Center[/C][/ROW] [/TABLE] Source: https://freestatistics.org/blog/index.php?pk=302683&T=0

Globally Unique Identifier (entire table): ba.freestatistics.org/blog/index.php?pk=302683&T=0

As an alternative you can also use a QR Code:  

The GUIDs for individual cells are displayed in the table below:

Summary of computational transaction
Raw Input view raw input (R code)
Raw Outputview raw output of R engine
Computing time1 seconds
R ServerBig Analytics Cloud Computing Center


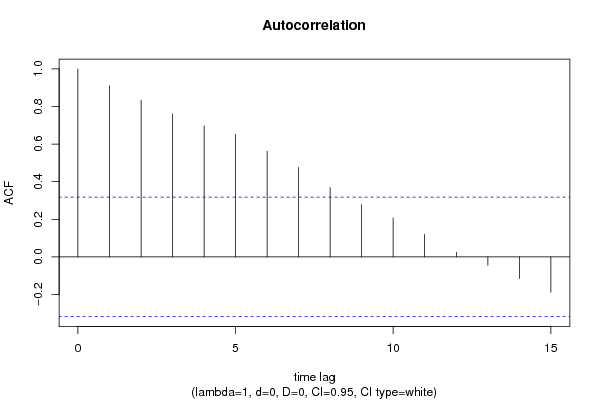
Autocorrelation Function
Time lag kACF(k)T-STATP-value
10.910625.61341e-06
20.8339655.14094e-06
30.76044.68741.8e-05
40.6962634.29215.9e-05
50.6520394.01940.000133
60.5617443.46280.000669
70.4762.93430.002822
80.3685062.27160.014428
90.277761.71220.047502
100.2067151.27430.105151
110.1207060.74410.230702
120.0242410.14940.441003
13-0.044692-0.27550.392213
14-0.115296-0.71070.240795
15-0.187465-1.15560.127527

\begin{tabular}{lllllllll}
\hline
Autocorrelation Function \tabularnewline
Time lag k & ACF(k) & T-STAT & P-value \tabularnewline
1 & 0.91062 & 5.6134 & 1e-06 \tabularnewline
2 & 0.833965 & 5.1409 & 4e-06 \tabularnewline
3 & 0.7604 & 4.6874 & 1.8e-05 \tabularnewline
4 & 0.696263 & 4.2921 & 5.9e-05 \tabularnewline
5 & 0.652039 & 4.0194 & 0.000133 \tabularnewline
6 & 0.561744 & 3.4628 & 0.000669 \tabularnewline
7 & 0.476 & 2.9343 & 0.002822 \tabularnewline
8 & 0.368506 & 2.2716 & 0.014428 \tabularnewline
9 & 0.27776 & 1.7122 & 0.047502 \tabularnewline
10 & 0.206715 & 1.2743 & 0.105151 \tabularnewline
11 & 0.120706 & 0.7441 & 0.230702 \tabularnewline
12 & 0.024241 & 0.1494 & 0.441003 \tabularnewline
13 & -0.044692 & -0.2755 & 0.392213 \tabularnewline
14 & -0.115296 & -0.7107 & 0.240795 \tabularnewline
15 & -0.187465 & -1.1556 & 0.127527 \tabularnewline
\hline
\end{tabular}
%Source: https://freestatistics.org/blog/index.php?pk=302683&T=1

[TABLE]
[ROW][C]Autocorrelation Function[/C][/ROW]
[ROW][C]Time lag k[/C][C]ACF(k)[/C][C]T-STAT[/C][C]P-value[/C][/ROW]
[ROW][C]1[/C][C]0.91062[/C][C]5.6134[/C][C]1e-06[/C][/ROW]
[ROW][C]2[/C][C]0.833965[/C][C]5.1409[/C][C]4e-06[/C][/ROW]
[ROW][C]3[/C][C]0.7604[/C][C]4.6874[/C][C]1.8e-05[/C][/ROW]
[ROW][C]4[/C][C]0.696263[/C][C]4.2921[/C][C]5.9e-05[/C][/ROW]
[ROW][C]5[/C][C]0.652039[/C][C]4.0194[/C][C]0.000133[/C][/ROW]
[ROW][C]6[/C][C]0.561744[/C][C]3.4628[/C][C]0.000669[/C][/ROW]
[ROW][C]7[/C][C]0.476[/C][C]2.9343[/C][C]0.002822[/C][/ROW]
[ROW][C]8[/C][C]0.368506[/C][C]2.2716[/C][C]0.014428[/C][/ROW]
[ROW][C]9[/C][C]0.27776[/C][C]1.7122[/C][C]0.047502[/C][/ROW]
[ROW][C]10[/C][C]0.206715[/C][C]1.2743[/C][C]0.105151[/C][/ROW]
[ROW][C]11[/C][C]0.120706[/C][C]0.7441[/C][C]0.230702[/C][/ROW]
[ROW][C]12[/C][C]0.024241[/C][C]0.1494[/C][C]0.441003[/C][/ROW]
[ROW][C]13[/C][C]-0.044692[/C][C]-0.2755[/C][C]0.392213[/C][/ROW]
[ROW][C]14[/C][C]-0.115296[/C][C]-0.7107[/C][C]0.240795[/C][/ROW]
[ROW][C]15[/C][C]-0.187465[/C][C]-1.1556[/C][C]0.127527[/C][/ROW]
[/TABLE]
Source: https://freestatistics.org/blog/index.php?pk=302683&T=1

Globally Unique Identifier (entire table): ba.freestatistics.org/blog/index.php?pk=302683&T=1

As an alternative you can also use a QR Code:  

The GUIDs for individual cells are displayed in the table below:

Autocorrelation Function
Time lag kACF(k)T-STATP-value
10.910625.61341e-06
20.8339655.14094e-06
30.76044.68741.8e-05
40.6962634.29215.9e-05
50.6520394.01940.000133
60.5617443.46280.000669
70.4762.93430.002822
80.3685062.27160.014428
90.277761.71220.047502
100.2067151.27430.105151
110.1207060.74410.230702
120.0242410.14940.441003
13-0.044692-0.27550.392213
14-0.115296-0.71070.240795
15-0.187465-1.15560.127527


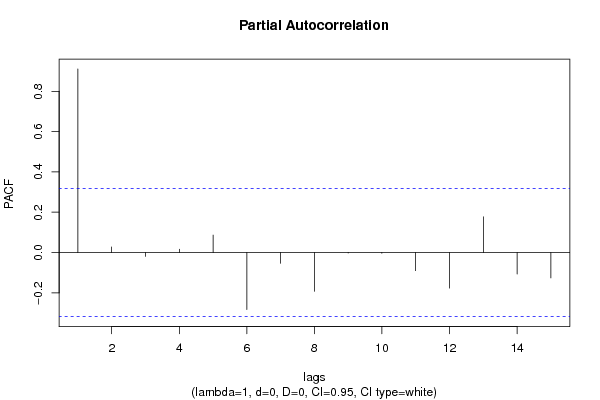
Partial Autocorrelation Function
Time lag kPACF(k)T-STATP-value
10.910625.61341e-06
20.0277350.1710.432578
3-0.018856-0.11620.454039
40.0161370.09950.460643
50.0863780.53250.298751
6-0.282429-1.7410.044887
7-0.053442-0.32940.371817
8-0.191797-1.18230.122213
9-0.002412-0.01490.494108
10-0.003949-0.02430.490352
11-0.089585-0.55220.292008
12-0.176341-1.0870.141933
130.1771721.09220.140819
14-0.106096-0.6540.25852
15-0.125845-0.77580.221346

\begin{tabular}{lllllllll}
\hline
Partial Autocorrelation Function \tabularnewline
Time lag k & PACF(k) & T-STAT & P-value \tabularnewline
1 & 0.91062 & 5.6134 & 1e-06 \tabularnewline
2 & 0.027735 & 0.171 & 0.432578 \tabularnewline
3 & -0.018856 & -0.1162 & 0.454039 \tabularnewline
4 & 0.016137 & 0.0995 & 0.460643 \tabularnewline
5 & 0.086378 & 0.5325 & 0.298751 \tabularnewline
6 & -0.282429 & -1.741 & 0.044887 \tabularnewline
7 & -0.053442 & -0.3294 & 0.371817 \tabularnewline
8 & -0.191797 & -1.1823 & 0.122213 \tabularnewline
9 & -0.002412 & -0.0149 & 0.494108 \tabularnewline
10 & -0.003949 & -0.0243 & 0.490352 \tabularnewline
11 & -0.089585 & -0.5522 & 0.292008 \tabularnewline
12 & -0.176341 & -1.087 & 0.141933 \tabularnewline
13 & 0.177172 & 1.0922 & 0.140819 \tabularnewline
14 & -0.106096 & -0.654 & 0.25852 \tabularnewline
15 & -0.125845 & -0.7758 & 0.221346 \tabularnewline
\hline
\end{tabular}
%Source: https://freestatistics.org/blog/index.php?pk=302683&T=2

[TABLE]
[ROW][C]Partial Autocorrelation Function[/C][/ROW]
[ROW][C]Time lag k[/C][C]PACF(k)[/C][C]T-STAT[/C][C]P-value[/C][/ROW]
[ROW][C]1[/C][C]0.91062[/C][C]5.6134[/C][C]1e-06[/C][/ROW]
[ROW][C]2[/C][C]0.027735[/C][C]0.171[/C][C]0.432578[/C][/ROW]
[ROW][C]3[/C][C]-0.018856[/C][C]-0.1162[/C][C]0.454039[/C][/ROW]
[ROW][C]4[/C][C]0.016137[/C][C]0.0995[/C][C]0.460643[/C][/ROW]
[ROW][C]5[/C][C]0.086378[/C][C]0.5325[/C][C]0.298751[/C][/ROW]
[ROW][C]6[/C][C]-0.282429[/C][C]-1.741[/C][C]0.044887[/C][/ROW]
[ROW][C]7[/C][C]-0.053442[/C][C]-0.3294[/C][C]0.371817[/C][/ROW]
[ROW][C]8[/C][C]-0.191797[/C][C]-1.1823[/C][C]0.122213[/C][/ROW]
[ROW][C]9[/C][C]-0.002412[/C][C]-0.0149[/C][C]0.494108[/C][/ROW]
[ROW][C]10[/C][C]-0.003949[/C][C]-0.0243[/C][C]0.490352[/C][/ROW]
[ROW][C]11[/C][C]-0.089585[/C][C]-0.5522[/C][C]0.292008[/C][/ROW]
[ROW][C]12[/C][C]-0.176341[/C][C]-1.087[/C][C]0.141933[/C][/ROW]
[ROW][C]13[/C][C]0.177172[/C][C]1.0922[/C][C]0.140819[/C][/ROW]
[ROW][C]14[/C][C]-0.106096[/C][C]-0.654[/C][C]0.25852[/C][/ROW]
[ROW][C]15[/C][C]-0.125845[/C][C]-0.7758[/C][C]0.221346[/C][/ROW]
[/TABLE]
Source: https://freestatistics.org/blog/index.php?pk=302683&T=2

Globally Unique Identifier (entire table): ba.freestatistics.org/blog/index.php?pk=302683&T=2

As an alternative you can also use a QR Code:  

The GUIDs for individual cells are displayed in the table below:

Partial Autocorrelation Function
Time lag kPACF(k)T-STATP-value
10.910625.61341e-06
20.0277350.1710.432578
3-0.018856-0.11620.454039
40.0161370.09950.460643
50.0863780.53250.298751
6-0.282429-1.7410.044887
7-0.053442-0.32940.371817
8-0.191797-1.18230.122213
9-0.002412-0.01490.494108
10-0.003949-0.02430.490352
11-0.089585-0.55220.292008
12-0.176341-1.0870.141933
130.1771721.09220.140819
14-0.106096-0.6540.25852
15-0.125845-0.77580.221346


Parameters (Session):
par1 = Default ; par2 = 1 ; par3 = 0 ; par4 = 0 ; par5 = 12 ; par6 = White Noise ; par7 = 0.95 ;
Parameters (R input):
par1 = Default ; par2 = 1 ; par3 = 0 ; par4 = 0 ; par5 = 12 ; par6 = White Noise ; par7 = 0.95 ; par8 = ;
R code (references can be found in the software module):
if (par1 == 'Default') {
par1 = 10*log10(length(x))
} else {
par1 <- as.numeric(par1)
}
par2 <- as.numeric(par2)
par3 <- as.numeric(par3)
par4 <- as.numeric(par4)
par5 <- as.numeric(par5)
if (par6 == 'White Noise') par6 <- 'white' else par6 <- 'ma'
par7 <- as.numeric(par7)
if (par8 != '') par8 <- as.numeric(par8)
x <- na.omit(x)
ox <- x
if (par8 == '') {
if (par2 == 0) {
x <- log(x)
} else {
x <- (x ^ par2 - 1) / par2
}
} else {
x <- log(x,base=par8)
}
if (par3 > 0) x <- diff(x,lag=1,difference=par3)
if (par4 > 0) x <- diff(x,lag=par5,difference=par4)
bitmap(file='picts.png')
op <- par(mfrow=c(2,1))
plot(ox,type='l',main='Original Time Series',xlab='time',ylab='value')
if (par8=='') {
mytitle <- paste('Working Time Series (lambda=',par2,', d=',par3,', D=',par4,')',sep='')
mysub <- paste('(lambda=',par2,', d=',par3,', D=',par4,', CI=', par7, ', CI type=',par6,')',sep='')
} else {
mytitle <- paste('Working Time Series (base=',par8,', d=',par3,', D=',par4,')',sep='')
mysub <- paste('(base=',par8,', d=',par3,', D=',par4,', CI=', par7, ', CI type=',par6,')',sep='')
}
plot(x,type='l', main=mytitle,xlab='time',ylab='value')
par(op)
dev.off()
bitmap(file='pic1.png')
racf <- acf(x, par1, main='Autocorrelation', xlab='time lag', ylab='ACF', ci.type=par6, ci=par7, sub=mysub)
dev.off()
bitmap(file='pic2.png')
rpacf <- pacf(x,par1,main='Partial Autocorrelation',xlab='lags',ylab='PACF',sub=mysub)
dev.off()
(myacf <- c(racf$acf))
(mypacf <- c(rpacf$acf))
lengthx <- length(x)
sqrtn <- sqrt(lengthx)
load(file='createtable')
a<-table.start()
a<-table.row.start(a)
a<-table.element(a,'Autocorrelation Function',4,TRUE)
a<-table.row.end(a)
a<-table.row.start(a)
a<-table.element(a,'Time lag k',header=TRUE)
a<-table.element(a,'ACF(k)',header=TRUE)
a<-table.element(a,'T-STAT',header=TRUE)
a<-table.element(a,'P-value',header=TRUE)
a<-table.row.end(a)
for (i in 2:(par1+1)) {
a<-table.row.start(a)
a<-table.element(a,i-1,header=TRUE)
a<-table.element(a,round(myacf[i],6))
mytstat <- myacf[i]*sqrtn
a<-table.element(a,round(mytstat,4))
a<-table.element(a,round(1-pt(abs(mytstat),lengthx),6))
a<-table.row.end(a)
}
a<-table.end(a)
table.save(a,file='mytable.tab')
a<-table.start()
a<-table.row.start(a)
a<-table.element(a,'Partial Autocorrelation Function',4,TRUE)
a<-table.row.end(a)
a<-table.row.start(a)
a<-table.element(a,'Time lag k',header=TRUE)
a<-table.element(a,'PACF(k)',header=TRUE)
a<-table.element(a,'T-STAT',header=TRUE)
a<-table.element(a,'P-value',header=TRUE)
a<-table.row.end(a)
for (i in 1:par1) {
a<-table.row.start(a)
a<-table.element(a,i,header=TRUE)
a<-table.element(a,round(mypacf[i],6))
mytstat <- mypacf[i]*sqrtn
a<-table.element(a,round(mytstat,4))
a<-table.element(a,round(1-pt(abs(mytstat),lengthx),6))
a<-table.row.end(a)
}
a<-table.end(a)
table.save(a,file='mytable1.tab')