Free Statistics

of Irreproducible Research!

Author's title

Author*The author of this computation has been verified*
R Software Modulerwasp_exponentialsmoothing.wasp
Title produced by softwareExponential Smoothing
Date of computationThu, 22 Dec 2016 22:39:42 +0100
Cite this page as followsStatistical Computations at FreeStatistics.org, Office for Research Development and Education, URL https://freestatistics.org/blog/index.php?v=date/2016/Dec/22/t1482442801m0w72bjzg5tj70o.htm/, Retrieved Mon, 29 Apr 2024 00:09:14 +0000
Statistical Computations at FreeStatistics.org, Office for Research Development and Education, URL https://freestatistics.org/blog/index.php?pk=302698, Retrieved Mon, 29 Apr 2024 00:09:14 +0000
QR Codes:

Original text written by user:
IsPrivate?No (this computation is public)
User-defined keywords
Estimated Impact44
Family? (F = Feedback message, R = changed R code, M = changed R Module, P = changed Parameters, D = changed Data)
-       [Exponential Smoothing] [expon sm dash] [2016-12-22 21:39:42] [d92250bd36540c2281a4ec15b45df1dd] [Current]
Feedback Forum

Post a new message
Dataseries X:
4511.15
4497.61
4497.61
4524.68
4569.79
4596.85
4614.9
4632.94
4660.02
4714.15
4772.79
4817.9
4872.04
4926.17
4971.28
5020.9
5066.02
5088.57
5084.06
5066.02


Summary of computational transaction
Raw Input view raw input (R code)
Raw Outputview raw output of R engine
Computing time2 seconds
R ServerBig Analytics Cloud Computing Center

\begin{tabular}{lllllllll}
\hline
Summary of computational transaction \tabularnewline
Raw Input view raw input (R code)  \tabularnewline
Raw Outputview raw output of R engine  \tabularnewline
Computing time2 seconds \tabularnewline
R ServerBig Analytics Cloud Computing Center \tabularnewline
\hline
\end{tabular}
%Source: https://freestatistics.org/blog/index.php?pk=302698&T=0

[TABLE]
[ROW]
Summary of computational transaction[/C][/ROW] [ROW]Raw Input[/C] view raw input (R code) [/C][/ROW] [ROW]Raw Output[/C]view raw output of R engine [/C][/ROW] [ROW]Computing time[/C]2 seconds[/C][/ROW] [ROW]R Server[/C]Big Analytics Cloud Computing Center[/C][/ROW] [/TABLE] Source: https://freestatistics.org/blog/index.php?pk=302698&T=0

Globally Unique Identifier (entire table): ba.freestatistics.org/blog/index.php?pk=302698&T=0

As an alternative you can also use a QR Code:  

The GUIDs for individual cells are displayed in the table below:

Summary of computational transaction
Raw Input view raw input (R code)
Raw Outputview raw output of R engine
Computing time2 seconds
R ServerBig Analytics Cloud Computing Center


Estimated Parameters of Exponential Smoothing
ParameterValue
alpha1
beta0
gamma0.1

\begin{tabular}{lllllllll}
\hline
Estimated Parameters of Exponential Smoothing \tabularnewline
Parameter & Value \tabularnewline
alpha & 1 \tabularnewline
beta & 0 \tabularnewline
gamma & 0.1 \tabularnewline
\hline
\end{tabular}
%Source: https://freestatistics.org/blog/index.php?pk=302698&T=1

[TABLE]
[ROW][C]Estimated Parameters of Exponential Smoothing[/C][/ROW]
[ROW][C]Parameter[/C][C]Value[/C][/ROW]
[ROW][C]alpha[/C][C]1[/C][/ROW]
[ROW][C]beta[/C][C]0[/C][/ROW]
[ROW][C]gamma[/C][C]0.1[/C][/ROW]
[/TABLE]
Source: https://freestatistics.org/blog/index.php?pk=302698&T=1

Globally Unique Identifier (entire table): ba.freestatistics.org/blog/index.php?pk=302698&T=1

As an alternative you can also use a QR Code:  

The GUIDs for individual cells are displayed in the table below:

Estimated Parameters of Exponential Smoothing
ParameterValue
alpha1
beta0
gamma0.1


Interpolation Forecasts of Exponential Smoothing
tObservedFittedResiduals
114772.794582.90184090909189.888159090909
124817.94814.644824242423.25517575757658
134872.044867.205824242424.83417575757721
144926.174922.689824242423.48017575757513
154971.284972.98782424242-1.70782424242407
165020.94993.2828242424327.6171757575739
175066.025050.3568242424215.6631757575778
185088.575089.82732424243-1.25732424242597
195084.065117.35732424242-33.2973242424223
205066.025138.54432424242-72.524324242424

\begin{tabular}{lllllllll}
\hline
Interpolation Forecasts of Exponential Smoothing \tabularnewline
t & Observed & Fitted & Residuals \tabularnewline
11 & 4772.79 & 4582.90184090909 & 189.888159090909 \tabularnewline
12 & 4817.9 & 4814.64482424242 & 3.25517575757658 \tabularnewline
13 & 4872.04 & 4867.20582424242 & 4.83417575757721 \tabularnewline
14 & 4926.17 & 4922.68982424242 & 3.48017575757513 \tabularnewline
15 & 4971.28 & 4972.98782424242 & -1.70782424242407 \tabularnewline
16 & 5020.9 & 4993.28282424243 & 27.6171757575739 \tabularnewline
17 & 5066.02 & 5050.35682424242 & 15.6631757575778 \tabularnewline
18 & 5088.57 & 5089.82732424243 & -1.25732424242597 \tabularnewline
19 & 5084.06 & 5117.35732424242 & -33.2973242424223 \tabularnewline
20 & 5066.02 & 5138.54432424242 & -72.524324242424 \tabularnewline
\hline
\end{tabular}
%Source: https://freestatistics.org/blog/index.php?pk=302698&T=2

[TABLE]
[ROW][C]Interpolation Forecasts of Exponential Smoothing[/C][/ROW]
[ROW][C]t[/C][C]Observed[/C][C]Fitted[/C][C]Residuals[/C][/ROW]
[ROW][C]11[/C][C]4772.79[/C][C]4582.90184090909[/C][C]189.888159090909[/C][/ROW]
[ROW][C]12[/C][C]4817.9[/C][C]4814.64482424242[/C][C]3.25517575757658[/C][/ROW]
[ROW][C]13[/C][C]4872.04[/C][C]4867.20582424242[/C][C]4.83417575757721[/C][/ROW]
[ROW][C]14[/C][C]4926.17[/C][C]4922.68982424242[/C][C]3.48017575757513[/C][/ROW]
[ROW][C]15[/C][C]4971.28[/C][C]4972.98782424242[/C][C]-1.70782424242407[/C][/ROW]
[ROW][C]16[/C][C]5020.9[/C][C]4993.28282424243[/C][C]27.6171757575739[/C][/ROW]
[ROW][C]17[/C][C]5066.02[/C][C]5050.35682424242[/C][C]15.6631757575778[/C][/ROW]
[ROW][C]18[/C][C]5088.57[/C][C]5089.82732424243[/C][C]-1.25732424242597[/C][/ROW]
[ROW][C]19[/C][C]5084.06[/C][C]5117.35732424242[/C][C]-33.2973242424223[/C][/ROW]
[ROW][C]20[/C][C]5066.02[/C][C]5138.54432424242[/C][C]-72.524324242424[/C][/ROW]
[/TABLE]
Source: https://freestatistics.org/blog/index.php?pk=302698&T=2

Globally Unique Identifier (entire table): ba.freestatistics.org/blog/index.php?pk=302698&T=2

As an alternative you can also use a QR Code:  

The GUIDs for individual cells are displayed in the table below:

Interpolation Forecasts of Exponential Smoothing
tObservedFittedResiduals
114772.794582.90184090909189.888159090909
124817.94814.644824242423.25517575757658
134872.044867.205824242424.83417575757721
144926.174922.689824242423.48017575757513
154971.284972.98782424242-1.70782424242407
165020.94993.2828242424327.6171757575739
175066.025050.3568242424215.6631757575778
185088.575089.82732424243-1.25732424242597
195084.065117.35732424242-33.2973242424223
205066.025138.54432424242-72.524324242424


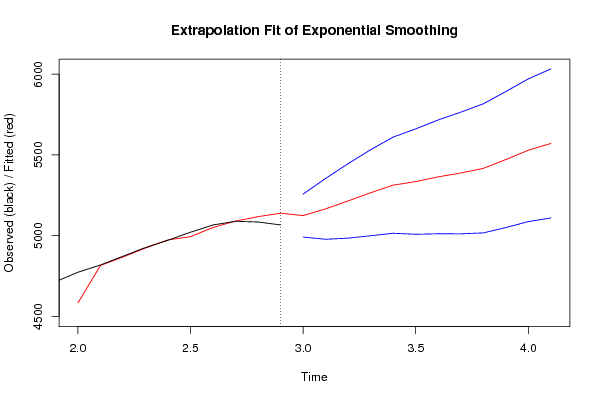
Extrapolation Forecasts of Exponential Smoothing
tForecast95% Lower Bound95% Upper Bound
215123.886324242424990.57619699175257.19645149315
225165.741148484854977.21215852525354.2701384445
235215.046972727274984.147059165555445.94688628899
245265.69679696974999.076542468265532.31705147114
255312.514621212125014.424114590365610.60512783388
265334.517445454555007.975656144795661.05923476431
275363.974269696975011.268825745195716.67971364875
285387.78159393945010.723614020095764.8395738587
295416.568918181825016.638536429665816.49929993398
305471.053242424245049.489605145095892.6168797034
315528.919566666675086.77989382155971.05923951184
325570.774390909095108.974563785656032.57421803253

\begin{tabular}{lllllllll}
\hline
Extrapolation Forecasts of Exponential Smoothing \tabularnewline
t & Forecast & 95% Lower Bound & 95% Upper Bound \tabularnewline
21 & 5123.88632424242 & 4990.5761969917 & 5257.19645149315 \tabularnewline
22 & 5165.74114848485 & 4977.2121585252 & 5354.2701384445 \tabularnewline
23 & 5215.04697272727 & 4984.14705916555 & 5445.94688628899 \tabularnewline
24 & 5265.6967969697 & 4999.07654246826 & 5532.31705147114 \tabularnewline
25 & 5312.51462121212 & 5014.42411459036 & 5610.60512783388 \tabularnewline
26 & 5334.51744545455 & 5007.97565614479 & 5661.05923476431 \tabularnewline
27 & 5363.97426969697 & 5011.26882574519 & 5716.67971364875 \tabularnewline
28 & 5387.7815939394 & 5010.72361402009 & 5764.8395738587 \tabularnewline
29 & 5416.56891818182 & 5016.63853642966 & 5816.49929993398 \tabularnewline
30 & 5471.05324242424 & 5049.48960514509 & 5892.6168797034 \tabularnewline
31 & 5528.91956666667 & 5086.7798938215 & 5971.05923951184 \tabularnewline
32 & 5570.77439090909 & 5108.97456378565 & 6032.57421803253 \tabularnewline
\hline
\end{tabular}
%Source: https://freestatistics.org/blog/index.php?pk=302698&T=3

[TABLE]
[ROW][C]Extrapolation Forecasts of Exponential Smoothing[/C][/ROW]
[ROW][C]t[/C][C]Forecast[/C][C]95% Lower Bound[/C][C]95% Upper Bound[/C][/ROW]
[ROW][C]21[/C][C]5123.88632424242[/C][C]4990.5761969917[/C][C]5257.19645149315[/C][/ROW]
[ROW][C]22[/C][C]5165.74114848485[/C][C]4977.2121585252[/C][C]5354.2701384445[/C][/ROW]
[ROW][C]23[/C][C]5215.04697272727[/C][C]4984.14705916555[/C][C]5445.94688628899[/C][/ROW]
[ROW][C]24[/C][C]5265.6967969697[/C][C]4999.07654246826[/C][C]5532.31705147114[/C][/ROW]
[ROW][C]25[/C][C]5312.51462121212[/C][C]5014.42411459036[/C][C]5610.60512783388[/C][/ROW]
[ROW][C]26[/C][C]5334.51744545455[/C][C]5007.97565614479[/C][C]5661.05923476431[/C][/ROW]
[ROW][C]27[/C][C]5363.97426969697[/C][C]5011.26882574519[/C][C]5716.67971364875[/C][/ROW]
[ROW][C]28[/C][C]5387.7815939394[/C][C]5010.72361402009[/C][C]5764.8395738587[/C][/ROW]
[ROW][C]29[/C][C]5416.56891818182[/C][C]5016.63853642966[/C][C]5816.49929993398[/C][/ROW]
[ROW][C]30[/C][C]5471.05324242424[/C][C]5049.48960514509[/C][C]5892.6168797034[/C][/ROW]
[ROW][C]31[/C][C]5528.91956666667[/C][C]5086.7798938215[/C][C]5971.05923951184[/C][/ROW]
[ROW][C]32[/C][C]5570.77439090909[/C][C]5108.97456378565[/C][C]6032.57421803253[/C][/ROW]
[/TABLE]
Source: https://freestatistics.org/blog/index.php?pk=302698&T=3

Globally Unique Identifier (entire table): ba.freestatistics.org/blog/index.php?pk=302698&T=3

As an alternative you can also use a QR Code:  

The GUIDs for individual cells are displayed in the table below:

Extrapolation Forecasts of Exponential Smoothing
tForecast95% Lower Bound95% Upper Bound
215123.886324242424990.57619699175257.19645149315
225165.741148484854977.21215852525354.2701384445
235215.046972727274984.147059165555445.94688628899
245265.69679696974999.076542468265532.31705147114
255312.514621212125014.424114590365610.60512783388
265334.517445454555007.975656144795661.05923476431
275363.974269696975011.268825745195716.67971364875
285387.78159393945010.723614020095764.8395738587
295416.568918181825016.638536429665816.49929993398
305471.053242424245049.489605145095892.6168797034
315528.919566666675086.77989382155971.05923951184
325570.774390909095108.974563785656032.57421803253


Parameters (Session):
par1 = 1 ; par2 = 2 ; par3 = 2 ; par4 = 1 ;
Parameters (R input):
par1 = 10 ; par2 = Triple ; par3 = additive ; par4 = 12 ;
R code (references can be found in the software module):
par4 <- '12'
par3 <- 'additive'
par2 <- 'Triple'
par1 <- '11'
par1 <- as.numeric(par1)
par4 <- as.numeric(par4)
if (par2 == 'Single') K <- 1
if (par2 == 'Double') K <- 2
if (par2 == 'Triple') K <- par1
nx <- length(x)
nxmK <- nx - K
x <- ts(x, frequency = par1)
if (par2 == 'Single') fit <- HoltWinters(x, gamma=F, beta=F)
if (par2 == 'Double') fit <- HoltWinters(x, gamma=F)
if (par2 == 'Triple') fit <- HoltWinters(x, seasonal=par3)
fit
myresid <- x - fit$fitted[,'xhat']
bitmap(file='test1.png')
op <- par(mfrow=c(2,1))
plot(fit,ylab='Observed (black) / Fitted (red)',main='Interpolation Fit of Exponential Smoothing')
plot(myresid,ylab='Residuals',main='Interpolation Prediction Errors')
par(op)
dev.off()
bitmap(file='test2.png')
p <- predict(fit, par4, prediction.interval=TRUE)
np <- length(p[,1])
plot(fit,p,ylab='Observed (black) / Fitted (red)',main='Extrapolation Fit of Exponential Smoothing')
dev.off()
bitmap(file='test3.png')
op <- par(mfrow = c(2,2))
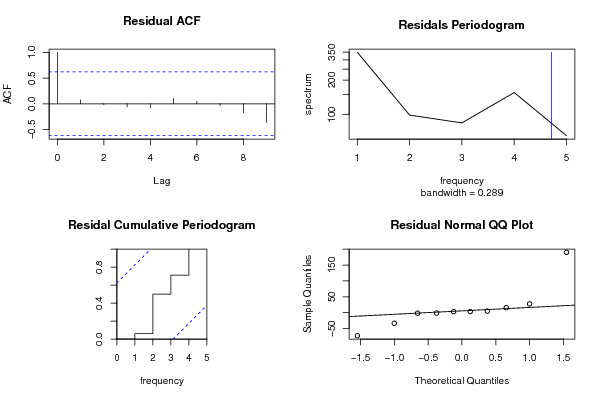
acf(as.numeric(myresid),lag.max = nx/2,main='Residual ACF')
spectrum(myresid,main='Residals Periodogram')
cpgram(myresid,main='Residal Cumulative Periodogram')
qqnorm(myresid,main='Residual Normal QQ Plot')
qqline(myresid)
par(op)
dev.off()
load(file='createtable')
a<-table.start()
a<-table.row.start(a)
a<-table.element(a,'Estimated Parameters of Exponential Smoothing',2,TRUE)
a<-table.row.end(a)
a<-table.row.start(a)
a<-table.element(a,'Parameter',header=TRUE)
a<-table.element(a,'Value',header=TRUE)
a<-table.row.end(a)
a<-table.row.start(a)
a<-table.element(a,'alpha',header=TRUE)
a<-table.element(a,fit$alpha)
a<-table.row.end(a)
a<-table.row.start(a)
a<-table.element(a,'beta',header=TRUE)
a<-table.element(a,fit$beta)
a<-table.row.end(a)
a<-table.row.start(a)
a<-table.element(a,'gamma',header=TRUE)
a<-table.element(a,fit$gamma)
a<-table.row.end(a)
a<-table.end(a)
table.save(a,file='mytable.tab')
a<-table.start()
a<-table.row.start(a)
a<-table.element(a,'Interpolation Forecasts of Exponential Smoothing',4,TRUE)
a<-table.row.end(a)
a<-table.row.start(a)
a<-table.element(a,'t',header=TRUE)
a<-table.element(a,'Observed',header=TRUE)
a<-table.element(a,'Fitted',header=TRUE)
a<-table.element(a,'Residuals',header=TRUE)
a<-table.row.end(a)
for (i in 1:nxmK) {
a<-table.row.start(a)
a<-table.element(a,i+K,header=TRUE)
a<-table.element(a,x[i+K])
a<-table.element(a,fit$fitted[i,'xhat'])
a<-table.element(a,myresid[i])
a<-table.row.end(a)
}
a<-table.end(a)
table.save(a,file='mytable1.tab')
a<-table.start()
a<-table.row.start(a)
a<-table.element(a,'Extrapolation Forecasts of Exponential Smoothing',4,TRUE)
a<-table.row.end(a)
a<-table.row.start(a)
a<-table.element(a,'t',header=TRUE)
a<-table.element(a,'Forecast',header=TRUE)
a<-table.element(a,'95% Lower Bound',header=TRUE)
a<-table.element(a,'95% Upper Bound',header=TRUE)
a<-table.row.end(a)
for (i in 1:np) {
a<-table.row.start(a)
a<-table.element(a,nx+i,header=TRUE)
a<-table.element(a,p[i,'fit'])
a<-table.element(a,p[i,'lwr'])
a<-table.element(a,p[i,'upr'])
a<-table.row.end(a)
}
a<-table.end(a)
table.save(a,file='mytable2.tab')