Free Statistics

of Irreproducible Research!

Author's title

Author*The author of this computation has been verified*
R Software Modulerwasp_arimabackwardselection.wasp
Title produced by softwareARIMA Backward Selection
Date of computationThu, 22 Dec 2016 22:24:02 +0100
Cite this page as followsStatistical Computations at FreeStatistics.org, Office for Research Development and Education, URL https://freestatistics.org/blog/index.php?v=date/2016/Dec/22/t148244352890vpfwaw6p91rjb.htm/, Retrieved Mon, 29 Apr 2024 04:10:37 +0000
Statistical Computations at FreeStatistics.org, Office for Research Development and Education, URL https://freestatistics.org/blog/index.php?pk=302703, Retrieved Mon, 29 Apr 2024 04:10:37 +0000
QR Codes:

Original text written by user:
IsPrivate?No (this computation is public)
User-defined keywords
Estimated Impact77
Family? (F = Feedback message, R = changed R code, M = changed R Module, P = changed Parameters, D = changed Data)
-       [ARIMA Backward Selection] [ARMIDA] [2016-12-22 21:24:02] [695928fec7566687630f1ba48b31beaa] [Current]
Feedback Forum

Post a new message
Dataseries X:
7687
6881
6033
5058
4171
3275
2608
2195
1878
3783
6896
8160
7734
6554
5252
4081
3124
2341
1822
1509
1578
3180
5070
5927
5846
5109
4227
3469
2808
2202
1687
1491
1940
4059
7064
9268
9488
8729
7921
7112
6292
5542
5269
4998
5293
7575
10190
11101
11101
10225
9713
8796
7930
7419
6656
6268
5814
7192
8665
8924
7643
6359
4997
3960
2993
2212
1757
1491
1432
3155
7486
7551
7580
6541
5644
4817
3989
3576
2908
2830
3726
6165
8963
10696
10726
10271
9624
9035
8645
7931
8124
7393
7996
9519
10148
10252
9942
9033
7894
6832
5870
4807
3809
3239
4864
7398
9456
10555
10197
9151
7972
7028
5987
5073
4714
4348
5027
8210
11722
13524
13141
12048
10734
9353
8229
6760


Summary of computational transaction
Raw Input view raw input (R code)
Raw Outputview raw output of R engine
Computing time7 seconds
R ServerBig Analytics Cloud Computing Center

\begin{tabular}{lllllllll}
\hline
Summary of computational transaction \tabularnewline
Raw Input view raw input (R code)  \tabularnewline
Raw Outputview raw output of R engine  \tabularnewline
Computing time7 seconds \tabularnewline
R ServerBig Analytics Cloud Computing Center \tabularnewline
\hline
\end{tabular}
%Source: https://freestatistics.org/blog/index.php?pk=302703&T=0

[TABLE]
[ROW]
Summary of computational transaction[/C][/ROW] [ROW]Raw Input[/C] view raw input (R code) [/C][/ROW] [ROW]Raw Output[/C]view raw output of R engine [/C][/ROW] [ROW]Computing time[/C]7 seconds[/C][/ROW] [ROW]R Server[/C]Big Analytics Cloud Computing Center[/C][/ROW] [/TABLE] Source: https://freestatistics.org/blog/index.php?pk=302703&T=0

Globally Unique Identifier (entire table): ba.freestatistics.org/blog/index.php?pk=302703&T=0

As an alternative you can also use a QR Code:  

The GUIDs for individual cells are displayed in the table below:

Summary of computational transaction
Raw Input view raw input (R code)
Raw Outputview raw output of R engine
Computing time7 seconds
R ServerBig Analytics Cloud Computing Center


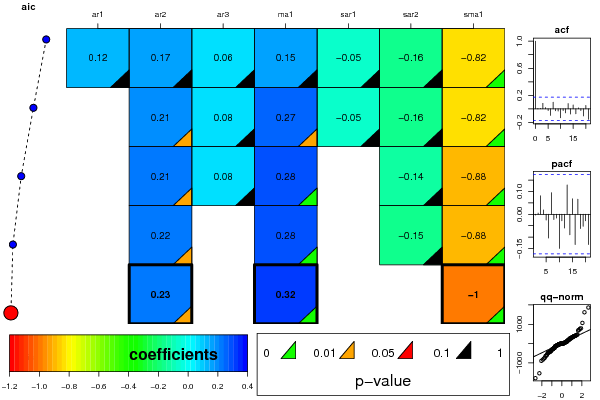
ARIMA Parameter Estimation and Backward Selection
Iterationar1ar2ar3ma1sar1sar2sma1
Estimates ( 1 )0.11940.17450.06240.1476-0.0501-0.1649-0.8202
(p-val)(0.9626 )(0.8018 )(0.873 )(0.9539 )(0.7715 )(0.2511 )(8e-04 )
Estimates ( 2 )00.20690.07980.2677-0.0501-0.164-0.8208
(p-val)(NA )(0.0413 )(0.3935 )(0.0123 )(0.7709 )(0.2527 )(8e-04 )
Estimates ( 3 )00.21480.07720.27550-0.1391-0.8833
(p-val)(NA )(0.0276 )(0.4059 )(0.0074 )(NA )(0.231 )(0 )
Estimates ( 4 )00.215600.27650-0.1504-0.8801
(p-val)(NA )(0.0251 )(NA )(0.0083 )(NA )(0.1881 )(0 )
Estimates ( 5 )00.226600.322600-1.0001
(p-val)(NA )(0.017 )(NA )(0.0011 )(NA )(NA )(0.0051 )
Estimates ( 6 )NANANANANANANA
(p-val)(NA )(NA )(NA )(NA )(NA )(NA )(NA )
Estimates ( 7 )NANANANANANANA
(p-val)(NA )(NA )(NA )(NA )(NA )(NA )(NA )
Estimates ( 8 )NANANANANANANA
(p-val)(NA )(NA )(NA )(NA )(NA )(NA )(NA )
Estimates ( 9 )NANANANANANANA
(p-val)(NA )(NA )(NA )(NA )(NA )(NA )(NA )
Estimates ( 10 )NANANANANANANA
(p-val)(NA )(NA )(NA )(NA )(NA )(NA )(NA )
Estimates ( 11 )NANANANANANANA
(p-val)(NA )(NA )(NA )(NA )(NA )(NA )(NA )
Estimates ( 12 )NANANANANANANA
(p-val)(NA )(NA )(NA )(NA )(NA )(NA )(NA )
Estimates ( 13 )NANANANANANANA
(p-val)(NA )(NA )(NA )(NA )(NA )(NA )(NA )

\begin{tabular}{lllllllll}
\hline
ARIMA Parameter Estimation and Backward Selection \tabularnewline
Iteration & ar1 & ar2 & ar3 & ma1 & sar1 & sar2 & sma1 \tabularnewline
Estimates ( 1 ) & 0.1194 & 0.1745 & 0.0624 & 0.1476 & -0.0501 & -0.1649 & -0.8202 \tabularnewline
(p-val) & (0.9626 ) & (0.8018 ) & (0.873 ) & (0.9539 ) & (0.7715 ) & (0.2511 ) & (8e-04 ) \tabularnewline
Estimates ( 2 ) & 0 & 0.2069 & 0.0798 & 0.2677 & -0.0501 & -0.164 & -0.8208 \tabularnewline
(p-val) & (NA ) & (0.0413 ) & (0.3935 ) & (0.0123 ) & (0.7709 ) & (0.2527 ) & (8e-04 ) \tabularnewline
Estimates ( 3 ) & 0 & 0.2148 & 0.0772 & 0.2755 & 0 & -0.1391 & -0.8833 \tabularnewline
(p-val) & (NA ) & (0.0276 ) & (0.4059 ) & (0.0074 ) & (NA ) & (0.231 ) & (0 ) \tabularnewline
Estimates ( 4 ) & 0 & 0.2156 & 0 & 0.2765 & 0 & -0.1504 & -0.8801 \tabularnewline
(p-val) & (NA ) & (0.0251 ) & (NA ) & (0.0083 ) & (NA ) & (0.1881 ) & (0 ) \tabularnewline
Estimates ( 5 ) & 0 & 0.2266 & 0 & 0.3226 & 0 & 0 & -1.0001 \tabularnewline
(p-val) & (NA ) & (0.017 ) & (NA ) & (0.0011 ) & (NA ) & (NA ) & (0.0051 ) \tabularnewline
Estimates ( 6 ) & NA & NA & NA & NA & NA & NA & NA \tabularnewline
(p-val) & (NA ) & (NA ) & (NA ) & (NA ) & (NA ) & (NA ) & (NA ) \tabularnewline
Estimates ( 7 ) & NA & NA & NA & NA & NA & NA & NA \tabularnewline
(p-val) & (NA ) & (NA ) & (NA ) & (NA ) & (NA ) & (NA ) & (NA ) \tabularnewline
Estimates ( 8 ) & NA & NA & NA & NA & NA & NA & NA \tabularnewline
(p-val) & (NA ) & (NA ) & (NA ) & (NA ) & (NA ) & (NA ) & (NA ) \tabularnewline
Estimates ( 9 ) & NA & NA & NA & NA & NA & NA & NA \tabularnewline
(p-val) & (NA ) & (NA ) & (NA ) & (NA ) & (NA ) & (NA ) & (NA ) \tabularnewline
Estimates ( 10 ) & NA & NA & NA & NA & NA & NA & NA \tabularnewline
(p-val) & (NA ) & (NA ) & (NA ) & (NA ) & (NA ) & (NA ) & (NA ) \tabularnewline
Estimates ( 11 ) & NA & NA & NA & NA & NA & NA & NA \tabularnewline
(p-val) & (NA ) & (NA ) & (NA ) & (NA ) & (NA ) & (NA ) & (NA ) \tabularnewline
Estimates ( 12 ) & NA & NA & NA & NA & NA & NA & NA \tabularnewline
(p-val) & (NA ) & (NA ) & (NA ) & (NA ) & (NA ) & (NA ) & (NA ) \tabularnewline
Estimates ( 13 ) & NA & NA & NA & NA & NA & NA & NA \tabularnewline
(p-val) & (NA ) & (NA ) & (NA ) & (NA ) & (NA ) & (NA ) & (NA ) \tabularnewline
\hline
\end{tabular}
%Source: https://freestatistics.org/blog/index.php?pk=302703&T=1

[TABLE]
[ROW][C]ARIMA Parameter Estimation and Backward Selection[/C][/ROW]
[ROW][C]Iteration[/C][C]ar1[/C][C]ar2[/C][C]ar3[/C][C]ma1[/C][C]sar1[/C][C]sar2[/C][C]sma1[/C][/ROW]
[ROW][C]Estimates ( 1 )[/C][C]0.1194[/C][C]0.1745[/C][C]0.0624[/C][C]0.1476[/C][C]-0.0501[/C][C]-0.1649[/C][C]-0.8202[/C][/ROW]
[ROW][C](p-val)[/C][C](0.9626 )[/C][C](0.8018 )[/C][C](0.873 )[/C][C](0.9539 )[/C][C](0.7715 )[/C][C](0.2511 )[/C][C](8e-04 )[/C][/ROW]
[ROW][C]Estimates ( 2 )[/C][C]0[/C][C]0.2069[/C][C]0.0798[/C][C]0.2677[/C][C]-0.0501[/C][C]-0.164[/C][C]-0.8208[/C][/ROW]
[ROW][C](p-val)[/C][C](NA )[/C][C](0.0413 )[/C][C](0.3935 )[/C][C](0.0123 )[/C][C](0.7709 )[/C][C](0.2527 )[/C][C](8e-04 )[/C][/ROW]
[ROW][C]Estimates ( 3 )[/C][C]0[/C][C]0.2148[/C][C]0.0772[/C][C]0.2755[/C][C]0[/C][C]-0.1391[/C][C]-0.8833[/C][/ROW]
[ROW][C](p-val)[/C][C](NA )[/C][C](0.0276 )[/C][C](0.4059 )[/C][C](0.0074 )[/C][C](NA )[/C][C](0.231 )[/C][C](0 )[/C][/ROW]
[ROW][C]Estimates ( 4 )[/C][C]0[/C][C]0.2156[/C][C]0[/C][C]0.2765[/C][C]0[/C][C]-0.1504[/C][C]-0.8801[/C][/ROW]
[ROW][C](p-val)[/C][C](NA )[/C][C](0.0251 )[/C][C](NA )[/C][C](0.0083 )[/C][C](NA )[/C][C](0.1881 )[/C][C](0 )[/C][/ROW]
[ROW][C]Estimates ( 5 )[/C][C]0[/C][C]0.2266[/C][C]0[/C][C]0.3226[/C][C]0[/C][C]0[/C][C]-1.0001[/C][/ROW]
[ROW][C](p-val)[/C][C](NA )[/C][C](0.017 )[/C][C](NA )[/C][C](0.0011 )[/C][C](NA )[/C][C](NA )[/C][C](0.0051 )[/C][/ROW]
[ROW][C]Estimates ( 6 )[/C][C]NA[/C][C]NA[/C][C]NA[/C][C]NA[/C][C]NA[/C][C]NA[/C][C]NA[/C][/ROW]
[ROW][C](p-val)[/C][C](NA )[/C][C](NA )[/C][C](NA )[/C][C](NA )[/C][C](NA )[/C][C](NA )[/C][C](NA )[/C][/ROW]
[ROW][C]Estimates ( 7 )[/C][C]NA[/C][C]NA[/C][C]NA[/C][C]NA[/C][C]NA[/C][C]NA[/C][C]NA[/C][/ROW]
[ROW][C](p-val)[/C][C](NA )[/C][C](NA )[/C][C](NA )[/C][C](NA )[/C][C](NA )[/C][C](NA )[/C][C](NA )[/C][/ROW]
[ROW][C]Estimates ( 8 )[/C][C]NA[/C][C]NA[/C][C]NA[/C][C]NA[/C][C]NA[/C][C]NA[/C][C]NA[/C][/ROW]
[ROW][C](p-val)[/C][C](NA )[/C][C](NA )[/C][C](NA )[/C][C](NA )[/C][C](NA )[/C][C](NA )[/C][C](NA )[/C][/ROW]
[ROW][C]Estimates ( 9 )[/C][C]NA[/C][C]NA[/C][C]NA[/C][C]NA[/C][C]NA[/C][C]NA[/C][C]NA[/C][/ROW]
[ROW][C](p-val)[/C][C](NA )[/C][C](NA )[/C][C](NA )[/C][C](NA )[/C][C](NA )[/C][C](NA )[/C][C](NA )[/C][/ROW]
[ROW][C]Estimates ( 10 )[/C][C]NA[/C][C]NA[/C][C]NA[/C][C]NA[/C][C]NA[/C][C]NA[/C][C]NA[/C][/ROW]
[ROW][C](p-val)[/C][C](NA )[/C][C](NA )[/C][C](NA )[/C][C](NA )[/C][C](NA )[/C][C](NA )[/C][C](NA )[/C][/ROW]
[ROW][C]Estimates ( 11 )[/C][C]NA[/C][C]NA[/C][C]NA[/C][C]NA[/C][C]NA[/C][C]NA[/C][C]NA[/C][/ROW]
[ROW][C](p-val)[/C][C](NA )[/C][C](NA )[/C][C](NA )[/C][C](NA )[/C][C](NA )[/C][C](NA )[/C][C](NA )[/C][/ROW]
[ROW][C]Estimates ( 12 )[/C][C]NA[/C][C]NA[/C][C]NA[/C][C]NA[/C][C]NA[/C][C]NA[/C][C]NA[/C][/ROW]
[ROW][C](p-val)[/C][C](NA )[/C][C](NA )[/C][C](NA )[/C][C](NA )[/C][C](NA )[/C][C](NA )[/C][C](NA )[/C][/ROW]
[ROW][C]Estimates ( 13 )[/C][C]NA[/C][C]NA[/C][C]NA[/C][C]NA[/C][C]NA[/C][C]NA[/C][C]NA[/C][/ROW]
[ROW][C](p-val)[/C][C](NA )[/C][C](NA )[/C][C](NA )[/C][C](NA )[/C][C](NA )[/C][C](NA )[/C][C](NA )[/C][/ROW]
[/TABLE]
Source: https://freestatistics.org/blog/index.php?pk=302703&T=1

Globally Unique Identifier (entire table): ba.freestatistics.org/blog/index.php?pk=302703&T=1

As an alternative you can also use a QR Code:  

The GUIDs for individual cells are displayed in the table below:

ARIMA Parameter Estimation and Backward Selection
Iterationar1ar2ar3ma1sar1sar2sma1
Estimates ( 1 )0.11940.17450.06240.1476-0.0501-0.1649-0.8202
(p-val)(0.9626 )(0.8018 )(0.873 )(0.9539 )(0.7715 )(0.2511 )(8e-04 )
Estimates ( 2 )00.20690.07980.2677-0.0501-0.164-0.8208
(p-val)(NA )(0.0413 )(0.3935 )(0.0123 )(0.7709 )(0.2527 )(8e-04 )
Estimates ( 3 )00.21480.07720.27550-0.1391-0.8833
(p-val)(NA )(0.0276 )(0.4059 )(0.0074 )(NA )(0.231 )(0 )
Estimates ( 4 )00.215600.27650-0.1504-0.8801
(p-val)(NA )(0.0251 )(NA )(0.0083 )(NA )(0.1881 )(0 )
Estimates ( 5 )00.226600.322600-1.0001
(p-val)(NA )(0.017 )(NA )(0.0011 )(NA )(NA )(0.0051 )
Estimates ( 6 )NANANANANANANA
(p-val)(NA )(NA )(NA )(NA )(NA )(NA )(NA )
Estimates ( 7 )NANANANANANANA
(p-val)(NA )(NA )(NA )(NA )(NA )(NA )(NA )
Estimates ( 8 )NANANANANANANA
(p-val)(NA )(NA )(NA )(NA )(NA )(NA )(NA )
Estimates ( 9 )NANANANANANANA
(p-val)(NA )(NA )(NA )(NA )(NA )(NA )(NA )
Estimates ( 10 )NANANANANANANA
(p-val)(NA )(NA )(NA )(NA )(NA )(NA )(NA )
Estimates ( 11 )NANANANANANANA
(p-val)(NA )(NA )(NA )(NA )(NA )(NA )(NA )
Estimates ( 12 )NANANANANANANA
(p-val)(NA )(NA )(NA )(NA )(NA )(NA )(NA )
Estimates ( 13 )NANANANANANANA
(p-val)(NA )(NA )(NA )(NA )(NA )(NA )(NA )


Estimated ARIMA Residuals
Value
-18.5457164018856
-261.195462661567
-247.952813200408
-17.7610864476825
25.4503778583408
107.8941103548
90.6708529591224
29.8929125302565
252.251459687043
-315.878849711532
-892.775445782088
-33.1516473039986
411.991727801215
191.119648079663
91.4611873674338
194.695137350833
123.806525302225
91.1127935930945
-18.2276979973015
95.0112715179762
404.747519307811
175.903225509287
340.556560978557
790.175603191633
22.4401418619969
-113.429922016933
88.9620447696018
60.0508453804852
-54.796611030451
-2.1117328729533
273.52007745274
-46.7970265846053
153.675901696532
259.196564610962
-314.522204534127
-577.166575276817
270.806867202906
63.0486488270652
393.02988610383
-79.3974584350711
-79.2535464359132
265.359935023193
-328.657416121503
-33.654173500208
-432.735817190804
-408.104267003718
-830.681020006998
-507.448124876144
-730.838053001691
-3.62611875747336
-234.134572047261
50.3458330071006
-39.4677335032483
-50.9388108679438
168.5870168542
21.4624203878353
-67.047296795897
-63.8887337194213
1868.71086747724
-1537.6373399932
384.311687686989
26.2375599547824
31.3291047203423
119.384331564966
-32.1888691024076
308.408142108302
-264.609320062142
208.54718255341
765.423191773131
245.943168542202
-393.239757341397
678.511400416934
-49.8233621406765
304.001650419065
107.120951511289
180.867537038942
336.967799227359
-224.3692129456
708.900973946637
-630.564681874823
437.391302135652
-450.622925644459
-1789.61602697009
-466.983992114484
470.130712624275
53.4961784433762
-237.927823402962
-101.931329041667
-97.6090331218571
-278.073260329273
-462.13447830699
10.0316747547199
1620.48820550266
331.859785265848
-772.957503901587
390.462341291902
-121.254192830608
-123.590733891299
-148.010846394658
60.2340657514883
-136.146643677058
-152.394838433285
343.684572864673
-113.026390978561
273.456318749625
1069.57490998837
446.527488038639
369.70364336849
-428.549945652914
-227.089976458605
-284.132603385588
-382.904476740702
-119.272605409541
-622.648625726134

\begin{tabular}{lllllllll}
\hline
Estimated ARIMA Residuals \tabularnewline
Value \tabularnewline
-18.5457164018856 \tabularnewline
-261.195462661567 \tabularnewline
-247.952813200408 \tabularnewline
-17.7610864476825 \tabularnewline
25.4503778583408 \tabularnewline
107.8941103548 \tabularnewline
90.6708529591224 \tabularnewline
29.8929125302565 \tabularnewline
252.251459687043 \tabularnewline
-315.878849711532 \tabularnewline
-892.775445782088 \tabularnewline
-33.1516473039986 \tabularnewline
411.991727801215 \tabularnewline
191.119648079663 \tabularnewline
91.4611873674338 \tabularnewline
194.695137350833 \tabularnewline
123.806525302225 \tabularnewline
91.1127935930945 \tabularnewline
-18.2276979973015 \tabularnewline
95.0112715179762 \tabularnewline
404.747519307811 \tabularnewline
175.903225509287 \tabularnewline
340.556560978557 \tabularnewline
790.175603191633 \tabularnewline
22.4401418619969 \tabularnewline
-113.429922016933 \tabularnewline
88.9620447696018 \tabularnewline
60.0508453804852 \tabularnewline
-54.796611030451 \tabularnewline
-2.1117328729533 \tabularnewline
273.52007745274 \tabularnewline
-46.7970265846053 \tabularnewline
153.675901696532 \tabularnewline
259.196564610962 \tabularnewline
-314.522204534127 \tabularnewline
-577.166575276817 \tabularnewline
270.806867202906 \tabularnewline
63.0486488270652 \tabularnewline
393.02988610383 \tabularnewline
-79.3974584350711 \tabularnewline
-79.2535464359132 \tabularnewline
265.359935023193 \tabularnewline
-328.657416121503 \tabularnewline
-33.654173500208 \tabularnewline
-432.735817190804 \tabularnewline
-408.104267003718 \tabularnewline
-830.681020006998 \tabularnewline
-507.448124876144 \tabularnewline
-730.838053001691 \tabularnewline
-3.62611875747336 \tabularnewline
-234.134572047261 \tabularnewline
50.3458330071006 \tabularnewline
-39.4677335032483 \tabularnewline
-50.9388108679438 \tabularnewline
168.5870168542 \tabularnewline
21.4624203878353 \tabularnewline
-67.047296795897 \tabularnewline
-63.8887337194213 \tabularnewline
1868.71086747724 \tabularnewline
-1537.6373399932 \tabularnewline
384.311687686989 \tabularnewline
26.2375599547824 \tabularnewline
31.3291047203423 \tabularnewline
119.384331564966 \tabularnewline
-32.1888691024076 \tabularnewline
308.408142108302 \tabularnewline
-264.609320062142 \tabularnewline
208.54718255341 \tabularnewline
765.423191773131 \tabularnewline
245.943168542202 \tabularnewline
-393.239757341397 \tabularnewline
678.511400416934 \tabularnewline
-49.8233621406765 \tabularnewline
304.001650419065 \tabularnewline
107.120951511289 \tabularnewline
180.867537038942 \tabularnewline
336.967799227359 \tabularnewline
-224.3692129456 \tabularnewline
708.900973946637 \tabularnewline
-630.564681874823 \tabularnewline
437.391302135652 \tabularnewline
-450.622925644459 \tabularnewline
-1789.61602697009 \tabularnewline
-466.983992114484 \tabularnewline
470.130712624275 \tabularnewline
53.4961784433762 \tabularnewline
-237.927823402962 \tabularnewline
-101.931329041667 \tabularnewline
-97.6090331218571 \tabularnewline
-278.073260329273 \tabularnewline
-462.13447830699 \tabularnewline
10.0316747547199 \tabularnewline
1620.48820550266 \tabularnewline
331.859785265848 \tabularnewline
-772.957503901587 \tabularnewline
390.462341291902 \tabularnewline
-121.254192830608 \tabularnewline
-123.590733891299 \tabularnewline
-148.010846394658 \tabularnewline
60.2340657514883 \tabularnewline
-136.146643677058 \tabularnewline
-152.394838433285 \tabularnewline
343.684572864673 \tabularnewline
-113.026390978561 \tabularnewline
273.456318749625 \tabularnewline
1069.57490998837 \tabularnewline
446.527488038639 \tabularnewline
369.70364336849 \tabularnewline
-428.549945652914 \tabularnewline
-227.089976458605 \tabularnewline
-284.132603385588 \tabularnewline
-382.904476740702 \tabularnewline
-119.272605409541 \tabularnewline
-622.648625726134 \tabularnewline
\hline
\end{tabular}
%Source: https://freestatistics.org/blog/index.php?pk=302703&T=2

[TABLE]
[ROW][C]Estimated ARIMA Residuals[/C][/ROW]
[ROW][C]Value[/C][/ROW]
[ROW][C]-18.5457164018856[/C][/ROW]
[ROW][C]-261.195462661567[/C][/ROW]
[ROW][C]-247.952813200408[/C][/ROW]
[ROW][C]-17.7610864476825[/C][/ROW]
[ROW][C]25.4503778583408[/C][/ROW]
[ROW][C]107.8941103548[/C][/ROW]
[ROW][C]90.6708529591224[/C][/ROW]
[ROW][C]29.8929125302565[/C][/ROW]
[ROW][C]252.251459687043[/C][/ROW]
[ROW][C]-315.878849711532[/C][/ROW]
[ROW][C]-892.775445782088[/C][/ROW]
[ROW][C]-33.1516473039986[/C][/ROW]
[ROW][C]411.991727801215[/C][/ROW]
[ROW][C]191.119648079663[/C][/ROW]
[ROW][C]91.4611873674338[/C][/ROW]
[ROW][C]194.695137350833[/C][/ROW]
[ROW][C]123.806525302225[/C][/ROW]
[ROW][C]91.1127935930945[/C][/ROW]
[ROW][C]-18.2276979973015[/C][/ROW]
[ROW][C]95.0112715179762[/C][/ROW]
[ROW][C]404.747519307811[/C][/ROW]
[ROW][C]175.903225509287[/C][/ROW]
[ROW][C]340.556560978557[/C][/ROW]
[ROW][C]790.175603191633[/C][/ROW]
[ROW][C]22.4401418619969[/C][/ROW]
[ROW][C]-113.429922016933[/C][/ROW]
[ROW][C]88.9620447696018[/C][/ROW]
[ROW][C]60.0508453804852[/C][/ROW]
[ROW][C]-54.796611030451[/C][/ROW]
[ROW][C]-2.1117328729533[/C][/ROW]
[ROW][C]273.52007745274[/C][/ROW]
[ROW][C]-46.7970265846053[/C][/ROW]
[ROW][C]153.675901696532[/C][/ROW]
[ROW][C]259.196564610962[/C][/ROW]
[ROW][C]-314.522204534127[/C][/ROW]
[ROW][C]-577.166575276817[/C][/ROW]
[ROW][C]270.806867202906[/C][/ROW]
[ROW][C]63.0486488270652[/C][/ROW]
[ROW][C]393.02988610383[/C][/ROW]
[ROW][C]-79.3974584350711[/C][/ROW]
[ROW][C]-79.2535464359132[/C][/ROW]
[ROW][C]265.359935023193[/C][/ROW]
[ROW][C]-328.657416121503[/C][/ROW]
[ROW][C]-33.654173500208[/C][/ROW]
[ROW][C]-432.735817190804[/C][/ROW]
[ROW][C]-408.104267003718[/C][/ROW]
[ROW][C]-830.681020006998[/C][/ROW]
[ROW][C]-507.448124876144[/C][/ROW]
[ROW][C]-730.838053001691[/C][/ROW]
[ROW][C]-3.62611875747336[/C][/ROW]
[ROW][C]-234.134572047261[/C][/ROW]
[ROW][C]50.3458330071006[/C][/ROW]
[ROW][C]-39.4677335032483[/C][/ROW]
[ROW][C]-50.9388108679438[/C][/ROW]
[ROW][C]168.5870168542[/C][/ROW]
[ROW][C]21.4624203878353[/C][/ROW]
[ROW][C]-67.047296795897[/C][/ROW]
[ROW][C]-63.8887337194213[/C][/ROW]
[ROW][C]1868.71086747724[/C][/ROW]
[ROW][C]-1537.6373399932[/C][/ROW]
[ROW][C]384.311687686989[/C][/ROW]
[ROW][C]26.2375599547824[/C][/ROW]
[ROW][C]31.3291047203423[/C][/ROW]
[ROW][C]119.384331564966[/C][/ROW]
[ROW][C]-32.1888691024076[/C][/ROW]
[ROW][C]308.408142108302[/C][/ROW]
[ROW][C]-264.609320062142[/C][/ROW]
[ROW][C]208.54718255341[/C][/ROW]
[ROW][C]765.423191773131[/C][/ROW]
[ROW][C]245.943168542202[/C][/ROW]
[ROW][C]-393.239757341397[/C][/ROW]
[ROW][C]678.511400416934[/C][/ROW]
[ROW][C]-49.8233621406765[/C][/ROW]
[ROW][C]304.001650419065[/C][/ROW]
[ROW][C]107.120951511289[/C][/ROW]
[ROW][C]180.867537038942[/C][/ROW]
[ROW][C]336.967799227359[/C][/ROW]
[ROW][C]-224.3692129456[/C][/ROW]
[ROW][C]708.900973946637[/C][/ROW]
[ROW][C]-630.564681874823[/C][/ROW]
[ROW][C]437.391302135652[/C][/ROW]
[ROW][C]-450.622925644459[/C][/ROW]
[ROW][C]-1789.61602697009[/C][/ROW]
[ROW][C]-466.983992114484[/C][/ROW]
[ROW][C]470.130712624275[/C][/ROW]
[ROW][C]53.4961784433762[/C][/ROW]
[ROW][C]-237.927823402962[/C][/ROW]
[ROW][C]-101.931329041667[/C][/ROW]
[ROW][C]-97.6090331218571[/C][/ROW]
[ROW][C]-278.073260329273[/C][/ROW]
[ROW][C]-462.13447830699[/C][/ROW]
[ROW][C]10.0316747547199[/C][/ROW]
[ROW][C]1620.48820550266[/C][/ROW]
[ROW][C]331.859785265848[/C][/ROW]
[ROW][C]-772.957503901587[/C][/ROW]
[ROW][C]390.462341291902[/C][/ROW]
[ROW][C]-121.254192830608[/C][/ROW]
[ROW][C]-123.590733891299[/C][/ROW]
[ROW][C]-148.010846394658[/C][/ROW]
[ROW][C]60.2340657514883[/C][/ROW]
[ROW][C]-136.146643677058[/C][/ROW]
[ROW][C]-152.394838433285[/C][/ROW]
[ROW][C]343.684572864673[/C][/ROW]
[ROW][C]-113.026390978561[/C][/ROW]
[ROW][C]273.456318749625[/C][/ROW]
[ROW][C]1069.57490998837[/C][/ROW]
[ROW][C]446.527488038639[/C][/ROW]
[ROW][C]369.70364336849[/C][/ROW]
[ROW][C]-428.549945652914[/C][/ROW]
[ROW][C]-227.089976458605[/C][/ROW]
[ROW][C]-284.132603385588[/C][/ROW]
[ROW][C]-382.904476740702[/C][/ROW]
[ROW][C]-119.272605409541[/C][/ROW]
[ROW][C]-622.648625726134[/C][/ROW]
[/TABLE]
Source: https://freestatistics.org/blog/index.php?pk=302703&T=2

Globally Unique Identifier (entire table): ba.freestatistics.org/blog/index.php?pk=302703&T=2

As an alternative you can also use a QR Code:  

The GUIDs for individual cells are displayed in the table below:

Estimated ARIMA Residuals
Value
-18.5457164018856
-261.195462661567
-247.952813200408
-17.7610864476825
25.4503778583408
107.8941103548
90.6708529591224
29.8929125302565
252.251459687043
-315.878849711532
-892.775445782088
-33.1516473039986
411.991727801215
191.119648079663
91.4611873674338
194.695137350833
123.806525302225
91.1127935930945
-18.2276979973015
95.0112715179762
404.747519307811
175.903225509287
340.556560978557
790.175603191633
22.4401418619969
-113.429922016933
88.9620447696018
60.0508453804852
-54.796611030451
-2.1117328729533
273.52007745274
-46.7970265846053
153.675901696532
259.196564610962
-314.522204534127
-577.166575276817
270.806867202906
63.0486488270652
393.02988610383
-79.3974584350711
-79.2535464359132
265.359935023193
-328.657416121503
-33.654173500208
-432.735817190804
-408.104267003718
-830.681020006998
-507.448124876144
-730.838053001691
-3.62611875747336
-234.134572047261
50.3458330071006
-39.4677335032483
-50.9388108679438
168.5870168542
21.4624203878353
-67.047296795897
-63.8887337194213
1868.71086747724
-1537.6373399932
384.311687686989
26.2375599547824
31.3291047203423
119.384331564966
-32.1888691024076
308.408142108302
-264.609320062142
208.54718255341
765.423191773131
245.943168542202
-393.239757341397
678.511400416934
-49.8233621406765
304.001650419065
107.120951511289
180.867537038942
336.967799227359
-224.3692129456
708.900973946637
-630.564681874823
437.391302135652
-450.622925644459
-1789.61602697009
-466.983992114484
470.130712624275
53.4961784433762
-237.927823402962
-101.931329041667
-97.6090331218571
-278.073260329273
-462.13447830699
10.0316747547199
1620.48820550266
331.859785265848
-772.957503901587
390.462341291902
-121.254192830608
-123.590733891299
-148.010846394658
60.2340657514883
-136.146643677058
-152.394838433285
343.684572864673
-113.026390978561
273.456318749625
1069.57490998837
446.527488038639
369.70364336849
-428.549945652914
-227.089976458605
-284.132603385588
-382.904476740702
-119.272605409541
-622.648625726134


Parameters (Session):
par1 = 1 ; par2 = 1 ; par3 = 1 ; par4 = 12 ;
Parameters (R input):
par1 = FALSE ; par2 = 1 ; par3 = 1 ; par4 = 1 ; par5 = 12 ; par6 = 3 ; par7 = 1 ; par8 = 2 ; par9 = 1 ;
R code (references can be found in the software module):
library(lattice)
if (par1 == 'TRUE') par1 <- TRUE
if (par1 == 'FALSE') par1 <- FALSE
par2 <- as.numeric(par2) #Box-Cox lambda transformation parameter
par3 <- as.numeric(par3) #degree of non-seasonal differencing
par4 <- as.numeric(par4) #degree of seasonal differencing
par5 <- as.numeric(par5) #seasonal period
par6 <- as.numeric(par6) #degree (p) of the non-seasonal AR(p) polynomial
par7 <- as.numeric(par7) #degree (q) of the non-seasonal MA(q) polynomial
par8 <- as.numeric(par8) #degree (P) of the seasonal AR(P) polynomial
par9 <- as.numeric(par9) #degree (Q) of the seasonal MA(Q) polynomial
armaGR <- function(arima.out, names, n){
try1 <- arima.out$coef
try2 <- sqrt(diag(arima.out$var.coef))
try.data.frame <- data.frame(matrix(NA,ncol=4,nrow=length(names)))
dimnames(try.data.frame) <- list(names,c('coef','std','tstat','pv'))
try.data.frame[,1] <- try1
for(i in 1:length(try2)) try.data.frame[which(rownames(try.data.frame)==names(try2)[i]),2] <- try2[i]
try.data.frame[,3] <- try.data.frame[,1] / try.data.frame[,2]
try.data.frame[,4] <- round((1-pt(abs(try.data.frame[,3]),df=n-(length(try2)+1)))*2,5)
vector <- rep(NA,length(names))
vector[is.na(try.data.frame[,4])] <- 0
maxi <- which.max(try.data.frame[,4])
continue <- max(try.data.frame[,4],na.rm=TRUE) > .05
vector[maxi] <- 0
list(summary=try.data.frame,next.vector=vector,continue=continue)
}
arimaSelect <- function(series, order=c(13,0,0), seasonal=list(order=c(2,0,0),period=12), include.mean=F){
nrc <- order[1]+order[3]+seasonal$order[1]+seasonal$order[3]
coeff <- matrix(NA, nrow=nrc*2, ncol=nrc)
pval <- matrix(NA, nrow=nrc*2, ncol=nrc)
mylist <- rep(list(NULL), nrc)
names <- NULL
if(order[1] > 0) names <- paste('ar',1:order[1],sep='')
if(order[3] > 0) names <- c( names , paste('ma',1:order[3],sep='') )
if(seasonal$order[1] > 0) names <- c(names, paste('sar',1:seasonal$order[1],sep=''))
if(seasonal$order[3] > 0) names <- c(names, paste('sma',1:seasonal$order[3],sep=''))
arima.out <- arima(series, order=order, seasonal=seasonal, include.mean=include.mean, method='ML')
mylist[[1]] <- arima.out
last.arma <- armaGR(arima.out, names, length(series))
mystop <- FALSE
i <- 1
coeff[i,] <- last.arma[[1]][,1]
pval [i,] <- last.arma[[1]][,4]
i <- 2
aic <- arima.out$aic
while(!mystop){
mylist[[i]] <- arima.out
arima.out <- arima(series, order=order, seasonal=seasonal, include.mean=include.mean, method='ML', fixed=last.arma$next.vector)
aic <- c(aic, arima.out$aic)
last.arma <- armaGR(arima.out, names, length(series))
mystop <- !last.arma$continue
coeff[i,] <- last.arma[[1]][,1]
pval [i,] <- last.arma[[1]][,4]
i <- i+1
}
list(coeff, pval, mylist, aic=aic)
}
arimaSelectplot <- function(arimaSelect.out,noms,choix){
noms <- names(arimaSelect.out[[3]][[1]]$coef)
coeff <- arimaSelect.out[[1]]
k <- min(which(is.na(coeff[,1])))-1
coeff <- coeff[1:k,]
pval <- arimaSelect.out[[2]][1:k,]
aic <- arimaSelect.out$aic[1:k]
coeff[coeff==0] <- NA
n <- ncol(coeff)
if(missing(choix)) choix <- k
layout(matrix(c(1,1,1,2,
3,3,3,2,
3,3,3,4,
5,6,7,7),nr=4),
widths=c(10,35,45,15),
heights=c(30,30,15,15))
couleurs <- rainbow(75)[1:50]#(50)
ticks <- pretty(coeff)
par(mar=c(1,1,3,1))
plot(aic,k:1-.5,type='o',pch=21,bg='blue',cex=2,axes=F,lty=2,xpd=NA)
points(aic[choix],k-choix+.5,pch=21,cex=4,bg=2,xpd=NA)
title('aic',line=2)
par(mar=c(3,0,0,0))
plot(0,axes=F,xlab='',ylab='',xlim=range(ticks),ylim=c(.1,1))
rect(xleft = min(ticks) + (0:49)/50*(max(ticks)-min(ticks)),
xright = min(ticks) + (1:50)/50*(max(ticks)-min(ticks)),
ytop = rep(1,50),
ybottom= rep(0,50),col=couleurs,border=NA)
axis(1,ticks)
rect(xleft=min(ticks),xright=max(ticks),ytop=1,ybottom=0)
text(mean(coeff,na.rm=T),.5,'coefficients',cex=2,font=2)
par(mar=c(1,1,3,1))
image(1:n,1:k,t(coeff[k:1,]),axes=F,col=couleurs,zlim=range(ticks))
for(i in 1:n) for(j in 1:k) if(!is.na(coeff[j,i])) {
if(pval[j,i]<.01) symb = 'green'
else if( (pval[j,i]<.05) & (pval[j,i]>=.01)) symb = 'orange'
else if( (pval[j,i]<.1) & (pval[j,i]>=.05)) symb = 'red'
else symb = 'black'
polygon(c(i+.5 ,i+.2 ,i+.5 ,i+.5),
c(k-j+0.5,k-j+0.5,k-j+0.8,k-j+0.5),
col=symb)
if(j==choix) {
rect(xleft=i-.5,
xright=i+.5,
ybottom=k-j+1.5,
ytop=k-j+.5,
lwd=4)
text(i,
k-j+1,
round(coeff[j,i],2),
cex=1.2,
font=2)
}
else{
rect(xleft=i-.5,xright=i+.5,ybottom=k-j+1.5,ytop=k-j+.5)
text(i,k-j+1,round(coeff[j,i],2),cex=1.2,font=1)
}
}
axis(3,1:n,noms)
par(mar=c(0.5,0,0,0.5))
plot(0,axes=F,xlab='',ylab='',type='n',xlim=c(0,8),ylim=c(-.2,.8))
cols <- c('green','orange','red','black')
niv <- c('0','0.01','0.05','0.1')
for(i in 0:3){
polygon(c(1+2*i ,1+2*i ,1+2*i-.5 ,1+2*i),
c(.4 ,.7 , .4 , .4),
col=cols[i+1])
text(2*i,0.5,niv[i+1],cex=1.5)
}
text(8,.5,1,cex=1.5)
text(4,0,'p-value',cex=2)
box()
residus <- arimaSelect.out[[3]][[choix]]$res
par(mar=c(1,2,4,1))
acf(residus,main='')
title('acf',line=.5)
par(mar=c(1,2,4,1))
pacf(residus,main='')
title('pacf',line=.5)
par(mar=c(2,2,4,1))
qqnorm(residus,main='')
title('qq-norm',line=.5)
qqline(residus)
residus
}
if (par2 == 0) x <- log(x)
if (par2 != 0) x <- x^par2
(selection <- arimaSelect(x, order=c(par6,par3,par7), seasonal=list(order=c(par8,par4,par9), period=par5)))
bitmap(file='test1.png')
resid <- arimaSelectplot(selection)
dev.off()
resid
bitmap(file='test2.png')
acf(resid,length(resid)/2, main='Residual Autocorrelation Function')
dev.off()
bitmap(file='test3.png')
pacf(resid,length(resid)/2, main='Residual Partial Autocorrelation Function')
dev.off()
bitmap(file='test4.png')
cpgram(resid, main='Residual Cumulative Periodogram')
dev.off()
bitmap(file='test5.png')
hist(resid, main='Residual Histogram', xlab='values of Residuals')
dev.off()
bitmap(file='test6.png')
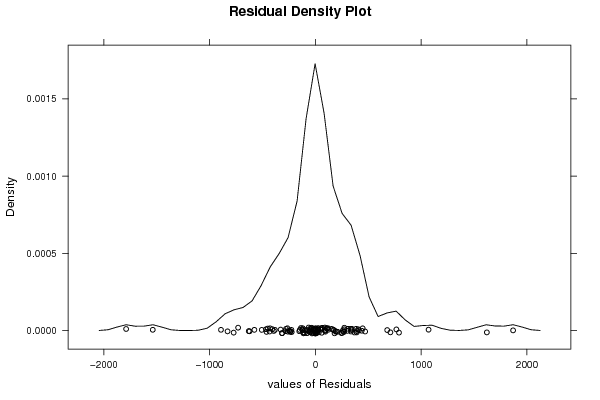
densityplot(~resid,col='black',main='Residual Density Plot', xlab='values of Residuals')
dev.off()
bitmap(file='test7.png')
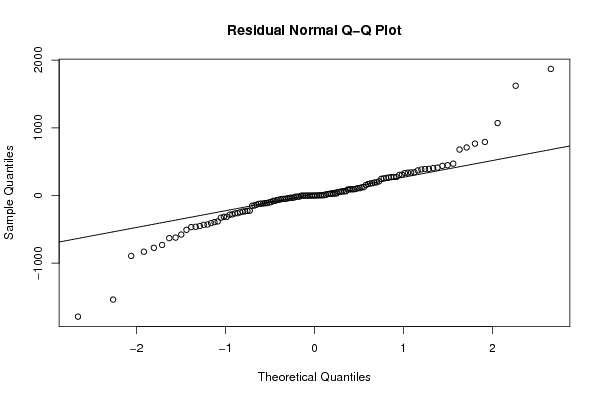
qqnorm(resid, main='Residual Normal Q-Q Plot')
qqline(resid)
dev.off()
ncols <- length(selection[[1]][1,])
nrows <- length(selection[[2]][,1])-1
load(file='createtable')
a<-table.start()
a<-table.row.start(a)
a<-table.element(a,'ARIMA Parameter Estimation and Backward Selection', ncols+1,TRUE)
a<-table.row.end(a)
a<-table.row.start(a)
a<-table.element(a,'Iteration', header=TRUE)
for (i in 1:ncols) {
a<-table.element(a,names(selection[[3]][[1]]$coef)[i],header=TRUE)
}
a<-table.row.end(a)
for (j in 1:nrows) {
a<-table.row.start(a)
mydum <- 'Estimates ('
mydum <- paste(mydum,j)
mydum <- paste(mydum,')')
a<-table.element(a,mydum, header=TRUE)
for (i in 1:ncols) {
a<-table.element(a,round(selection[[1]][j,i],4))
}
a<-table.row.end(a)
a<-table.row.start(a)
a<-table.element(a,'(p-val)', header=TRUE)
for (i in 1:ncols) {
mydum <- '('
mydum <- paste(mydum,round(selection[[2]][j,i],4),sep='')
mydum <- paste(mydum,')')
a<-table.element(a,mydum)
}
a<-table.row.end(a)
}
a<-table.end(a)
table.save(a,file='mytable.tab')
a<-table.start()
a<-table.row.start(a)
a<-table.element(a,'Estimated ARIMA Residuals', 1,TRUE)
a<-table.row.end(a)
a<-table.row.start(a)
a<-table.element(a,'Value', 1,TRUE)
a<-table.row.end(a)
for (i in (par4*par5+par3):length(resid)) {
a<-table.row.start(a)
a<-table.element(a,resid[i])
a<-table.row.end(a)
}
a<-table.end(a)
table.save(a,file='mytable1.tab')