Free Statistics

of Irreproducible Research!

Author's title

Author*The author of this computation has been verified*
R Software Modulerwasp_autocorrelation.wasp
Title produced by software(Partial) Autocorrelation Function
Date of computationThu, 22 Dec 2016 23:13:16 +0100
Cite this page as followsStatistical Computations at FreeStatistics.org, Office for Research Development and Education, URL https://freestatistics.org/blog/index.php?v=date/2016/Dec/22/t1482444852nhd9r4jg8grdhn4.htm/, Retrieved Sun, 28 Apr 2024 21:28:58 +0000
Statistical Computations at FreeStatistics.org, Office for Research Development and Education, URL https://freestatistics.org/blog/index.php?pk=302712, Retrieved Sun, 28 Apr 2024 21:28:58 +0000
QR Codes:

Original text written by user:
IsPrivate?No (this computation is public)
User-defined keywords
Estimated Impact58
Family? (F = Feedback message, R = changed R code, M = changed R Module, P = changed Parameters, D = changed Data)
-       [(Partial) Autocorrelation Function] [(Partial) autocor...] [2016-12-22 22:13:16] [d4ebbcc95b180bc93fc42d05f31a3dde] [Current]
Feedback Forum

Post a new message
Dataseries X:
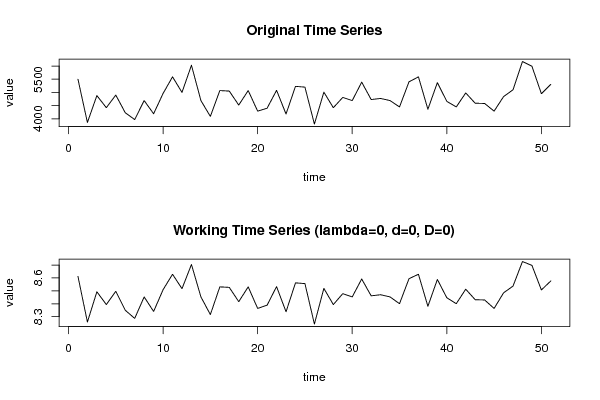
5500
3860
4880
4420
4900
4230
3970
4690
4190
4960
5590
5000
6030
4690
4090
5070
5050
4520
5070
4290
4400
5080
4180
5230
5200
3800
5010
4420
4810
4690
5390
4730
4770
4690
4450
5400
5590
4360
5370
4660
4450
4980
4590
4580
4290
4840
5100
6170
5990
4950
5310


Summary of computational transaction
Raw Input view raw input (R code)
Raw Outputview raw output of R engine
Computing time1 seconds
R ServerBig Analytics Cloud Computing Center

\begin{tabular}{lllllllll}
\hline
Summary of computational transaction \tabularnewline
Raw Input view raw input (R code)  \tabularnewline
Raw Outputview raw output of R engine  \tabularnewline
Computing time1 seconds \tabularnewline
R ServerBig Analytics Cloud Computing Center \tabularnewline
\hline
\end{tabular}
%Source: https://freestatistics.org/blog/index.php?pk=302712&T=0

[TABLE]
[ROW]
Summary of computational transaction[/C][/ROW] [ROW]Raw Input[/C] view raw input (R code) [/C][/ROW] [ROW]Raw Output[/C]view raw output of R engine [/C][/ROW] [ROW]Computing time[/C]1 seconds[/C][/ROW] [ROW]R Server[/C]Big Analytics Cloud Computing Center[/C][/ROW] [/TABLE] Source: https://freestatistics.org/blog/index.php?pk=302712&T=0

Globally Unique Identifier (entire table): ba.freestatistics.org/blog/index.php?pk=302712&T=0

As an alternative you can also use a QR Code:  

The GUIDs for individual cells are displayed in the table below:

Summary of computational transaction
Raw Input view raw input (R code)
Raw Outputview raw output of R engine
Computing time1 seconds
R ServerBig Analytics Cloud Computing Center


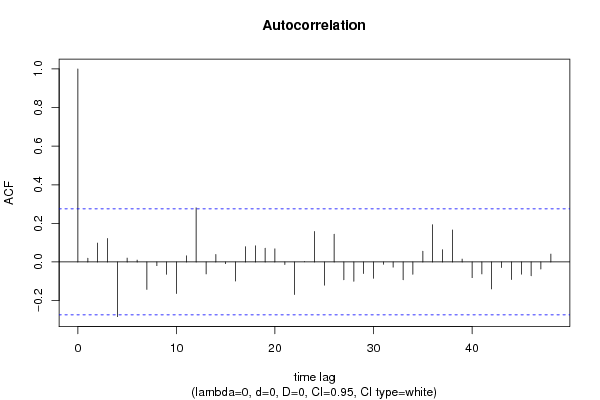
Autocorrelation Function
Time lag kACF(k)T-STATP-value
10.019150.13680.445879
20.0976190.69710.24444
30.121660.86880.194506
4-0.283305-2.02320.024155
50.0201010.14350.443211
60.0096240.06870.472736
7-0.141889-1.01330.157853
8-0.01886-0.13470.446695
9-0.063934-0.45660.324956
10-0.163025-1.16420.124875
110.0315330.22520.411366
120.280452.00280.025263
13-0.061691-0.44060.330696
140.0385910.27560.391987
15-0.00873-0.06230.475266
16-0.099018-0.70710.241353
170.0789960.56410.287565
180.0835450.59660.276698
190.0715040.51060.305904
200.0677890.48410.31519
21-0.013562-0.09690.461612
22-0.168518-1.20350.117177
23-0.00016-0.00110.499547
240.1577921.12690.132538
25-0.119897-0.85620.197935
260.1437241.02640.154775
27-0.092184-0.65830.256645
28-0.100205-0.71560.238748
29-0.059743-0.42660.335715
30-0.084409-0.60280.274657
31-0.011661-0.08330.466979
32-0.026911-0.19220.42418
33-0.092543-0.66090.255828
34-0.063974-0.45690.324855
350.0553370.39520.347178
360.1926941.37610.087401
370.0634090.45280.326296
380.1656691.18310.121126
390.0146450.10460.458558
40-0.081113-0.57930.28248
41-0.0619-0.44210.330159
42-0.139417-0.99560.162063
43-0.029113-0.20790.418065
44-0.090573-0.64680.260325
45-0.063232-0.45160.326747
46-0.071463-0.51030.306006
47-0.036435-0.26020.39788
480.0406770.29050.386309

\begin{tabular}{lllllllll}
\hline
Autocorrelation Function \tabularnewline
Time lag k & ACF(k) & T-STAT & P-value \tabularnewline
1 & 0.01915 & 0.1368 & 0.445879 \tabularnewline
2 & 0.097619 & 0.6971 & 0.24444 \tabularnewline
3 & 0.12166 & 0.8688 & 0.194506 \tabularnewline
4 & -0.283305 & -2.0232 & 0.024155 \tabularnewline
5 & 0.020101 & 0.1435 & 0.443211 \tabularnewline
6 & 0.009624 & 0.0687 & 0.472736 \tabularnewline
7 & -0.141889 & -1.0133 & 0.157853 \tabularnewline
8 & -0.01886 & -0.1347 & 0.446695 \tabularnewline
9 & -0.063934 & -0.4566 & 0.324956 \tabularnewline
10 & -0.163025 & -1.1642 & 0.124875 \tabularnewline
11 & 0.031533 & 0.2252 & 0.411366 \tabularnewline
12 & 0.28045 & 2.0028 & 0.025263 \tabularnewline
13 & -0.061691 & -0.4406 & 0.330696 \tabularnewline
14 & 0.038591 & 0.2756 & 0.391987 \tabularnewline
15 & -0.00873 & -0.0623 & 0.475266 \tabularnewline
16 & -0.099018 & -0.7071 & 0.241353 \tabularnewline
17 & 0.078996 & 0.5641 & 0.287565 \tabularnewline
18 & 0.083545 & 0.5966 & 0.276698 \tabularnewline
19 & 0.071504 & 0.5106 & 0.305904 \tabularnewline
20 & 0.067789 & 0.4841 & 0.31519 \tabularnewline
21 & -0.013562 & -0.0969 & 0.461612 \tabularnewline
22 & -0.168518 & -1.2035 & 0.117177 \tabularnewline
23 & -0.00016 & -0.0011 & 0.499547 \tabularnewline
24 & 0.157792 & 1.1269 & 0.132538 \tabularnewline
25 & -0.119897 & -0.8562 & 0.197935 \tabularnewline
26 & 0.143724 & 1.0264 & 0.154775 \tabularnewline
27 & -0.092184 & -0.6583 & 0.256645 \tabularnewline
28 & -0.100205 & -0.7156 & 0.238748 \tabularnewline
29 & -0.059743 & -0.4266 & 0.335715 \tabularnewline
30 & -0.084409 & -0.6028 & 0.274657 \tabularnewline
31 & -0.011661 & -0.0833 & 0.466979 \tabularnewline
32 & -0.026911 & -0.1922 & 0.42418 \tabularnewline
33 & -0.092543 & -0.6609 & 0.255828 \tabularnewline
34 & -0.063974 & -0.4569 & 0.324855 \tabularnewline
35 & 0.055337 & 0.3952 & 0.347178 \tabularnewline
36 & 0.192694 & 1.3761 & 0.087401 \tabularnewline
37 & 0.063409 & 0.4528 & 0.326296 \tabularnewline
38 & 0.165669 & 1.1831 & 0.121126 \tabularnewline
39 & 0.014645 & 0.1046 & 0.458558 \tabularnewline
40 & -0.081113 & -0.5793 & 0.28248 \tabularnewline
41 & -0.0619 & -0.4421 & 0.330159 \tabularnewline
42 & -0.139417 & -0.9956 & 0.162063 \tabularnewline
43 & -0.029113 & -0.2079 & 0.418065 \tabularnewline
44 & -0.090573 & -0.6468 & 0.260325 \tabularnewline
45 & -0.063232 & -0.4516 & 0.326747 \tabularnewline
46 & -0.071463 & -0.5103 & 0.306006 \tabularnewline
47 & -0.036435 & -0.2602 & 0.39788 \tabularnewline
48 & 0.040677 & 0.2905 & 0.386309 \tabularnewline
\hline
\end{tabular}
%Source: https://freestatistics.org/blog/index.php?pk=302712&T=1

[TABLE]
[ROW][C]Autocorrelation Function[/C][/ROW]
[ROW][C]Time lag k[/C][C]ACF(k)[/C][C]T-STAT[/C][C]P-value[/C][/ROW]
[ROW][C]1[/C][C]0.01915[/C][C]0.1368[/C][C]0.445879[/C][/ROW]
[ROW][C]2[/C][C]0.097619[/C][C]0.6971[/C][C]0.24444[/C][/ROW]
[ROW][C]3[/C][C]0.12166[/C][C]0.8688[/C][C]0.194506[/C][/ROW]
[ROW][C]4[/C][C]-0.283305[/C][C]-2.0232[/C][C]0.024155[/C][/ROW]
[ROW][C]5[/C][C]0.020101[/C][C]0.1435[/C][C]0.443211[/C][/ROW]
[ROW][C]6[/C][C]0.009624[/C][C]0.0687[/C][C]0.472736[/C][/ROW]
[ROW][C]7[/C][C]-0.141889[/C][C]-1.0133[/C][C]0.157853[/C][/ROW]
[ROW][C]8[/C][C]-0.01886[/C][C]-0.1347[/C][C]0.446695[/C][/ROW]
[ROW][C]9[/C][C]-0.063934[/C][C]-0.4566[/C][C]0.324956[/C][/ROW]
[ROW][C]10[/C][C]-0.163025[/C][C]-1.1642[/C][C]0.124875[/C][/ROW]
[ROW][C]11[/C][C]0.031533[/C][C]0.2252[/C][C]0.411366[/C][/ROW]
[ROW][C]12[/C][C]0.28045[/C][C]2.0028[/C][C]0.025263[/C][/ROW]
[ROW][C]13[/C][C]-0.061691[/C][C]-0.4406[/C][C]0.330696[/C][/ROW]
[ROW][C]14[/C][C]0.038591[/C][C]0.2756[/C][C]0.391987[/C][/ROW]
[ROW][C]15[/C][C]-0.00873[/C][C]-0.0623[/C][C]0.475266[/C][/ROW]
[ROW][C]16[/C][C]-0.099018[/C][C]-0.7071[/C][C]0.241353[/C][/ROW]
[ROW][C]17[/C][C]0.078996[/C][C]0.5641[/C][C]0.287565[/C][/ROW]
[ROW][C]18[/C][C]0.083545[/C][C]0.5966[/C][C]0.276698[/C][/ROW]
[ROW][C]19[/C][C]0.071504[/C][C]0.5106[/C][C]0.305904[/C][/ROW]
[ROW][C]20[/C][C]0.067789[/C][C]0.4841[/C][C]0.31519[/C][/ROW]
[ROW][C]21[/C][C]-0.013562[/C][C]-0.0969[/C][C]0.461612[/C][/ROW]
[ROW][C]22[/C][C]-0.168518[/C][C]-1.2035[/C][C]0.117177[/C][/ROW]
[ROW][C]23[/C][C]-0.00016[/C][C]-0.0011[/C][C]0.499547[/C][/ROW]
[ROW][C]24[/C][C]0.157792[/C][C]1.1269[/C][C]0.132538[/C][/ROW]
[ROW][C]25[/C][C]-0.119897[/C][C]-0.8562[/C][C]0.197935[/C][/ROW]
[ROW][C]26[/C][C]0.143724[/C][C]1.0264[/C][C]0.154775[/C][/ROW]
[ROW][C]27[/C][C]-0.092184[/C][C]-0.6583[/C][C]0.256645[/C][/ROW]
[ROW][C]28[/C][C]-0.100205[/C][C]-0.7156[/C][C]0.238748[/C][/ROW]
[ROW][C]29[/C][C]-0.059743[/C][C]-0.4266[/C][C]0.335715[/C][/ROW]
[ROW][C]30[/C][C]-0.084409[/C][C]-0.6028[/C][C]0.274657[/C][/ROW]
[ROW][C]31[/C][C]-0.011661[/C][C]-0.0833[/C][C]0.466979[/C][/ROW]
[ROW][C]32[/C][C]-0.026911[/C][C]-0.1922[/C][C]0.42418[/C][/ROW]
[ROW][C]33[/C][C]-0.092543[/C][C]-0.6609[/C][C]0.255828[/C][/ROW]
[ROW][C]34[/C][C]-0.063974[/C][C]-0.4569[/C][C]0.324855[/C][/ROW]
[ROW][C]35[/C][C]0.055337[/C][C]0.3952[/C][C]0.347178[/C][/ROW]
[ROW][C]36[/C][C]0.192694[/C][C]1.3761[/C][C]0.087401[/C][/ROW]
[ROW][C]37[/C][C]0.063409[/C][C]0.4528[/C][C]0.326296[/C][/ROW]
[ROW][C]38[/C][C]0.165669[/C][C]1.1831[/C][C]0.121126[/C][/ROW]
[ROW][C]39[/C][C]0.014645[/C][C]0.1046[/C][C]0.458558[/C][/ROW]
[ROW][C]40[/C][C]-0.081113[/C][C]-0.5793[/C][C]0.28248[/C][/ROW]
[ROW][C]41[/C][C]-0.0619[/C][C]-0.4421[/C][C]0.330159[/C][/ROW]
[ROW][C]42[/C][C]-0.139417[/C][C]-0.9956[/C][C]0.162063[/C][/ROW]
[ROW][C]43[/C][C]-0.029113[/C][C]-0.2079[/C][C]0.418065[/C][/ROW]
[ROW][C]44[/C][C]-0.090573[/C][C]-0.6468[/C][C]0.260325[/C][/ROW]
[ROW][C]45[/C][C]-0.063232[/C][C]-0.4516[/C][C]0.326747[/C][/ROW]
[ROW][C]46[/C][C]-0.071463[/C][C]-0.5103[/C][C]0.306006[/C][/ROW]
[ROW][C]47[/C][C]-0.036435[/C][C]-0.2602[/C][C]0.39788[/C][/ROW]
[ROW][C]48[/C][C]0.040677[/C][C]0.2905[/C][C]0.386309[/C][/ROW]
[/TABLE]
Source: https://freestatistics.org/blog/index.php?pk=302712&T=1

Globally Unique Identifier (entire table): ba.freestatistics.org/blog/index.php?pk=302712&T=1

As an alternative you can also use a QR Code:  

The GUIDs for individual cells are displayed in the table below:

Autocorrelation Function
Time lag kACF(k)T-STATP-value
10.019150.13680.445879
20.0976190.69710.24444
30.121660.86880.194506
4-0.283305-2.02320.024155
50.0201010.14350.443211
60.0096240.06870.472736
7-0.141889-1.01330.157853
8-0.01886-0.13470.446695
9-0.063934-0.45660.324956
10-0.163025-1.16420.124875
110.0315330.22520.411366
120.280452.00280.025263
13-0.061691-0.44060.330696
140.0385910.27560.391987
15-0.00873-0.06230.475266
16-0.099018-0.70710.241353
170.0789960.56410.287565
180.0835450.59660.276698
190.0715040.51060.305904
200.0677890.48410.31519
21-0.013562-0.09690.461612
22-0.168518-1.20350.117177
23-0.00016-0.00110.499547
240.1577921.12690.132538
25-0.119897-0.85620.197935
260.1437241.02640.154775
27-0.092184-0.65830.256645
28-0.100205-0.71560.238748
29-0.059743-0.42660.335715
30-0.084409-0.60280.274657
31-0.011661-0.08330.466979
32-0.026911-0.19220.42418
33-0.092543-0.66090.255828
34-0.063974-0.45690.324855
350.0553370.39520.347178
360.1926941.37610.087401
370.0634090.45280.326296
380.1656691.18310.121126
390.0146450.10460.458558
40-0.081113-0.57930.28248
41-0.0619-0.44210.330159
42-0.139417-0.99560.162063
43-0.029113-0.20790.418065
44-0.090573-0.64680.260325
45-0.063232-0.45160.326747
46-0.071463-0.51030.306006
47-0.036435-0.26020.39788
480.0406770.29050.386309


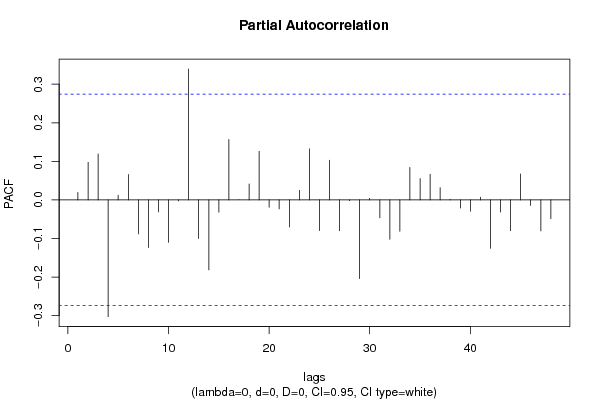
Partial Autocorrelation Function
Time lag kPACF(k)T-STATP-value
10.019150.13680.445879
20.0972880.69480.245174
30.1192820.85180.199142
4-0.302819-2.16260.017644
50.0122240.08730.465389
60.0657440.46950.320355
7-0.088187-0.62980.265824
8-0.123279-0.88040.19139
9-0.031082-0.2220.412612
10-0.110229-0.78720.217405
11-0.002649-0.01890.492491
120.3396282.42540.009434
13-0.100265-0.7160.238619
14-0.181497-1.29610.100379
15-0.031772-0.22690.410705
160.1567341.11930.134127
17-0.000223-0.00160.499368
180.0413590.29540.384458
190.1257940.89830.18661
20-0.019191-0.13710.445764
21-0.023257-0.16610.434371
22-0.070248-0.50170.309029
230.0248070.17720.430042
240.132370.94530.174478
25-0.079633-0.56870.28603
260.1028380.73440.233031
27-0.079878-0.57040.285441
28-0.001946-0.01390.494482
29-0.20412-1.45770.075526
300.0040150.02870.488617
31-0.046571-0.33260.370406
32-0.102018-0.72860.234802
33-0.081398-0.58130.2818
340.0840490.60020.275506
350.0551780.3940.347594
360.0666880.47620.317967
370.0314070.22430.411715
380.0011510.00820.496737
39-0.020953-0.14960.440822
40-0.029248-0.20890.417691
410.0068070.04860.480709
42-0.125497-0.89620.187172
43-0.03133-0.22370.411926
44-0.080082-0.57190.284952
450.0673890.48130.316196
46-0.014498-0.10350.458971
47-0.080433-0.57440.284109
48-0.048894-0.34920.364198

\begin{tabular}{lllllllll}
\hline
Partial Autocorrelation Function \tabularnewline
Time lag k & PACF(k) & T-STAT & P-value \tabularnewline
1 & 0.01915 & 0.1368 & 0.445879 \tabularnewline
2 & 0.097288 & 0.6948 & 0.245174 \tabularnewline
3 & 0.119282 & 0.8518 & 0.199142 \tabularnewline
4 & -0.302819 & -2.1626 & 0.017644 \tabularnewline
5 & 0.012224 & 0.0873 & 0.465389 \tabularnewline
6 & 0.065744 & 0.4695 & 0.320355 \tabularnewline
7 & -0.088187 & -0.6298 & 0.265824 \tabularnewline
8 & -0.123279 & -0.8804 & 0.19139 \tabularnewline
9 & -0.031082 & -0.222 & 0.412612 \tabularnewline
10 & -0.110229 & -0.7872 & 0.217405 \tabularnewline
11 & -0.002649 & -0.0189 & 0.492491 \tabularnewline
12 & 0.339628 & 2.4254 & 0.009434 \tabularnewline
13 & -0.100265 & -0.716 & 0.238619 \tabularnewline
14 & -0.181497 & -1.2961 & 0.100379 \tabularnewline
15 & -0.031772 & -0.2269 & 0.410705 \tabularnewline
16 & 0.156734 & 1.1193 & 0.134127 \tabularnewline
17 & -0.000223 & -0.0016 & 0.499368 \tabularnewline
18 & 0.041359 & 0.2954 & 0.384458 \tabularnewline
19 & 0.125794 & 0.8983 & 0.18661 \tabularnewline
20 & -0.019191 & -0.1371 & 0.445764 \tabularnewline
21 & -0.023257 & -0.1661 & 0.434371 \tabularnewline
22 & -0.070248 & -0.5017 & 0.309029 \tabularnewline
23 & 0.024807 & 0.1772 & 0.430042 \tabularnewline
24 & 0.13237 & 0.9453 & 0.174478 \tabularnewline
25 & -0.079633 & -0.5687 & 0.28603 \tabularnewline
26 & 0.102838 & 0.7344 & 0.233031 \tabularnewline
27 & -0.079878 & -0.5704 & 0.285441 \tabularnewline
28 & -0.001946 & -0.0139 & 0.494482 \tabularnewline
29 & -0.20412 & -1.4577 & 0.075526 \tabularnewline
30 & 0.004015 & 0.0287 & 0.488617 \tabularnewline
31 & -0.046571 & -0.3326 & 0.370406 \tabularnewline
32 & -0.102018 & -0.7286 & 0.234802 \tabularnewline
33 & -0.081398 & -0.5813 & 0.2818 \tabularnewline
34 & 0.084049 & 0.6002 & 0.275506 \tabularnewline
35 & 0.055178 & 0.394 & 0.347594 \tabularnewline
36 & 0.066688 & 0.4762 & 0.317967 \tabularnewline
37 & 0.031407 & 0.2243 & 0.411715 \tabularnewline
38 & 0.001151 & 0.0082 & 0.496737 \tabularnewline
39 & -0.020953 & -0.1496 & 0.440822 \tabularnewline
40 & -0.029248 & -0.2089 & 0.417691 \tabularnewline
41 & 0.006807 & 0.0486 & 0.480709 \tabularnewline
42 & -0.125497 & -0.8962 & 0.187172 \tabularnewline
43 & -0.03133 & -0.2237 & 0.411926 \tabularnewline
44 & -0.080082 & -0.5719 & 0.284952 \tabularnewline
45 & 0.067389 & 0.4813 & 0.316196 \tabularnewline
46 & -0.014498 & -0.1035 & 0.458971 \tabularnewline
47 & -0.080433 & -0.5744 & 0.284109 \tabularnewline
48 & -0.048894 & -0.3492 & 0.364198 \tabularnewline
\hline
\end{tabular}
%Source: https://freestatistics.org/blog/index.php?pk=302712&T=2

[TABLE]
[ROW][C]Partial Autocorrelation Function[/C][/ROW]
[ROW][C]Time lag k[/C][C]PACF(k)[/C][C]T-STAT[/C][C]P-value[/C][/ROW]
[ROW][C]1[/C][C]0.01915[/C][C]0.1368[/C][C]0.445879[/C][/ROW]
[ROW][C]2[/C][C]0.097288[/C][C]0.6948[/C][C]0.245174[/C][/ROW]
[ROW][C]3[/C][C]0.119282[/C][C]0.8518[/C][C]0.199142[/C][/ROW]
[ROW][C]4[/C][C]-0.302819[/C][C]-2.1626[/C][C]0.017644[/C][/ROW]
[ROW][C]5[/C][C]0.012224[/C][C]0.0873[/C][C]0.465389[/C][/ROW]
[ROW][C]6[/C][C]0.065744[/C][C]0.4695[/C][C]0.320355[/C][/ROW]
[ROW][C]7[/C][C]-0.088187[/C][C]-0.6298[/C][C]0.265824[/C][/ROW]
[ROW][C]8[/C][C]-0.123279[/C][C]-0.8804[/C][C]0.19139[/C][/ROW]
[ROW][C]9[/C][C]-0.031082[/C][C]-0.222[/C][C]0.412612[/C][/ROW]
[ROW][C]10[/C][C]-0.110229[/C][C]-0.7872[/C][C]0.217405[/C][/ROW]
[ROW][C]11[/C][C]-0.002649[/C][C]-0.0189[/C][C]0.492491[/C][/ROW]
[ROW][C]12[/C][C]0.339628[/C][C]2.4254[/C][C]0.009434[/C][/ROW]
[ROW][C]13[/C][C]-0.100265[/C][C]-0.716[/C][C]0.238619[/C][/ROW]
[ROW][C]14[/C][C]-0.181497[/C][C]-1.2961[/C][C]0.100379[/C][/ROW]
[ROW][C]15[/C][C]-0.031772[/C][C]-0.2269[/C][C]0.410705[/C][/ROW]
[ROW][C]16[/C][C]0.156734[/C][C]1.1193[/C][C]0.134127[/C][/ROW]
[ROW][C]17[/C][C]-0.000223[/C][C]-0.0016[/C][C]0.499368[/C][/ROW]
[ROW][C]18[/C][C]0.041359[/C][C]0.2954[/C][C]0.384458[/C][/ROW]
[ROW][C]19[/C][C]0.125794[/C][C]0.8983[/C][C]0.18661[/C][/ROW]
[ROW][C]20[/C][C]-0.019191[/C][C]-0.1371[/C][C]0.445764[/C][/ROW]
[ROW][C]21[/C][C]-0.023257[/C][C]-0.1661[/C][C]0.434371[/C][/ROW]
[ROW][C]22[/C][C]-0.070248[/C][C]-0.5017[/C][C]0.309029[/C][/ROW]
[ROW][C]23[/C][C]0.024807[/C][C]0.1772[/C][C]0.430042[/C][/ROW]
[ROW][C]24[/C][C]0.13237[/C][C]0.9453[/C][C]0.174478[/C][/ROW]
[ROW][C]25[/C][C]-0.079633[/C][C]-0.5687[/C][C]0.28603[/C][/ROW]
[ROW][C]26[/C][C]0.102838[/C][C]0.7344[/C][C]0.233031[/C][/ROW]
[ROW][C]27[/C][C]-0.079878[/C][C]-0.5704[/C][C]0.285441[/C][/ROW]
[ROW][C]28[/C][C]-0.001946[/C][C]-0.0139[/C][C]0.494482[/C][/ROW]
[ROW][C]29[/C][C]-0.20412[/C][C]-1.4577[/C][C]0.075526[/C][/ROW]
[ROW][C]30[/C][C]0.004015[/C][C]0.0287[/C][C]0.488617[/C][/ROW]
[ROW][C]31[/C][C]-0.046571[/C][C]-0.3326[/C][C]0.370406[/C][/ROW]
[ROW][C]32[/C][C]-0.102018[/C][C]-0.7286[/C][C]0.234802[/C][/ROW]
[ROW][C]33[/C][C]-0.081398[/C][C]-0.5813[/C][C]0.2818[/C][/ROW]
[ROW][C]34[/C][C]0.084049[/C][C]0.6002[/C][C]0.275506[/C][/ROW]
[ROW][C]35[/C][C]0.055178[/C][C]0.394[/C][C]0.347594[/C][/ROW]
[ROW][C]36[/C][C]0.066688[/C][C]0.4762[/C][C]0.317967[/C][/ROW]
[ROW][C]37[/C][C]0.031407[/C][C]0.2243[/C][C]0.411715[/C][/ROW]
[ROW][C]38[/C][C]0.001151[/C][C]0.0082[/C][C]0.496737[/C][/ROW]
[ROW][C]39[/C][C]-0.020953[/C][C]-0.1496[/C][C]0.440822[/C][/ROW]
[ROW][C]40[/C][C]-0.029248[/C][C]-0.2089[/C][C]0.417691[/C][/ROW]
[ROW][C]41[/C][C]0.006807[/C][C]0.0486[/C][C]0.480709[/C][/ROW]
[ROW][C]42[/C][C]-0.125497[/C][C]-0.8962[/C][C]0.187172[/C][/ROW]
[ROW][C]43[/C][C]-0.03133[/C][C]-0.2237[/C][C]0.411926[/C][/ROW]
[ROW][C]44[/C][C]-0.080082[/C][C]-0.5719[/C][C]0.284952[/C][/ROW]
[ROW][C]45[/C][C]0.067389[/C][C]0.4813[/C][C]0.316196[/C][/ROW]
[ROW][C]46[/C][C]-0.014498[/C][C]-0.1035[/C][C]0.458971[/C][/ROW]
[ROW][C]47[/C][C]-0.080433[/C][C]-0.5744[/C][C]0.284109[/C][/ROW]
[ROW][C]48[/C][C]-0.048894[/C][C]-0.3492[/C][C]0.364198[/C][/ROW]
[/TABLE]
Source: https://freestatistics.org/blog/index.php?pk=302712&T=2

Globally Unique Identifier (entire table): ba.freestatistics.org/blog/index.php?pk=302712&T=2

As an alternative you can also use a QR Code:  

The GUIDs for individual cells are displayed in the table below:

Partial Autocorrelation Function
Time lag kPACF(k)T-STATP-value
10.019150.13680.445879
20.0972880.69480.245174
30.1192820.85180.199142
4-0.302819-2.16260.017644
50.0122240.08730.465389
60.0657440.46950.320355
7-0.088187-0.62980.265824
8-0.123279-0.88040.19139
9-0.031082-0.2220.412612
10-0.110229-0.78720.217405
11-0.002649-0.01890.492491
120.3396282.42540.009434
13-0.100265-0.7160.238619
14-0.181497-1.29610.100379
15-0.031772-0.22690.410705
160.1567341.11930.134127
17-0.000223-0.00160.499368
180.0413590.29540.384458
190.1257940.89830.18661
20-0.019191-0.13710.445764
21-0.023257-0.16610.434371
22-0.070248-0.50170.309029
230.0248070.17720.430042
240.132370.94530.174478
25-0.079633-0.56870.28603
260.1028380.73440.233031
27-0.079878-0.57040.285441
28-0.001946-0.01390.494482
29-0.20412-1.45770.075526
300.0040150.02870.488617
31-0.046571-0.33260.370406
32-0.102018-0.72860.234802
33-0.081398-0.58130.2818
340.0840490.60020.275506
350.0551780.3940.347594
360.0666880.47620.317967
370.0314070.22430.411715
380.0011510.00820.496737
39-0.020953-0.14960.440822
40-0.029248-0.20890.417691
410.0068070.04860.480709
42-0.125497-0.89620.187172
43-0.03133-0.22370.411926
44-0.080082-0.57190.284952
450.0673890.48130.316196
46-0.014498-0.10350.458971
47-0.080433-0.57440.284109
48-0.048894-0.34920.364198


Parameters (Session):
par1 = 1 ;
Parameters (R input):
par1 = 48 ; par2 = 0.0 ; par3 = 0 ; par4 = 0 ; par5 = 12 ; par6 = White Noise ; par7 = 0.95 ; par8 = ;
R code (references can be found in the software module):
par8 <- ''
par7 <- '0.95'
par6 <- 'White Noise'
par5 <- '12'
par4 <- '0'
par3 <- '0'
par2 <- '0.0'
par1 <- 'Default'
if (par1 == 'Default') {
par1 = 10*log10(length(x))
} else {
par1 <- as.numeric(par1)
}
par2 <- as.numeric(par2)
par3 <- as.numeric(par3)
par4 <- as.numeric(par4)
par5 <- as.numeric(par5)
if (par6 == 'White Noise') par6 <- 'white' else par6 <- 'ma'
par7 <- as.numeric(par7)
if (par8 != '') par8 <- as.numeric(par8)
x <- na.omit(x)
ox <- x
if (par8 == '') {
if (par2 == 0) {
x <- log(x)
} else {
x <- (x ^ par2 - 1) / par2
}
} else {
x <- log(x,base=par8)
}
if (par3 > 0) x <- diff(x,lag=1,difference=par3)
if (par4 > 0) x <- diff(x,lag=par5,difference=par4)
bitmap(file='picts.png')
op <- par(mfrow=c(2,1))
plot(ox,type='l',main='Original Time Series',xlab='time',ylab='value')
if (par8=='') {
mytitle <- paste('Working Time Series (lambda=',par2,', d=',par3,', D=',par4,')',sep='')
mysub <- paste('(lambda=',par2,', d=',par3,', D=',par4,', CI=', par7, ', CI type=',par6,')',sep='')
} else {
mytitle <- paste('Working Time Series (base=',par8,', d=',par3,', D=',par4,')',sep='')
mysub <- paste('(base=',par8,', d=',par3,', D=',par4,', CI=', par7, ', CI type=',par6,')',sep='')
}
plot(x,type='l', main=mytitle,xlab='time',ylab='value')
par(op)
dev.off()
bitmap(file='pic1.png')
racf <- acf(x, par1, main='Autocorrelation', xlab='time lag', ylab='ACF', ci.type=par6, ci=par7, sub=mysub)
dev.off()
bitmap(file='pic2.png')
rpacf <- pacf(x,par1,main='Partial Autocorrelation',xlab='lags',ylab='PACF',sub=mysub)
dev.off()
(myacf <- c(racf$acf))
(mypacf <- c(rpacf$acf))
lengthx <- length(x)
sqrtn <- sqrt(lengthx)
load(file='createtable')
a<-table.start()
a<-table.row.start(a)
a<-table.element(a,'Autocorrelation Function',4,TRUE)
a<-table.row.end(a)
a<-table.row.start(a)
a<-table.element(a,'Time lag k',header=TRUE)
a<-table.element(a,'ACF(k)',header=TRUE)
a<-table.element(a,'T-STAT',header=TRUE)
a<-table.element(a,'P-value',header=TRUE)
a<-table.row.end(a)
for (i in 2:(par1+1)) {
a<-table.row.start(a)
a<-table.element(a,i-1,header=TRUE)
a<-table.element(a,round(myacf[i],6))
mytstat <- myacf[i]*sqrtn
a<-table.element(a,round(mytstat,4))
a<-table.element(a,round(1-pt(abs(mytstat),lengthx),6))
a<-table.row.end(a)
}
a<-table.end(a)
table.save(a,file='mytable.tab')
a<-table.start()
a<-table.row.start(a)
a<-table.element(a,'Partial Autocorrelation Function',4,TRUE)
a<-table.row.end(a)
a<-table.row.start(a)
a<-table.element(a,'Time lag k',header=TRUE)
a<-table.element(a,'PACF(k)',header=TRUE)
a<-table.element(a,'T-STAT',header=TRUE)
a<-table.element(a,'P-value',header=TRUE)
a<-table.row.end(a)
for (i in 1:par1) {
a<-table.row.start(a)
a<-table.element(a,i,header=TRUE)
a<-table.element(a,round(mypacf[i],6))
mytstat <- mypacf[i]*sqrtn
a<-table.element(a,round(mytstat,4))
a<-table.element(a,round(1-pt(abs(mytstat),lengthx),6))
a<-table.row.end(a)
}
a<-table.end(a)
table.save(a,file='mytable1.tab')