Free Statistics

of Irreproducible Research!

Author's title

Author*The author of this computation has been verified*
R Software Modulerwasp_arimabackwardselection.wasp
Title produced by softwareARIMA Backward Selection
Date of computationThu, 22 Dec 2016 23:22:03 +0100
Cite this page as followsStatistical Computations at FreeStatistics.org, Office for Research Development and Education, URL https://freestatistics.org/blog/index.php?v=date/2016/Dec/22/t1482446149eqqutezse7dey8x.htm/, Retrieved Mon, 29 Apr 2024 01:40:25 +0000
Statistical Computations at FreeStatistics.org, Office for Research Development and Education, URL https://freestatistics.org/blog/index.php?pk=302718, Retrieved Mon, 29 Apr 2024 01:40:25 +0000
QR Codes:

Original text written by user:
IsPrivate?No (this computation is public)
User-defined keywords
Estimated Impact56
Family? (F = Feedback message, R = changed R code, M = changed R Module, P = changed Parameters, D = changed Data)
-       [ARIMA Backward Selection] [ARIMA backward se...] [2016-12-22 22:22:03] [d4ebbcc95b180bc93fc42d05f31a3dde] [Current]
Feedback Forum

Post a new message
Dataseries X:
5500
3860
4880
4420
4900
4230
3970
4690
4190
4960
5590
5000
6030
4690
4090
5070
5050
4520
5070
4290
4400
5080
4180
5230
5200
3800
5010
4420
4810
4690
5390
4730
4770
4690
4450
5400
5590
4360
5370
4660
4450
4980
4590
4580
4290
4840
5100
6170
5990
4950
5310


Summary of computational transaction
Raw Input view raw input (R code)
Raw Outputview raw output of R engine
Computing time7 seconds
R ServerBig Analytics Cloud Computing Center

\begin{tabular}{lllllllll}
\hline
Summary of computational transaction \tabularnewline
Raw Input view raw input (R code)  \tabularnewline
Raw Outputview raw output of R engine  \tabularnewline
Computing time7 seconds \tabularnewline
R ServerBig Analytics Cloud Computing Center \tabularnewline
\hline
\end{tabular}
%Source: https://freestatistics.org/blog/index.php?pk=302718&T=0

[TABLE]
[ROW]
Summary of computational transaction[/C][/ROW] [ROW]Raw Input[/C] view raw input (R code) [/C][/ROW] [ROW]Raw Output[/C]view raw output of R engine [/C][/ROW] [ROW]Computing time[/C]7 seconds[/C][/ROW] [ROW]R Server[/C]Big Analytics Cloud Computing Center[/C][/ROW] [/TABLE] Source: https://freestatistics.org/blog/index.php?pk=302718&T=0

Globally Unique Identifier (entire table): ba.freestatistics.org/blog/index.php?pk=302718&T=0

As an alternative you can also use a QR Code:  

The GUIDs for individual cells are displayed in the table below:

Summary of computational transaction
Raw Input view raw input (R code)
Raw Outputview raw output of R engine
Computing time7 seconds
R ServerBig Analytics Cloud Computing Center


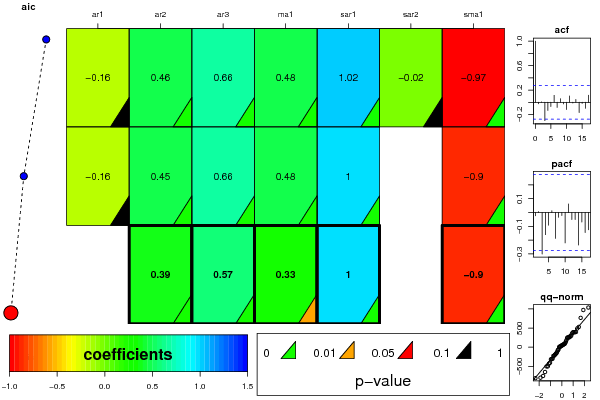
ARIMA Parameter Estimation and Backward Selection
Iterationar1ar2ar3ma1sar1sar2sma1
Estimates ( 1 )-0.1610.46160.65630.48261.0212-0.0216-0.9679
(p-val)(0.2974 )(1e-04 )(0 )(0.008 )(1e-04 )(0.9271 )(0 )
Estimates ( 2 )-0.15660.45240.66040.47790.99590-0.8979
(p-val)(0.2974 )(1e-04 )(0 )(0.0085 )(0 )(NA )(0 )
Estimates ( 3 )00.38960.57380.33110.99530-0.896
(p-val)(NA )(0 )(0 )(0.0178 )(0 )(NA )(0 )
Estimates ( 4 )NANANANANANANA
(p-val)(NA )(NA )(NA )(NA )(NA )(NA )(NA )
Estimates ( 5 )NANANANANANANA
(p-val)(NA )(NA )(NA )(NA )(NA )(NA )(NA )
Estimates ( 6 )NANANANANANANA
(p-val)(NA )(NA )(NA )(NA )(NA )(NA )(NA )
Estimates ( 7 )NANANANANANANA
(p-val)(NA )(NA )(NA )(NA )(NA )(NA )(NA )
Estimates ( 8 )NANANANANANANA
(p-val)(NA )(NA )(NA )(NA )(NA )(NA )(NA )
Estimates ( 9 )NANANANANANANA
(p-val)(NA )(NA )(NA )(NA )(NA )(NA )(NA )
Estimates ( 10 )NANANANANANANA
(p-val)(NA )(NA )(NA )(NA )(NA )(NA )(NA )
Estimates ( 11 )NANANANANANANA
(p-val)(NA )(NA )(NA )(NA )(NA )(NA )(NA )
Estimates ( 12 )NANANANANANANA
(p-val)(NA )(NA )(NA )(NA )(NA )(NA )(NA )
Estimates ( 13 )NANANANANANANA
(p-val)(NA )(NA )(NA )(NA )(NA )(NA )(NA )

\begin{tabular}{lllllllll}
\hline
ARIMA Parameter Estimation and Backward Selection \tabularnewline
Iteration & ar1 & ar2 & ar3 & ma1 & sar1 & sar2 & sma1 \tabularnewline
Estimates ( 1 ) & -0.161 & 0.4616 & 0.6563 & 0.4826 & 1.0212 & -0.0216 & -0.9679 \tabularnewline
(p-val) & (0.2974 ) & (1e-04 ) & (0 ) & (0.008 ) & (1e-04 ) & (0.9271 ) & (0 ) \tabularnewline
Estimates ( 2 ) & -0.1566 & 0.4524 & 0.6604 & 0.4779 & 0.9959 & 0 & -0.8979 \tabularnewline
(p-val) & (0.2974 ) & (1e-04 ) & (0 ) & (0.0085 ) & (0 ) & (NA ) & (0 ) \tabularnewline
Estimates ( 3 ) & 0 & 0.3896 & 0.5738 & 0.3311 & 0.9953 & 0 & -0.896 \tabularnewline
(p-val) & (NA ) & (0 ) & (0 ) & (0.0178 ) & (0 ) & (NA ) & (0 ) \tabularnewline
Estimates ( 4 ) & NA & NA & NA & NA & NA & NA & NA \tabularnewline
(p-val) & (NA ) & (NA ) & (NA ) & (NA ) & (NA ) & (NA ) & (NA ) \tabularnewline
Estimates ( 5 ) & NA & NA & NA & NA & NA & NA & NA \tabularnewline
(p-val) & (NA ) & (NA ) & (NA ) & (NA ) & (NA ) & (NA ) & (NA ) \tabularnewline
Estimates ( 6 ) & NA & NA & NA & NA & NA & NA & NA \tabularnewline
(p-val) & (NA ) & (NA ) & (NA ) & (NA ) & (NA ) & (NA ) & (NA ) \tabularnewline
Estimates ( 7 ) & NA & NA & NA & NA & NA & NA & NA \tabularnewline
(p-val) & (NA ) & (NA ) & (NA ) & (NA ) & (NA ) & (NA ) & (NA ) \tabularnewline
Estimates ( 8 ) & NA & NA & NA & NA & NA & NA & NA \tabularnewline
(p-val) & (NA ) & (NA ) & (NA ) & (NA ) & (NA ) & (NA ) & (NA ) \tabularnewline
Estimates ( 9 ) & NA & NA & NA & NA & NA & NA & NA \tabularnewline
(p-val) & (NA ) & (NA ) & (NA ) & (NA ) & (NA ) & (NA ) & (NA ) \tabularnewline
Estimates ( 10 ) & NA & NA & NA & NA & NA & NA & NA \tabularnewline
(p-val) & (NA ) & (NA ) & (NA ) & (NA ) & (NA ) & (NA ) & (NA ) \tabularnewline
Estimates ( 11 ) & NA & NA & NA & NA & NA & NA & NA \tabularnewline
(p-val) & (NA ) & (NA ) & (NA ) & (NA ) & (NA ) & (NA ) & (NA ) \tabularnewline
Estimates ( 12 ) & NA & NA & NA & NA & NA & NA & NA \tabularnewline
(p-val) & (NA ) & (NA ) & (NA ) & (NA ) & (NA ) & (NA ) & (NA ) \tabularnewline
Estimates ( 13 ) & NA & NA & NA & NA & NA & NA & NA \tabularnewline
(p-val) & (NA ) & (NA ) & (NA ) & (NA ) & (NA ) & (NA ) & (NA ) \tabularnewline
\hline
\end{tabular}
%Source: https://freestatistics.org/blog/index.php?pk=302718&T=1

[TABLE]
[ROW][C]ARIMA Parameter Estimation and Backward Selection[/C][/ROW]
[ROW][C]Iteration[/C][C]ar1[/C][C]ar2[/C][C]ar3[/C][C]ma1[/C][C]sar1[/C][C]sar2[/C][C]sma1[/C][/ROW]
[ROW][C]Estimates ( 1 )[/C][C]-0.161[/C][C]0.4616[/C][C]0.6563[/C][C]0.4826[/C][C]1.0212[/C][C]-0.0216[/C][C]-0.9679[/C][/ROW]
[ROW][C](p-val)[/C][C](0.2974 )[/C][C](1e-04 )[/C][C](0 )[/C][C](0.008 )[/C][C](1e-04 )[/C][C](0.9271 )[/C][C](0 )[/C][/ROW]
[ROW][C]Estimates ( 2 )[/C][C]-0.1566[/C][C]0.4524[/C][C]0.6604[/C][C]0.4779[/C][C]0.9959[/C][C]0[/C][C]-0.8979[/C][/ROW]
[ROW][C](p-val)[/C][C](0.2974 )[/C][C](1e-04 )[/C][C](0 )[/C][C](0.0085 )[/C][C](0 )[/C][C](NA )[/C][C](0 )[/C][/ROW]
[ROW][C]Estimates ( 3 )[/C][C]0[/C][C]0.3896[/C][C]0.5738[/C][C]0.3311[/C][C]0.9953[/C][C]0[/C][C]-0.896[/C][/ROW]
[ROW][C](p-val)[/C][C](NA )[/C][C](0 )[/C][C](0 )[/C][C](0.0178 )[/C][C](0 )[/C][C](NA )[/C][C](0 )[/C][/ROW]
[ROW][C]Estimates ( 4 )[/C][C]NA[/C][C]NA[/C][C]NA[/C][C]NA[/C][C]NA[/C][C]NA[/C][C]NA[/C][/ROW]
[ROW][C](p-val)[/C][C](NA )[/C][C](NA )[/C][C](NA )[/C][C](NA )[/C][C](NA )[/C][C](NA )[/C][C](NA )[/C][/ROW]
[ROW][C]Estimates ( 5 )[/C][C]NA[/C][C]NA[/C][C]NA[/C][C]NA[/C][C]NA[/C][C]NA[/C][C]NA[/C][/ROW]
[ROW][C](p-val)[/C][C](NA )[/C][C](NA )[/C][C](NA )[/C][C](NA )[/C][C](NA )[/C][C](NA )[/C][C](NA )[/C][/ROW]
[ROW][C]Estimates ( 6 )[/C][C]NA[/C][C]NA[/C][C]NA[/C][C]NA[/C][C]NA[/C][C]NA[/C][C]NA[/C][/ROW]
[ROW][C](p-val)[/C][C](NA )[/C][C](NA )[/C][C](NA )[/C][C](NA )[/C][C](NA )[/C][C](NA )[/C][C](NA )[/C][/ROW]
[ROW][C]Estimates ( 7 )[/C][C]NA[/C][C]NA[/C][C]NA[/C][C]NA[/C][C]NA[/C][C]NA[/C][C]NA[/C][/ROW]
[ROW][C](p-val)[/C][C](NA )[/C][C](NA )[/C][C](NA )[/C][C](NA )[/C][C](NA )[/C][C](NA )[/C][C](NA )[/C][/ROW]
[ROW][C]Estimates ( 8 )[/C][C]NA[/C][C]NA[/C][C]NA[/C][C]NA[/C][C]NA[/C][C]NA[/C][C]NA[/C][/ROW]
[ROW][C](p-val)[/C][C](NA )[/C][C](NA )[/C][C](NA )[/C][C](NA )[/C][C](NA )[/C][C](NA )[/C][C](NA )[/C][/ROW]
[ROW][C]Estimates ( 9 )[/C][C]NA[/C][C]NA[/C][C]NA[/C][C]NA[/C][C]NA[/C][C]NA[/C][C]NA[/C][/ROW]
[ROW][C](p-val)[/C][C](NA )[/C][C](NA )[/C][C](NA )[/C][C](NA )[/C][C](NA )[/C][C](NA )[/C][C](NA )[/C][/ROW]
[ROW][C]Estimates ( 10 )[/C][C]NA[/C][C]NA[/C][C]NA[/C][C]NA[/C][C]NA[/C][C]NA[/C][C]NA[/C][/ROW]
[ROW][C](p-val)[/C][C](NA )[/C][C](NA )[/C][C](NA )[/C][C](NA )[/C][C](NA )[/C][C](NA )[/C][C](NA )[/C][/ROW]
[ROW][C]Estimates ( 11 )[/C][C]NA[/C][C]NA[/C][C]NA[/C][C]NA[/C][C]NA[/C][C]NA[/C][C]NA[/C][/ROW]
[ROW][C](p-val)[/C][C](NA )[/C][C](NA )[/C][C](NA )[/C][C](NA )[/C][C](NA )[/C][C](NA )[/C][C](NA )[/C][/ROW]
[ROW][C]Estimates ( 12 )[/C][C]NA[/C][C]NA[/C][C]NA[/C][C]NA[/C][C]NA[/C][C]NA[/C][C]NA[/C][/ROW]
[ROW][C](p-val)[/C][C](NA )[/C][C](NA )[/C][C](NA )[/C][C](NA )[/C][C](NA )[/C][C](NA )[/C][C](NA )[/C][/ROW]
[ROW][C]Estimates ( 13 )[/C][C]NA[/C][C]NA[/C][C]NA[/C][C]NA[/C][C]NA[/C][C]NA[/C][C]NA[/C][/ROW]
[ROW][C](p-val)[/C][C](NA )[/C][C](NA )[/C][C](NA )[/C][C](NA )[/C][C](NA )[/C][C](NA )[/C][C](NA )[/C][/ROW]
[/TABLE]
Source: https://freestatistics.org/blog/index.php?pk=302718&T=1

Globally Unique Identifier (entire table): ba.freestatistics.org/blog/index.php?pk=302718&T=1

As an alternative you can also use a QR Code:  

The GUIDs for individual cells are displayed in the table below:

ARIMA Parameter Estimation and Backward Selection
Iterationar1ar2ar3ma1sar1sar2sma1
Estimates ( 1 )-0.1610.46160.65630.48261.0212-0.0216-0.9679
(p-val)(0.2974 )(1e-04 )(0 )(0.008 )(1e-04 )(0.9271 )(0 )
Estimates ( 2 )-0.15660.45240.66040.47790.99590-0.8979
(p-val)(0.2974 )(1e-04 )(0 )(0.0085 )(0 )(NA )(0 )
Estimates ( 3 )00.38960.57380.33110.99530-0.896
(p-val)(NA )(0 )(0 )(0.0178 )(0 )(NA )(0 )
Estimates ( 4 )NANANANANANANA
(p-val)(NA )(NA )(NA )(NA )(NA )(NA )(NA )
Estimates ( 5 )NANANANANANANA
(p-val)(NA )(NA )(NA )(NA )(NA )(NA )(NA )
Estimates ( 6 )NANANANANANANA
(p-val)(NA )(NA )(NA )(NA )(NA )(NA )(NA )
Estimates ( 7 )NANANANANANANA
(p-val)(NA )(NA )(NA )(NA )(NA )(NA )(NA )
Estimates ( 8 )NANANANANANANA
(p-val)(NA )(NA )(NA )(NA )(NA )(NA )(NA )
Estimates ( 9 )NANANANANANANA
(p-val)(NA )(NA )(NA )(NA )(NA )(NA )(NA )
Estimates ( 10 )NANANANANANANA
(p-val)(NA )(NA )(NA )(NA )(NA )(NA )(NA )
Estimates ( 11 )NANANANANANANA
(p-val)(NA )(NA )(NA )(NA )(NA )(NA )(NA )
Estimates ( 12 )NANANANANANANA
(p-val)(NA )(NA )(NA )(NA )(NA )(NA )(NA )
Estimates ( 13 )NANANANANANANA
(p-val)(NA )(NA )(NA )(NA )(NA )(NA )(NA )


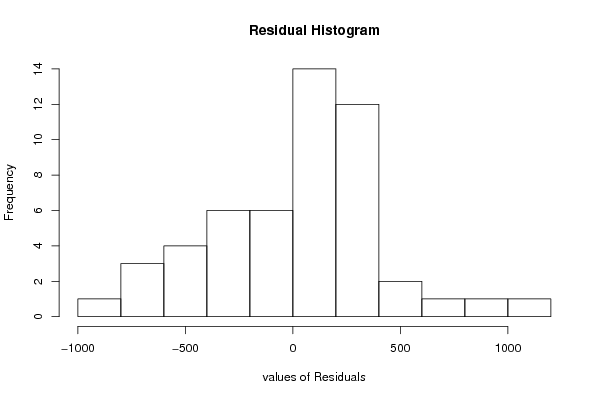
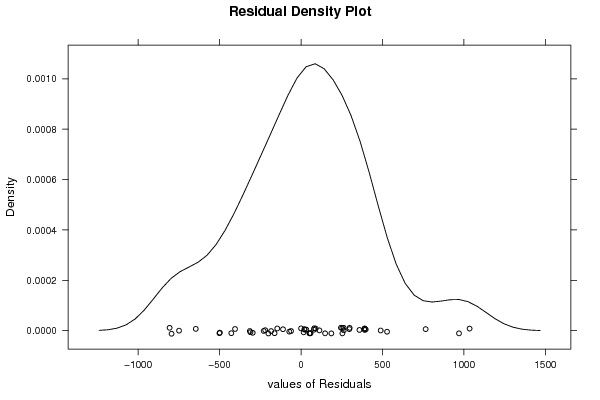
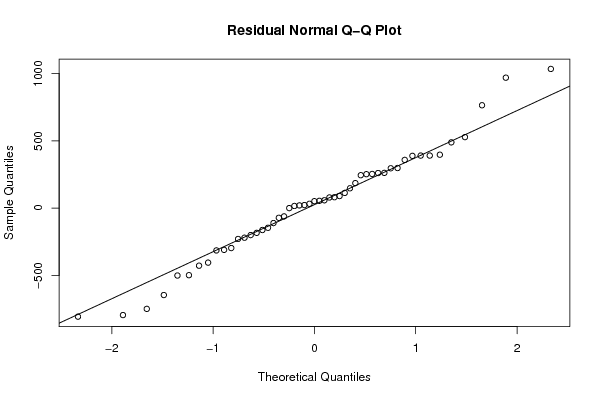
Estimated ARIMA Residuals
Value
489.019766284734
-794.676708272046
113.166587958228
-310.211510713054
528.112239220838
-500.801534560732
-314.350963993803
58.535559335092
90.0570897794873
252.436412477515
764.811044181328
147.744698315715
390.827933697549
-200.131259829305
-806.541213396855
81.1147634163039
253.964918336641
244.831455855429
186.092074900746
-427.845553118186
-145.937440005407
-61.2375044993235
-498.249793900285
298.399389219189
-110.723709187559
-162.461275190492
390.68207550851
16.1239155758458
32.4072873308045
54.4083054618922
969.672431197997
-183.683670928199
22.7628002419733
-748.664828406245
-229.170117104994
296.377010209758
388.670396911454
0.22746565991697
397.067922939727
-219.872073022246
-645.858773860792
262.161018227301
-71.8780078730676
79.3149152521053
-404.984582320702
261.093939577499
358.679071628764
1034.63836593118
51.7188424343926
20.4673437628566
-296.524623216322

\begin{tabular}{lllllllll}
\hline
Estimated ARIMA Residuals \tabularnewline
Value \tabularnewline
 \tabularnewline
489.019766284734 \tabularnewline
-794.676708272046 \tabularnewline
113.166587958228 \tabularnewline
-310.211510713054 \tabularnewline
528.112239220838 \tabularnewline
-500.801534560732 \tabularnewline
-314.350963993803 \tabularnewline
58.535559335092 \tabularnewline
90.0570897794873 \tabularnewline
252.436412477515 \tabularnewline
764.811044181328 \tabularnewline
147.744698315715 \tabularnewline
390.827933697549 \tabularnewline
-200.131259829305 \tabularnewline
-806.541213396855 \tabularnewline
81.1147634163039 \tabularnewline
253.964918336641 \tabularnewline
244.831455855429 \tabularnewline
186.092074900746 \tabularnewline
-427.845553118186 \tabularnewline
-145.937440005407 \tabularnewline
-61.2375044993235 \tabularnewline
-498.249793900285 \tabularnewline
298.399389219189 \tabularnewline
-110.723709187559 \tabularnewline
-162.461275190492 \tabularnewline
390.68207550851 \tabularnewline
16.1239155758458 \tabularnewline
32.4072873308045 \tabularnewline
54.4083054618922 \tabularnewline
969.672431197997 \tabularnewline
-183.683670928199 \tabularnewline
22.7628002419733 \tabularnewline
-748.664828406245 \tabularnewline
-229.170117104994 \tabularnewline
296.377010209758 \tabularnewline
388.670396911454 \tabularnewline
0.22746565991697 \tabularnewline
397.067922939727 \tabularnewline
-219.872073022246 \tabularnewline
-645.858773860792 \tabularnewline
262.161018227301 \tabularnewline
-71.8780078730676 \tabularnewline
79.3149152521053 \tabularnewline
-404.984582320702 \tabularnewline
261.093939577499 \tabularnewline
358.679071628764 \tabularnewline
1034.63836593118 \tabularnewline
51.7188424343926 \tabularnewline
20.4673437628566 \tabularnewline
-296.524623216322 \tabularnewline
\hline
\end{tabular}
%Source: https://freestatistics.org/blog/index.php?pk=302718&T=2

[TABLE]
[ROW][C]Estimated ARIMA Residuals[/C][/ROW]
[ROW][C]Value[/C][/ROW]
[ROW][C][/C][/ROW]
[ROW][C]489.019766284734[/C][/ROW]
[ROW][C]-794.676708272046[/C][/ROW]
[ROW][C]113.166587958228[/C][/ROW]
[ROW][C]-310.211510713054[/C][/ROW]
[ROW][C]528.112239220838[/C][/ROW]
[ROW][C]-500.801534560732[/C][/ROW]
[ROW][C]-314.350963993803[/C][/ROW]
[ROW][C]58.535559335092[/C][/ROW]
[ROW][C]90.0570897794873[/C][/ROW]
[ROW][C]252.436412477515[/C][/ROW]
[ROW][C]764.811044181328[/C][/ROW]
[ROW][C]147.744698315715[/C][/ROW]
[ROW][C]390.827933697549[/C][/ROW]
[ROW][C]-200.131259829305[/C][/ROW]
[ROW][C]-806.541213396855[/C][/ROW]
[ROW][C]81.1147634163039[/C][/ROW]
[ROW][C]253.964918336641[/C][/ROW]
[ROW][C]244.831455855429[/C][/ROW]
[ROW][C]186.092074900746[/C][/ROW]
[ROW][C]-427.845553118186[/C][/ROW]
[ROW][C]-145.937440005407[/C][/ROW]
[ROW][C]-61.2375044993235[/C][/ROW]
[ROW][C]-498.249793900285[/C][/ROW]
[ROW][C]298.399389219189[/C][/ROW]
[ROW][C]-110.723709187559[/C][/ROW]
[ROW][C]-162.461275190492[/C][/ROW]
[ROW][C]390.68207550851[/C][/ROW]
[ROW][C]16.1239155758458[/C][/ROW]
[ROW][C]32.4072873308045[/C][/ROW]
[ROW][C]54.4083054618922[/C][/ROW]
[ROW][C]969.672431197997[/C][/ROW]
[ROW][C]-183.683670928199[/C][/ROW]
[ROW][C]22.7628002419733[/C][/ROW]
[ROW][C]-748.664828406245[/C][/ROW]
[ROW][C]-229.170117104994[/C][/ROW]
[ROW][C]296.377010209758[/C][/ROW]
[ROW][C]388.670396911454[/C][/ROW]
[ROW][C]0.22746565991697[/C][/ROW]
[ROW][C]397.067922939727[/C][/ROW]
[ROW][C]-219.872073022246[/C][/ROW]
[ROW][C]-645.858773860792[/C][/ROW]
[ROW][C]262.161018227301[/C][/ROW]
[ROW][C]-71.8780078730676[/C][/ROW]
[ROW][C]79.3149152521053[/C][/ROW]
[ROW][C]-404.984582320702[/C][/ROW]
[ROW][C]261.093939577499[/C][/ROW]
[ROW][C]358.679071628764[/C][/ROW]
[ROW][C]1034.63836593118[/C][/ROW]
[ROW][C]51.7188424343926[/C][/ROW]
[ROW][C]20.4673437628566[/C][/ROW]
[ROW][C]-296.524623216322[/C][/ROW]
[/TABLE]
Source: https://freestatistics.org/blog/index.php?pk=302718&T=2

Globally Unique Identifier (entire table): ba.freestatistics.org/blog/index.php?pk=302718&T=2

As an alternative you can also use a QR Code:  

The GUIDs for individual cells are displayed in the table below:

Estimated ARIMA Residuals
Value
489.019766284734
-794.676708272046
113.166587958228
-310.211510713054
528.112239220838
-500.801534560732
-314.350963993803
58.535559335092
90.0570897794873
252.436412477515
764.811044181328
147.744698315715
390.827933697549
-200.131259829305
-806.541213396855
81.1147634163039
253.964918336641
244.831455855429
186.092074900746
-427.845553118186
-145.937440005407
-61.2375044993235
-498.249793900285
298.399389219189
-110.723709187559
-162.461275190492
390.68207550851
16.1239155758458
32.4072873308045
54.4083054618922
969.672431197997
-183.683670928199
22.7628002419733
-748.664828406245
-229.170117104994
296.377010209758
388.670396911454
0.22746565991697
397.067922939727
-219.872073022246
-645.858773860792
262.161018227301
-71.8780078730676
79.3149152521053
-404.984582320702
261.093939577499
358.679071628764
1034.63836593118
51.7188424343926
20.4673437628566
-296.524623216322


Parameters (Session):
par1 = 1 ;
Parameters (R input):
par1 = 1 ; par2 = 1 ; par3 = 0 ; par4 = 0 ; par5 = 12 ; par6 = 3 ; par7 = 1 ; par8 = 2 ; par9 = 1 ;
R code (references can be found in the software module):
library(lattice)
if (par1 == 'TRUE') par1 <- TRUE
if (par1 == 'FALSE') par1 <- FALSE
par2 <- as.numeric(par2) #Box-Cox lambda transformation parameter
par3 <- as.numeric(par3) #degree of non-seasonal differencing
par4 <- as.numeric(par4) #degree of seasonal differencing
par5 <- as.numeric(par5) #seasonal period
par6 <- as.numeric(par6) #degree (p) of the non-seasonal AR(p) polynomial
par7 <- as.numeric(par7) #degree (q) of the non-seasonal MA(q) polynomial
par8 <- as.numeric(par8) #degree (P) of the seasonal AR(P) polynomial
par9 <- as.numeric(par9) #degree (Q) of the seasonal MA(Q) polynomial
armaGR <- function(arima.out, names, n){
try1 <- arima.out$coef
try2 <- sqrt(diag(arima.out$var.coef))
try.data.frame <- data.frame(matrix(NA,ncol=4,nrow=length(names)))
dimnames(try.data.frame) <- list(names,c('coef','std','tstat','pv'))
try.data.frame[,1] <- try1
for(i in 1:length(try2)) try.data.frame[which(rownames(try.data.frame)==names(try2)[i]),2] <- try2[i]
try.data.frame[,3] <- try.data.frame[,1] / try.data.frame[,2]
try.data.frame[,4] <- round((1-pt(abs(try.data.frame[,3]),df=n-(length(try2)+1)))*2,5)
vector <- rep(NA,length(names))
vector[is.na(try.data.frame[,4])] <- 0
maxi <- which.max(try.data.frame[,4])
continue <- max(try.data.frame[,4],na.rm=TRUE) > .05
vector[maxi] <- 0
list(summary=try.data.frame,next.vector=vector,continue=continue)
}
arimaSelect <- function(series, order=c(13,0,0), seasonal=list(order=c(2,0,0),period=12), include.mean=F){
nrc <- order[1]+order[3]+seasonal$order[1]+seasonal$order[3]
coeff <- matrix(NA, nrow=nrc*2, ncol=nrc)
pval <- matrix(NA, nrow=nrc*2, ncol=nrc)
mylist <- rep(list(NULL), nrc)
names <- NULL
if(order[1] > 0) names <- paste('ar',1:order[1],sep='')
if(order[3] > 0) names <- c( names , paste('ma',1:order[3],sep='') )
if(seasonal$order[1] > 0) names <- c(names, paste('sar',1:seasonal$order[1],sep=''))
if(seasonal$order[3] > 0) names <- c(names, paste('sma',1:seasonal$order[3],sep=''))
arima.out <- arima(series, order=order, seasonal=seasonal, include.mean=include.mean, method='ML')
mylist[[1]] <- arima.out
last.arma <- armaGR(arima.out, names, length(series))
mystop <- FALSE
i <- 1
coeff[i,] <- last.arma[[1]][,1]
pval [i,] <- last.arma[[1]][,4]
i <- 2
aic <- arima.out$aic
while(!mystop){
mylist[[i]] <- arima.out
arima.out <- arima(series, order=order, seasonal=seasonal, include.mean=include.mean, method='ML', fixed=last.arma$next.vector)
aic <- c(aic, arima.out$aic)
last.arma <- armaGR(arima.out, names, length(series))
mystop <- !last.arma$continue
coeff[i,] <- last.arma[[1]][,1]
pval [i,] <- last.arma[[1]][,4]
i <- i+1
}
list(coeff, pval, mylist, aic=aic)
}
arimaSelectplot <- function(arimaSelect.out,noms,choix){
noms <- names(arimaSelect.out[[3]][[1]]$coef)
coeff <- arimaSelect.out[[1]]
k <- min(which(is.na(coeff[,1])))-1
coeff <- coeff[1:k,]
pval <- arimaSelect.out[[2]][1:k,]
aic <- arimaSelect.out$aic[1:k]
coeff[coeff==0] <- NA
n <- ncol(coeff)
if(missing(choix)) choix <- k
layout(matrix(c(1,1,1,2,
3,3,3,2,
3,3,3,4,
5,6,7,7),nr=4),
widths=c(10,35,45,15),
heights=c(30,30,15,15))
couleurs <- rainbow(75)[1:50]#(50)
ticks <- pretty(coeff)
par(mar=c(1,1,3,1))
plot(aic,k:1-.5,type='o',pch=21,bg='blue',cex=2,axes=F,lty=2,xpd=NA)
points(aic[choix],k-choix+.5,pch=21,cex=4,bg=2,xpd=NA)
title('aic',line=2)
par(mar=c(3,0,0,0))
plot(0,axes=F,xlab='',ylab='',xlim=range(ticks),ylim=c(.1,1))
rect(xleft = min(ticks) + (0:49)/50*(max(ticks)-min(ticks)),
xright = min(ticks) + (1:50)/50*(max(ticks)-min(ticks)),
ytop = rep(1,50),
ybottom= rep(0,50),col=couleurs,border=NA)
axis(1,ticks)
rect(xleft=min(ticks),xright=max(ticks),ytop=1,ybottom=0)
text(mean(coeff,na.rm=T),.5,'coefficients',cex=2,font=2)
par(mar=c(1,1,3,1))
image(1:n,1:k,t(coeff[k:1,]),axes=F,col=couleurs,zlim=range(ticks))
for(i in 1:n) for(j in 1:k) if(!is.na(coeff[j,i])) {
if(pval[j,i]<.01) symb = 'green'
else if( (pval[j,i]<.05) & (pval[j,i]>=.01)) symb = 'orange'
else if( (pval[j,i]<.1) & (pval[j,i]>=.05)) symb = 'red'
else symb = 'black'
polygon(c(i+.5 ,i+.2 ,i+.5 ,i+.5),
c(k-j+0.5,k-j+0.5,k-j+0.8,k-j+0.5),
col=symb)
if(j==choix) {
rect(xleft=i-.5,
xright=i+.5,
ybottom=k-j+1.5,
ytop=k-j+.5,
lwd=4)
text(i,
k-j+1,
round(coeff[j,i],2),
cex=1.2,
font=2)
}
else{
rect(xleft=i-.5,xright=i+.5,ybottom=k-j+1.5,ytop=k-j+.5)
text(i,k-j+1,round(coeff[j,i],2),cex=1.2,font=1)
}
}
axis(3,1:n,noms)
par(mar=c(0.5,0,0,0.5))
plot(0,axes=F,xlab='',ylab='',type='n',xlim=c(0,8),ylim=c(-.2,.8))
cols <- c('green','orange','red','black')
niv <- c('0','0.01','0.05','0.1')
for(i in 0:3){
polygon(c(1+2*i ,1+2*i ,1+2*i-.5 ,1+2*i),
c(.4 ,.7 , .4 , .4),
col=cols[i+1])
text(2*i,0.5,niv[i+1],cex=1.5)
}
text(8,.5,1,cex=1.5)
text(4,0,'p-value',cex=2)
box()
residus <- arimaSelect.out[[3]][[choix]]$res
par(mar=c(1,2,4,1))
acf(residus,main='')
title('acf',line=.5)
par(mar=c(1,2,4,1))
pacf(residus,main='')
title('pacf',line=.5)
par(mar=c(2,2,4,1))
qqnorm(residus,main='')
title('qq-norm',line=.5)
qqline(residus)
residus
}
if (par2 == 0) x <- log(x)
if (par2 != 0) x <- x^par2
(selection <- arimaSelect(x, order=c(par6,par3,par7), seasonal=list(order=c(par8,par4,par9), period=par5)))
bitmap(file='test1.png')
resid <- arimaSelectplot(selection)
dev.off()
resid
bitmap(file='test2.png')
acf(resid,length(resid)/2, main='Residual Autocorrelation Function')
dev.off()
bitmap(file='test3.png')
pacf(resid,length(resid)/2, main='Residual Partial Autocorrelation Function')
dev.off()
bitmap(file='test4.png')
cpgram(resid, main='Residual Cumulative Periodogram')
dev.off()
bitmap(file='test5.png')
hist(resid, main='Residual Histogram', xlab='values of Residuals')
dev.off()
bitmap(file='test6.png')
densityplot(~resid,col='black',main='Residual Density Plot', xlab='values of Residuals')
dev.off()
bitmap(file='test7.png')
qqnorm(resid, main='Residual Normal Q-Q Plot')
qqline(resid)
dev.off()
ncols <- length(selection[[1]][1,])
nrows <- length(selection[[2]][,1])-1
load(file='createtable')
a<-table.start()
a<-table.row.start(a)
a<-table.element(a,'ARIMA Parameter Estimation and Backward Selection', ncols+1,TRUE)
a<-table.row.end(a)
a<-table.row.start(a)
a<-table.element(a,'Iteration', header=TRUE)
for (i in 1:ncols) {
a<-table.element(a,names(selection[[3]][[1]]$coef)[i],header=TRUE)
}
a<-table.row.end(a)
for (j in 1:nrows) {
a<-table.row.start(a)
mydum <- 'Estimates ('
mydum <- paste(mydum,j)
mydum <- paste(mydum,')')
a<-table.element(a,mydum, header=TRUE)
for (i in 1:ncols) {
a<-table.element(a,round(selection[[1]][j,i],4))
}
a<-table.row.end(a)
a<-table.row.start(a)
a<-table.element(a,'(p-val)', header=TRUE)
for (i in 1:ncols) {
mydum <- '('
mydum <- paste(mydum,round(selection[[2]][j,i],4),sep='')
mydum <- paste(mydum,')')
a<-table.element(a,mydum)
}
a<-table.row.end(a)
}
a<-table.end(a)
table.save(a,file='mytable.tab')
a<-table.start()
a<-table.row.start(a)
a<-table.element(a,'Estimated ARIMA Residuals', 1,TRUE)
a<-table.row.end(a)
a<-table.row.start(a)
a<-table.element(a,'Value', 1,TRUE)
a<-table.row.end(a)
for (i in (par4*par5+par3):length(resid)) {
a<-table.row.start(a)
a<-table.element(a,resid[i])
a<-table.row.end(a)
}
a<-table.end(a)
table.save(a,file='mytable1.tab')