Free Statistics

of Irreproducible Research!

Author's title

Author*The author of this computation has been verified*
R Software Modulerwasp_arimabackwardselection.wasp
Title produced by softwareARIMA Backward Selection
Date of computationFri, 23 Dec 2016 00:40:44 +0100
Cite this page as followsStatistical Computations at FreeStatistics.org, Office for Research Development and Education, URL https://freestatistics.org/blog/index.php?v=date/2016/Dec/23/t1482450085b3zr8t3tslubjlr.htm/, Retrieved Tue, 07 May 2024 06:08:18 +0000
Statistical Computations at FreeStatistics.org, Office for Research Development and Education, URL https://freestatistics.org/blog/index.php?pk=302735, Retrieved Tue, 07 May 2024 06:08:18 +0000
QR Codes:

Original text written by user:
IsPrivate?No (this computation is public)
User-defined keywords
Estimated Impact119
Family? (F = Feedback message, R = changed R code, M = changed R Module, P = changed Parameters, D = changed Data)
-       [ARIMA Backward Selection] [Prima Backward] [2016-12-22 23:40:44] [36884fbde1107444791dd71ee0072a5a] [Current]
Feedback Forum

Post a new message
Dataseries X:
3647
1885
4791
3178
2849
4716
3085
2799
3573
2721
3355
5667
2856
1944
4188
2949
3567
4137
3494
2489
3244
2669
2529
3377
3366
2073
4133
4213
3710
5123
3141
3084
3804
3203
2757
2243
5229
2857
3395
4882
7140
8945
6866
4205
3217
3079
2263
4187
2665
2073
3540
3686
2384
4500
1679
868
1869
3710
6904
3415
938
3359
3551
2278
3033
2280
2901
4812
4882
7896
5048
3741
4418
3471
5055
7595
8124
2333
3008
2744
2833
2428
4269
3207
5170
7767
4544
3741
2193
3432
5282
6635
4222
7317
4132
5048
4383
3761
4081
6491
5859
7139
7682
8649
6146
7137
9948
15819
8370
13222
16711
19059
8303
20781
9638
13444
6072
13442
14457
17705
16463
19194
20688
14739
12702
15760


Summary of computational transaction
Raw Input view raw input (R code)
Raw Outputview raw output of R engine
Computing time3 seconds
R ServerBig Analytics Cloud Computing Center

\begin{tabular}{lllllllll}
\hline
Summary of computational transaction \tabularnewline
Raw Input view raw input (R code)  \tabularnewline
Raw Outputview raw output of R engine  \tabularnewline
Computing time3 seconds \tabularnewline
R ServerBig Analytics Cloud Computing Center \tabularnewline
\hline
\end{tabular}
%Source: https://freestatistics.org/blog/index.php?pk=302735&T=0

[TABLE]
[ROW]
Summary of computational transaction[/C][/ROW] [ROW]Raw Input[/C] view raw input (R code) [/C][/ROW] [ROW]Raw Output[/C]view raw output of R engine [/C][/ROW] [ROW]Computing time[/C]3 seconds[/C][/ROW] [ROW]R Server[/C]Big Analytics Cloud Computing Center[/C][/ROW] [/TABLE] Source: https://freestatistics.org/blog/index.php?pk=302735&T=0

Globally Unique Identifier (entire table): ba.freestatistics.org/blog/index.php?pk=302735&T=0

As an alternative you can also use a QR Code:  

The GUIDs for individual cells are displayed in the table below:

Summary of computational transaction
Raw Input view raw input (R code)
Raw Outputview raw output of R engine
Computing time3 seconds
R ServerBig Analytics Cloud Computing Center


ARIMA Parameter Estimation and Backward Selection
Iterationar1ar2ar3ma1
Estimates ( 1 )0.05970.1466-0.1404-0.6982
(p-val)(0.7022 )(0.2528 )(0.1706 )(0 )
Estimates ( 2 )00.1159-0.1535-0.651
(p-val)(NA )(0.2647 )(0.109 )(0 )
Estimates ( 3 )00-0.1761-0.604
(p-val)(NA )(NA )(0.0614 )(0 )
Estimates ( 4 )000-0.6536
(p-val)(NA )(NA )(NA )(0 )
Estimates ( 5 )NANANANA
(p-val)(NA )(NA )(NA )(NA )
Estimates ( 6 )NANANANA
(p-val)(NA )(NA )(NA )(NA )
Estimates ( 7 )NANANANA
(p-val)(NA )(NA )(NA )(NA )

\begin{tabular}{lllllllll}
\hline
ARIMA Parameter Estimation and Backward Selection \tabularnewline
Iteration & ar1 & ar2 & ar3 & ma1 \tabularnewline
Estimates ( 1 ) & 0.0597 & 0.1466 & -0.1404 & -0.6982 \tabularnewline
(p-val) & (0.7022 ) & (0.2528 ) & (0.1706 ) & (0 ) \tabularnewline
Estimates ( 2 ) & 0 & 0.1159 & -0.1535 & -0.651 \tabularnewline
(p-val) & (NA ) & (0.2647 ) & (0.109 ) & (0 ) \tabularnewline
Estimates ( 3 ) & 0 & 0 & -0.1761 & -0.604 \tabularnewline
(p-val) & (NA ) & (NA ) & (0.0614 ) & (0 ) \tabularnewline
Estimates ( 4 ) & 0 & 0 & 0 & -0.6536 \tabularnewline
(p-val) & (NA ) & (NA ) & (NA ) & (0 ) \tabularnewline
Estimates ( 5 ) & NA & NA & NA & NA \tabularnewline
(p-val) & (NA ) & (NA ) & (NA ) & (NA ) \tabularnewline
Estimates ( 6 ) & NA & NA & NA & NA \tabularnewline
(p-val) & (NA ) & (NA ) & (NA ) & (NA ) \tabularnewline
Estimates ( 7 ) & NA & NA & NA & NA \tabularnewline
(p-val) & (NA ) & (NA ) & (NA ) & (NA ) \tabularnewline
\hline
\end{tabular}
%Source: https://freestatistics.org/blog/index.php?pk=302735&T=1

[TABLE]
[ROW][C]ARIMA Parameter Estimation and Backward Selection[/C][/ROW]
[ROW][C]Iteration[/C][C]ar1[/C][C]ar2[/C][C]ar3[/C][C]ma1[/C][/ROW]
[ROW][C]Estimates ( 1 )[/C][C]0.0597[/C][C]0.1466[/C][C]-0.1404[/C][C]-0.6982[/C][/ROW]
[ROW][C](p-val)[/C][C](0.7022 )[/C][C](0.2528 )[/C][C](0.1706 )[/C][C](0 )[/C][/ROW]
[ROW][C]Estimates ( 2 )[/C][C]0[/C][C]0.1159[/C][C]-0.1535[/C][C]-0.651[/C][/ROW]
[ROW][C](p-val)[/C][C](NA )[/C][C](0.2647 )[/C][C](0.109 )[/C][C](0 )[/C][/ROW]
[ROW][C]Estimates ( 3 )[/C][C]0[/C][C]0[/C][C]-0.1761[/C][C]-0.604[/C][/ROW]
[ROW][C](p-val)[/C][C](NA )[/C][C](NA )[/C][C](0.0614 )[/C][C](0 )[/C][/ROW]
[ROW][C]Estimates ( 4 )[/C][C]0[/C][C]0[/C][C]0[/C][C]-0.6536[/C][/ROW]
[ROW][C](p-val)[/C][C](NA )[/C][C](NA )[/C][C](NA )[/C][C](0 )[/C][/ROW]
[ROW][C]Estimates ( 5 )[/C][C]NA[/C][C]NA[/C][C]NA[/C][C]NA[/C][/ROW]
[ROW][C](p-val)[/C][C](NA )[/C][C](NA )[/C][C](NA )[/C][C](NA )[/C][/ROW]
[ROW][C]Estimates ( 6 )[/C][C]NA[/C][C]NA[/C][C]NA[/C][C]NA[/C][/ROW]
[ROW][C](p-val)[/C][C](NA )[/C][C](NA )[/C][C](NA )[/C][C](NA )[/C][/ROW]
[ROW][C]Estimates ( 7 )[/C][C]NA[/C][C]NA[/C][C]NA[/C][C]NA[/C][/ROW]
[ROW][C](p-val)[/C][C](NA )[/C][C](NA )[/C][C](NA )[/C][C](NA )[/C][/ROW]
[/TABLE]
Source: https://freestatistics.org/blog/index.php?pk=302735&T=1

Globally Unique Identifier (entire table): ba.freestatistics.org/blog/index.php?pk=302735&T=1

As an alternative you can also use a QR Code:  

The GUIDs for individual cells are displayed in the table below:

ARIMA Parameter Estimation and Backward Selection
Iterationar1ar2ar3ma1
Estimates ( 1 )0.05970.1466-0.1404-0.6982
(p-val)(0.7022 )(0.2528 )(0.1706 )(0 )
Estimates ( 2 )00.1159-0.1535-0.651
(p-val)(NA )(0.2647 )(0.109 )(0 )
Estimates ( 3 )00-0.1761-0.604
(p-val)(NA )(NA )(0.0614 )(0 )
Estimates ( 4 )000-0.6536
(p-val)(NA )(NA )(NA )(0 )
Estimates ( 5 )NANANANA
(p-val)(NA )(NA )(NA )(NA )
Estimates ( 6 )NANANANA
(p-val)(NA )(NA )(NA )(NA )
Estimates ( 7 )NANANANA
(p-val)(NA )(NA )(NA )(NA )


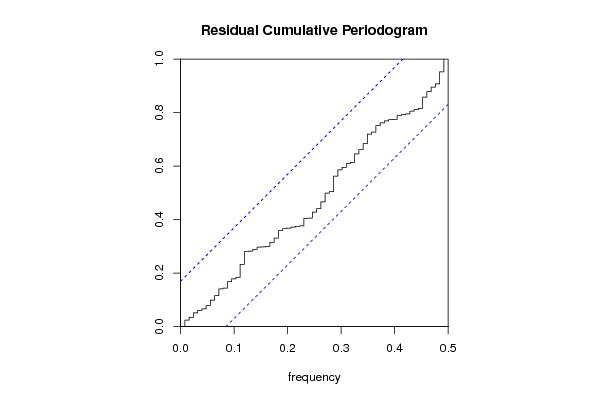
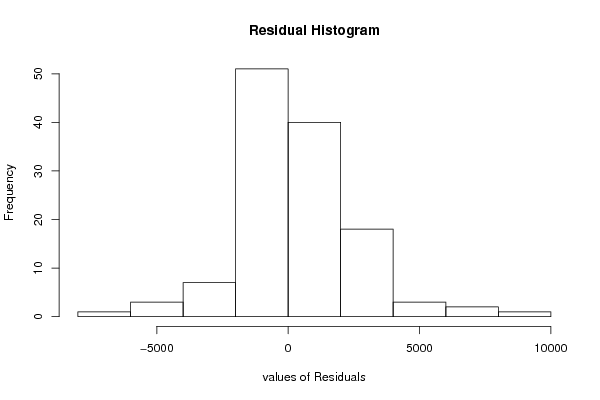
Estimated ARIMA Residuals
Value
3.64699743165516
-1484.67498475619
1997.87414795554
-376.878321300404
-840.670082486035
1868.14089673695
-791.969370906831
-820.519763285021
607.438331124589
-772.374569976307
117.182264603839
2519.04221590701
-1439.60938507432
-1669.83411984048
1642.61383215521
-741.930884759918
9.28119246692039
970.787346274634
-274.860599741592
-1062.17641127529
213.848678771504
-559.076118619174
-654.65642747335
585.56158316276
241.405686642847
-1171.85098849757
1501.56504248489
984.975831671849
-135.800764047642
1693.75750420981
-944.918413269222
-716.291692805205
536.212919660064
-626.18090873495
-834.237842756073
-891.065438171221
2341.97596358316
-1036.04012941154
-178.264415326884
1905.18447649036
2990.96715586331
3706.22484459856
421.349649464417
-2008.86664960041
-1883.44102940673
-1641.6821400498
-2276.15862915055
375.25645980304
-1319.65578786082
-1532.74616957785
880.082109755468
409.517422201182
-1158.91500206828
1674.38767972389
-1783.994378411
-2117.78418245492
94.5440715534521
1401.30771696506
3897.53780737959
-958.688923869042
-2731.81645134633
1333.52399295803
382.986176462365
-1477.89900924068
288.73326958745
-544.798972554659
67.7702682871059
2084.89177280795
1196.62202257651
3846.09576181307
-188.50240378415
-1408.52398235265
357.065119084689
-1232.89007589314
609.190435985591
3027.16164811478
2190.56821213529
-4188.99208832251
-1407.75204535761
-1021.09191948437
-1547.54708673717
-1220.81365053653
1057.1628372612
-407.82294972356
1645.36080040878
3914.97358646937
-1045.46465158984
-1088.74219970489
-1748.22973938628
-384.48262879647
1476.36768647079
1972.08233387763
-1003.70941145319
2814.57709574155
-1246.78461403505
-261.974740816168
-278.179212114239
-1350.91169536513
-334.608569848304
2090.7931659506
521.256215855939
1651.18144786948
1964.69341475466
2042.33361824935
-1044.05880260499
456.036461757361
3256.73066488138
7397.20211223511
-2806.72799749282
3651.83045321292
6728.54506711838
5100.08335457536
-6821.19328004412
8972.57957710643
-5310.25811792115
-1295.47725349665
-5956.9904294538
1809.75733671759
2778.31374014271
3627.78873379092
2247.00719626805
4266.89156208745
4643.10285879188
-3363.38929828308
-3587.46947796711
1154.34785870277

\begin{tabular}{lllllllll}
\hline
Estimated ARIMA Residuals \tabularnewline
Value \tabularnewline
3.64699743165516 \tabularnewline
-1484.67498475619 \tabularnewline
1997.87414795554 \tabularnewline
-376.878321300404 \tabularnewline
-840.670082486035 \tabularnewline
1868.14089673695 \tabularnewline
-791.969370906831 \tabularnewline
-820.519763285021 \tabularnewline
607.438331124589 \tabularnewline
-772.374569976307 \tabularnewline
117.182264603839 \tabularnewline
2519.04221590701 \tabularnewline
-1439.60938507432 \tabularnewline
-1669.83411984048 \tabularnewline
1642.61383215521 \tabularnewline
-741.930884759918 \tabularnewline
9.28119246692039 \tabularnewline
970.787346274634 \tabularnewline
-274.860599741592 \tabularnewline
-1062.17641127529 \tabularnewline
213.848678771504 \tabularnewline
-559.076118619174 \tabularnewline
-654.65642747335 \tabularnewline
585.56158316276 \tabularnewline
241.405686642847 \tabularnewline
-1171.85098849757 \tabularnewline
1501.56504248489 \tabularnewline
984.975831671849 \tabularnewline
-135.800764047642 \tabularnewline
1693.75750420981 \tabularnewline
-944.918413269222 \tabularnewline
-716.291692805205 \tabularnewline
536.212919660064 \tabularnewline
-626.18090873495 \tabularnewline
-834.237842756073 \tabularnewline
-891.065438171221 \tabularnewline
2341.97596358316 \tabularnewline
-1036.04012941154 \tabularnewline
-178.264415326884 \tabularnewline
1905.18447649036 \tabularnewline
2990.96715586331 \tabularnewline
3706.22484459856 \tabularnewline
421.349649464417 \tabularnewline
-2008.86664960041 \tabularnewline
-1883.44102940673 \tabularnewline
-1641.6821400498 \tabularnewline
-2276.15862915055 \tabularnewline
375.25645980304 \tabularnewline
-1319.65578786082 \tabularnewline
-1532.74616957785 \tabularnewline
880.082109755468 \tabularnewline
409.517422201182 \tabularnewline
-1158.91500206828 \tabularnewline
1674.38767972389 \tabularnewline
-1783.994378411 \tabularnewline
-2117.78418245492 \tabularnewline
94.5440715534521 \tabularnewline
1401.30771696506 \tabularnewline
3897.53780737959 \tabularnewline
-958.688923869042 \tabularnewline
-2731.81645134633 \tabularnewline
1333.52399295803 \tabularnewline
382.986176462365 \tabularnewline
-1477.89900924068 \tabularnewline
288.73326958745 \tabularnewline
-544.798972554659 \tabularnewline
67.7702682871059 \tabularnewline
2084.89177280795 \tabularnewline
1196.62202257651 \tabularnewline
3846.09576181307 \tabularnewline
-188.50240378415 \tabularnewline
-1408.52398235265 \tabularnewline
357.065119084689 \tabularnewline
-1232.89007589314 \tabularnewline
609.190435985591 \tabularnewline
3027.16164811478 \tabularnewline
2190.56821213529 \tabularnewline
-4188.99208832251 \tabularnewline
-1407.75204535761 \tabularnewline
-1021.09191948437 \tabularnewline
-1547.54708673717 \tabularnewline
-1220.81365053653 \tabularnewline
1057.1628372612 \tabularnewline
-407.82294972356 \tabularnewline
1645.36080040878 \tabularnewline
3914.97358646937 \tabularnewline
-1045.46465158984 \tabularnewline
-1088.74219970489 \tabularnewline
-1748.22973938628 \tabularnewline
-384.48262879647 \tabularnewline
1476.36768647079 \tabularnewline
1972.08233387763 \tabularnewline
-1003.70941145319 \tabularnewline
2814.57709574155 \tabularnewline
-1246.78461403505 \tabularnewline
-261.974740816168 \tabularnewline
-278.179212114239 \tabularnewline
-1350.91169536513 \tabularnewline
-334.608569848304 \tabularnewline
2090.7931659506 \tabularnewline
521.256215855939 \tabularnewline
1651.18144786948 \tabularnewline
1964.69341475466 \tabularnewline
2042.33361824935 \tabularnewline
-1044.05880260499 \tabularnewline
456.036461757361 \tabularnewline
3256.73066488138 \tabularnewline
7397.20211223511 \tabularnewline
-2806.72799749282 \tabularnewline
3651.83045321292 \tabularnewline
6728.54506711838 \tabularnewline
5100.08335457536 \tabularnewline
-6821.19328004412 \tabularnewline
8972.57957710643 \tabularnewline
-5310.25811792115 \tabularnewline
-1295.47725349665 \tabularnewline
-5956.9904294538 \tabularnewline
1809.75733671759 \tabularnewline
2778.31374014271 \tabularnewline
3627.78873379092 \tabularnewline
2247.00719626805 \tabularnewline
4266.89156208745 \tabularnewline
4643.10285879188 \tabularnewline
-3363.38929828308 \tabularnewline
-3587.46947796711 \tabularnewline
1154.34785870277 \tabularnewline
\hline
\end{tabular}
%Source: https://freestatistics.org/blog/index.php?pk=302735&T=2

[TABLE]
[ROW][C]Estimated ARIMA Residuals[/C][/ROW]
[ROW][C]Value[/C][/ROW]
[ROW][C]3.64699743165516[/C][/ROW]
[ROW][C]-1484.67498475619[/C][/ROW]
[ROW][C]1997.87414795554[/C][/ROW]
[ROW][C]-376.878321300404[/C][/ROW]
[ROW][C]-840.670082486035[/C][/ROW]
[ROW][C]1868.14089673695[/C][/ROW]
[ROW][C]-791.969370906831[/C][/ROW]
[ROW][C]-820.519763285021[/C][/ROW]
[ROW][C]607.438331124589[/C][/ROW]
[ROW][C]-772.374569976307[/C][/ROW]
[ROW][C]117.182264603839[/C][/ROW]
[ROW][C]2519.04221590701[/C][/ROW]
[ROW][C]-1439.60938507432[/C][/ROW]
[ROW][C]-1669.83411984048[/C][/ROW]
[ROW][C]1642.61383215521[/C][/ROW]
[ROW][C]-741.930884759918[/C][/ROW]
[ROW][C]9.28119246692039[/C][/ROW]
[ROW][C]970.787346274634[/C][/ROW]
[ROW][C]-274.860599741592[/C][/ROW]
[ROW][C]-1062.17641127529[/C][/ROW]
[ROW][C]213.848678771504[/C][/ROW]
[ROW][C]-559.076118619174[/C][/ROW]
[ROW][C]-654.65642747335[/C][/ROW]
[ROW][C]585.56158316276[/C][/ROW]
[ROW][C]241.405686642847[/C][/ROW]
[ROW][C]-1171.85098849757[/C][/ROW]
[ROW][C]1501.56504248489[/C][/ROW]
[ROW][C]984.975831671849[/C][/ROW]
[ROW][C]-135.800764047642[/C][/ROW]
[ROW][C]1693.75750420981[/C][/ROW]
[ROW][C]-944.918413269222[/C][/ROW]
[ROW][C]-716.291692805205[/C][/ROW]
[ROW][C]536.212919660064[/C][/ROW]
[ROW][C]-626.18090873495[/C][/ROW]
[ROW][C]-834.237842756073[/C][/ROW]
[ROW][C]-891.065438171221[/C][/ROW]
[ROW][C]2341.97596358316[/C][/ROW]
[ROW][C]-1036.04012941154[/C][/ROW]
[ROW][C]-178.264415326884[/C][/ROW]
[ROW][C]1905.18447649036[/C][/ROW]
[ROW][C]2990.96715586331[/C][/ROW]
[ROW][C]3706.22484459856[/C][/ROW]
[ROW][C]421.349649464417[/C][/ROW]
[ROW][C]-2008.86664960041[/C][/ROW]
[ROW][C]-1883.44102940673[/C][/ROW]
[ROW][C]-1641.6821400498[/C][/ROW]
[ROW][C]-2276.15862915055[/C][/ROW]
[ROW][C]375.25645980304[/C][/ROW]
[ROW][C]-1319.65578786082[/C][/ROW]
[ROW][C]-1532.74616957785[/C][/ROW]
[ROW][C]880.082109755468[/C][/ROW]
[ROW][C]409.517422201182[/C][/ROW]
[ROW][C]-1158.91500206828[/C][/ROW]
[ROW][C]1674.38767972389[/C][/ROW]
[ROW][C]-1783.994378411[/C][/ROW]
[ROW][C]-2117.78418245492[/C][/ROW]
[ROW][C]94.5440715534521[/C][/ROW]
[ROW][C]1401.30771696506[/C][/ROW]
[ROW][C]3897.53780737959[/C][/ROW]
[ROW][C]-958.688923869042[/C][/ROW]
[ROW][C]-2731.81645134633[/C][/ROW]
[ROW][C]1333.52399295803[/C][/ROW]
[ROW][C]382.986176462365[/C][/ROW]
[ROW][C]-1477.89900924068[/C][/ROW]
[ROW][C]288.73326958745[/C][/ROW]
[ROW][C]-544.798972554659[/C][/ROW]
[ROW][C]67.7702682871059[/C][/ROW]
[ROW][C]2084.89177280795[/C][/ROW]
[ROW][C]1196.62202257651[/C][/ROW]
[ROW][C]3846.09576181307[/C][/ROW]
[ROW][C]-188.50240378415[/C][/ROW]
[ROW][C]-1408.52398235265[/C][/ROW]
[ROW][C]357.065119084689[/C][/ROW]
[ROW][C]-1232.89007589314[/C][/ROW]
[ROW][C]609.190435985591[/C][/ROW]
[ROW][C]3027.16164811478[/C][/ROW]
[ROW][C]2190.56821213529[/C][/ROW]
[ROW][C]-4188.99208832251[/C][/ROW]
[ROW][C]-1407.75204535761[/C][/ROW]
[ROW][C]-1021.09191948437[/C][/ROW]
[ROW][C]-1547.54708673717[/C][/ROW]
[ROW][C]-1220.81365053653[/C][/ROW]
[ROW][C]1057.1628372612[/C][/ROW]
[ROW][C]-407.82294972356[/C][/ROW]
[ROW][C]1645.36080040878[/C][/ROW]
[ROW][C]3914.97358646937[/C][/ROW]
[ROW][C]-1045.46465158984[/C][/ROW]
[ROW][C]-1088.74219970489[/C][/ROW]
[ROW][C]-1748.22973938628[/C][/ROW]
[ROW][C]-384.48262879647[/C][/ROW]
[ROW][C]1476.36768647079[/C][/ROW]
[ROW][C]1972.08233387763[/C][/ROW]
[ROW][C]-1003.70941145319[/C][/ROW]
[ROW][C]2814.57709574155[/C][/ROW]
[ROW][C]-1246.78461403505[/C][/ROW]
[ROW][C]-261.974740816168[/C][/ROW]
[ROW][C]-278.179212114239[/C][/ROW]
[ROW][C]-1350.91169536513[/C][/ROW]
[ROW][C]-334.608569848304[/C][/ROW]
[ROW][C]2090.7931659506[/C][/ROW]
[ROW][C]521.256215855939[/C][/ROW]
[ROW][C]1651.18144786948[/C][/ROW]
[ROW][C]1964.69341475466[/C][/ROW]
[ROW][C]2042.33361824935[/C][/ROW]
[ROW][C]-1044.05880260499[/C][/ROW]
[ROW][C]456.036461757361[/C][/ROW]
[ROW][C]3256.73066488138[/C][/ROW]
[ROW][C]7397.20211223511[/C][/ROW]
[ROW][C]-2806.72799749282[/C][/ROW]
[ROW][C]3651.83045321292[/C][/ROW]
[ROW][C]6728.54506711838[/C][/ROW]
[ROW][C]5100.08335457536[/C][/ROW]
[ROW][C]-6821.19328004412[/C][/ROW]
[ROW][C]8972.57957710643[/C][/ROW]
[ROW][C]-5310.25811792115[/C][/ROW]
[ROW][C]-1295.47725349665[/C][/ROW]
[ROW][C]-5956.9904294538[/C][/ROW]
[ROW][C]1809.75733671759[/C][/ROW]
[ROW][C]2778.31374014271[/C][/ROW]
[ROW][C]3627.78873379092[/C][/ROW]
[ROW][C]2247.00719626805[/C][/ROW]
[ROW][C]4266.89156208745[/C][/ROW]
[ROW][C]4643.10285879188[/C][/ROW]
[ROW][C]-3363.38929828308[/C][/ROW]
[ROW][C]-3587.46947796711[/C][/ROW]
[ROW][C]1154.34785870277[/C][/ROW]
[/TABLE]
Source: https://freestatistics.org/blog/index.php?pk=302735&T=2

Globally Unique Identifier (entire table): ba.freestatistics.org/blog/index.php?pk=302735&T=2

As an alternative you can also use a QR Code:  

The GUIDs for individual cells are displayed in the table below:

Estimated ARIMA Residuals
Value
3.64699743165516
-1484.67498475619
1997.87414795554
-376.878321300404
-840.670082486035
1868.14089673695
-791.969370906831
-820.519763285021
607.438331124589
-772.374569976307
117.182264603839
2519.04221590701
-1439.60938507432
-1669.83411984048
1642.61383215521
-741.930884759918
9.28119246692039
970.787346274634
-274.860599741592
-1062.17641127529
213.848678771504
-559.076118619174
-654.65642747335
585.56158316276
241.405686642847
-1171.85098849757
1501.56504248489
984.975831671849
-135.800764047642
1693.75750420981
-944.918413269222
-716.291692805205
536.212919660064
-626.18090873495
-834.237842756073
-891.065438171221
2341.97596358316
-1036.04012941154
-178.264415326884
1905.18447649036
2990.96715586331
3706.22484459856
421.349649464417
-2008.86664960041
-1883.44102940673
-1641.6821400498
-2276.15862915055
375.25645980304
-1319.65578786082
-1532.74616957785
880.082109755468
409.517422201182
-1158.91500206828
1674.38767972389
-1783.994378411
-2117.78418245492
94.5440715534521
1401.30771696506
3897.53780737959
-958.688923869042
-2731.81645134633
1333.52399295803
382.986176462365
-1477.89900924068
288.73326958745
-544.798972554659
67.7702682871059
2084.89177280795
1196.62202257651
3846.09576181307
-188.50240378415
-1408.52398235265
357.065119084689
-1232.89007589314
609.190435985591
3027.16164811478
2190.56821213529
-4188.99208832251
-1407.75204535761
-1021.09191948437
-1547.54708673717
-1220.81365053653
1057.1628372612
-407.82294972356
1645.36080040878
3914.97358646937
-1045.46465158984
-1088.74219970489
-1748.22973938628
-384.48262879647
1476.36768647079
1972.08233387763
-1003.70941145319
2814.57709574155
-1246.78461403505
-261.974740816168
-278.179212114239
-1350.91169536513
-334.608569848304
2090.7931659506
521.256215855939
1651.18144786948
1964.69341475466
2042.33361824935
-1044.05880260499
456.036461757361
3256.73066488138
7397.20211223511
-2806.72799749282
3651.83045321292
6728.54506711838
5100.08335457536
-6821.19328004412
8972.57957710643
-5310.25811792115
-1295.47725349665
-5956.9904294538
1809.75733671759
2778.31374014271
3627.78873379092
2247.00719626805
4266.89156208745
4643.10285879188
-3363.38929828308
-3587.46947796711
1154.34785870277


Parameters (Session):
par1 = FALSE ; par2 = 1 ; par3 = 1 ; par4 = 0 ; par5 = 12 ; par6 = 3 ; par7 = 1 ; par8 = 0 ; par9 = 0 ;
Parameters (R input):
par1 = FALSE ; par2 = 1 ; par3 = 1 ; par4 = 0 ; par5 = 12 ; par6 = 3 ; par7 = 1 ; par8 = 0 ; par9 = 0 ;
R code (references can be found in the software module):
library(lattice)
if (par1 == 'TRUE') par1 <- TRUE
if (par1 == 'FALSE') par1 <- FALSE
par2 <- as.numeric(par2) #Box-Cox lambda transformation parameter
par3 <- as.numeric(par3) #degree of non-seasonal differencing
par4 <- as.numeric(par4) #degree of seasonal differencing
par5 <- as.numeric(par5) #seasonal period
par6 <- as.numeric(par6) #degree (p) of the non-seasonal AR(p) polynomial
par7 <- as.numeric(par7) #degree (q) of the non-seasonal MA(q) polynomial
par8 <- as.numeric(par8) #degree (P) of the seasonal AR(P) polynomial
par9 <- as.numeric(par9) #degree (Q) of the seasonal MA(Q) polynomial
armaGR <- function(arima.out, names, n){
try1 <- arima.out$coef
try2 <- sqrt(diag(arima.out$var.coef))
try.data.frame <- data.frame(matrix(NA,ncol=4,nrow=length(names)))
dimnames(try.data.frame) <- list(names,c('coef','std','tstat','pv'))
try.data.frame[,1] <- try1
for(i in 1:length(try2)) try.data.frame[which(rownames(try.data.frame)==names(try2)[i]),2] <- try2[i]
try.data.frame[,3] <- try.data.frame[,1] / try.data.frame[,2]
try.data.frame[,4] <- round((1-pt(abs(try.data.frame[,3]),df=n-(length(try2)+1)))*2,5)
vector <- rep(NA,length(names))
vector[is.na(try.data.frame[,4])] <- 0
maxi <- which.max(try.data.frame[,4])
continue <- max(try.data.frame[,4],na.rm=TRUE) > .05
vector[maxi] <- 0
list(summary=try.data.frame,next.vector=vector,continue=continue)
}
arimaSelect <- function(series, order=c(13,0,0), seasonal=list(order=c(2,0,0),period=12), include.mean=F){
nrc <- order[1]+order[3]+seasonal$order[1]+seasonal$order[3]
coeff <- matrix(NA, nrow=nrc*2, ncol=nrc)
pval <- matrix(NA, nrow=nrc*2, ncol=nrc)
mylist <- rep(list(NULL), nrc)
names <- NULL
if(order[1] > 0) names <- paste('ar',1:order[1],sep='')
if(order[3] > 0) names <- c( names , paste('ma',1:order[3],sep='') )
if(seasonal$order[1] > 0) names <- c(names, paste('sar',1:seasonal$order[1],sep=''))
if(seasonal$order[3] > 0) names <- c(names, paste('sma',1:seasonal$order[3],sep=''))
arima.out <- arima(series, order=order, seasonal=seasonal, include.mean=include.mean, method='ML')
mylist[[1]] <- arima.out
last.arma <- armaGR(arima.out, names, length(series))
mystop <- FALSE
i <- 1
coeff[i,] <- last.arma[[1]][,1]
pval [i,] <- last.arma[[1]][,4]
i <- 2
aic <- arima.out$aic
while(!mystop){
mylist[[i]] <- arima.out
arima.out <- arima(series, order=order, seasonal=seasonal, include.mean=include.mean, method='ML', fixed=last.arma$next.vector)
aic <- c(aic, arima.out$aic)
last.arma <- armaGR(arima.out, names, length(series))
mystop <- !last.arma$continue
coeff[i,] <- last.arma[[1]][,1]
pval [i,] <- last.arma[[1]][,4]
i <- i+1
}
list(coeff, pval, mylist, aic=aic)
}
arimaSelectplot <- function(arimaSelect.out,noms,choix){
noms <- names(arimaSelect.out[[3]][[1]]$coef)
coeff <- arimaSelect.out[[1]]
k <- min(which(is.na(coeff[,1])))-1
coeff <- coeff[1:k,]
pval <- arimaSelect.out[[2]][1:k,]
aic <- arimaSelect.out$aic[1:k]
coeff[coeff==0] <- NA
n <- ncol(coeff)
if(missing(choix)) choix <- k
layout(matrix(c(1,1,1,2,
3,3,3,2,
3,3,3,4,
5,6,7,7),nr=4),
widths=c(10,35,45,15),
heights=c(30,30,15,15))
couleurs <- rainbow(75)[1:50]#(50)
ticks <- pretty(coeff)
par(mar=c(1,1,3,1))
plot(aic,k:1-.5,type='o',pch=21,bg='blue',cex=2,axes=F,lty=2,xpd=NA)
points(aic[choix],k-choix+.5,pch=21,cex=4,bg=2,xpd=NA)
title('aic',line=2)
par(mar=c(3,0,0,0))
plot(0,axes=F,xlab='',ylab='',xlim=range(ticks),ylim=c(.1,1))
rect(xleft = min(ticks) + (0:49)/50*(max(ticks)-min(ticks)),
xright = min(ticks) + (1:50)/50*(max(ticks)-min(ticks)),
ytop = rep(1,50),
ybottom= rep(0,50),col=couleurs,border=NA)
axis(1,ticks)
rect(xleft=min(ticks),xright=max(ticks),ytop=1,ybottom=0)
text(mean(coeff,na.rm=T),.5,'coefficients',cex=2,font=2)
par(mar=c(1,1,3,1))
image(1:n,1:k,t(coeff[k:1,]),axes=F,col=couleurs,zlim=range(ticks))
for(i in 1:n) for(j in 1:k) if(!is.na(coeff[j,i])) {
if(pval[j,i]<.01) symb = 'green'
else if( (pval[j,i]<.05) & (pval[j,i]>=.01)) symb = 'orange'
else if( (pval[j,i]<.1) & (pval[j,i]>=.05)) symb = 'red'
else symb = 'black'
polygon(c(i+.5 ,i+.2 ,i+.5 ,i+.5),
c(k-j+0.5,k-j+0.5,k-j+0.8,k-j+0.5),
col=symb)
if(j==choix) {
rect(xleft=i-.5,
xright=i+.5,
ybottom=k-j+1.5,
ytop=k-j+.5,
lwd=4)
text(i,
k-j+1,
round(coeff[j,i],2),
cex=1.2,
font=2)
}
else{
rect(xleft=i-.5,xright=i+.5,ybottom=k-j+1.5,ytop=k-j+.5)
text(i,k-j+1,round(coeff[j,i],2),cex=1.2,font=1)
}
}
axis(3,1:n,noms)
par(mar=c(0.5,0,0,0.5))
plot(0,axes=F,xlab='',ylab='',type='n',xlim=c(0,8),ylim=c(-.2,.8))
cols <- c('green','orange','red','black')
niv <- c('0','0.01','0.05','0.1')
for(i in 0:3){
polygon(c(1+2*i ,1+2*i ,1+2*i-.5 ,1+2*i),
c(.4 ,.7 , .4 , .4),
col=cols[i+1])
text(2*i,0.5,niv[i+1],cex=1.5)
}
text(8,.5,1,cex=1.5)
text(4,0,'p-value',cex=2)
box()
residus <- arimaSelect.out[[3]][[choix]]$res
par(mar=c(1,2,4,1))
acf(residus,main='')
title('acf',line=.5)
par(mar=c(1,2,4,1))
pacf(residus,main='')
title('pacf',line=.5)
par(mar=c(2,2,4,1))
qqnorm(residus,main='')
title('qq-norm',line=.5)
qqline(residus)
residus
}
if (par2 == 0) x <- log(x)
if (par2 != 0) x <- x^par2
(selection <- arimaSelect(x, order=c(par6,par3,par7), seasonal=list(order=c(par8,par4,par9), period=par5)))
bitmap(file='test1.png')
resid <- arimaSelectplot(selection)
dev.off()
resid
bitmap(file='test2.png')
acf(resid,length(resid)/2, main='Residual Autocorrelation Function')
dev.off()
bitmap(file='test3.png')
pacf(resid,length(resid)/2, main='Residual Partial Autocorrelation Function')
dev.off()
bitmap(file='test4.png')
cpgram(resid, main='Residual Cumulative Periodogram')
dev.off()
bitmap(file='test5.png')
hist(resid, main='Residual Histogram', xlab='values of Residuals')
dev.off()
bitmap(file='test6.png')
densityplot(~resid,col='black',main='Residual Density Plot', xlab='values of Residuals')
dev.off()
bitmap(file='test7.png')
qqnorm(resid, main='Residual Normal Q-Q Plot')
qqline(resid)
dev.off()
ncols <- length(selection[[1]][1,])
nrows <- length(selection[[2]][,1])-1
load(file='createtable')
a<-table.start()
a<-table.row.start(a)
a<-table.element(a,'ARIMA Parameter Estimation and Backward Selection', ncols+1,TRUE)
a<-table.row.end(a)
a<-table.row.start(a)
a<-table.element(a,'Iteration', header=TRUE)
for (i in 1:ncols) {
a<-table.element(a,names(selection[[3]][[1]]$coef)[i],header=TRUE)
}
a<-table.row.end(a)
for (j in 1:nrows) {
a<-table.row.start(a)
mydum <- 'Estimates ('
mydum <- paste(mydum,j)
mydum <- paste(mydum,')')
a<-table.element(a,mydum, header=TRUE)
for (i in 1:ncols) {
a<-table.element(a,round(selection[[1]][j,i],4))
}
a<-table.row.end(a)
a<-table.row.start(a)
a<-table.element(a,'(p-val)', header=TRUE)
for (i in 1:ncols) {
mydum <- '('
mydum <- paste(mydum,round(selection[[2]][j,i],4),sep='')
mydum <- paste(mydum,')')
a<-table.element(a,mydum)
}
a<-table.row.end(a)
}
a<-table.end(a)
table.save(a,file='mytable.tab')
a<-table.start()
a<-table.row.start(a)
a<-table.element(a,'Estimated ARIMA Residuals', 1,TRUE)
a<-table.row.end(a)
a<-table.row.start(a)
a<-table.element(a,'Value', 1,TRUE)
a<-table.row.end(a)
for (i in (par4*par5+par3):length(resid)) {
a<-table.row.start(a)
a<-table.element(a,resid[i])
a<-table.row.end(a)
}
a<-table.end(a)
table.save(a,file='mytable1.tab')