Free Statistics

of Irreproducible Research!

Author's title

Author*The author of this computation has been verified*
R Software Modulerwasp_autocorrelation.wasp
Title produced by software(Partial) Autocorrelation Function
Date of computationFri, 23 Dec 2016 08:42:46 +0100
Cite this page as followsStatistical Computations at FreeStatistics.org, Office for Research Development and Education, URL https://freestatistics.org/blog/index.php?v=date/2016/Dec/23/t1482478987ixs3289vyw9drsi.htm/, Retrieved Wed, 08 May 2024 03:11:08 +0000
Statistical Computations at FreeStatistics.org, Office for Research Development and Education, URL https://freestatistics.org/blog/index.php?pk=302752, Retrieved Wed, 08 May 2024 03:11:08 +0000
QR Codes:

Original text written by user:
IsPrivate?No (this computation is public)
User-defined keywords
Estimated Impact114
Family? (F = Feedback message, R = changed R code, M = changed R Module, P = changed Parameters, D = changed Data)
-       [(Partial) Autocorrelation Function] [(Partial) Autocor...] [2016-12-23 07:42:46] [55eb8f21ed24cda91766c505eb72bb6f] [Current]
Feedback Forum

Post a new message
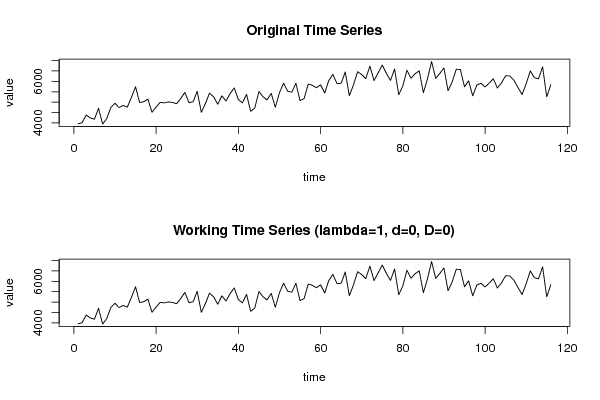
Dataseries X:
3949.9
4010.65
4381.8
4238.25
4178.1
4702.25
3944.1
4208.5
4743.45
4948.25
4735.45
4843.15
4757.75
5227.15
5739.65
4981.45
5020.05
5149.15
4513.35
4762.55
4990.45
4963.35
5010
4983.3
4924.7
5175.25
5470.3
4969.4
5020.5
5519.2
4510.75
4934.45
5430.65
5254.7
4897.8
5305.7
5055.7
5409
5683
5125.55
4965.2
5373.3
4556.1
4714.25
5513.85
5258.45
5111.4
5422.25
4753.3
5455.5
5909.15
5524.4
5477.8
5907.75
5072.55
5171
5871.4
5812.45
5692.2
5838.1
5438.2
6041.05
6335.6
5891.8
5909.65
6449.75
5312.25
5828.1
6466.15
6328.35
6131.8
6734.2
6037.25
6412.4
6785.55
6386
6045.25
6597.25
5355.9
5773.35
6539.6
6149.2
6373.45
6504.7
5451.25
6119.9
6954.95
6139.7
6383.25
6643.7
5547.75
5974
6583.6
6571.55
5736.5
6027.2
5302.65
5825.85
5910.6
5733.65
5914.3
6128.25
5680.5
5926.3
6270.5
6263
6064.55
5706.6
5365
5884.2
6504.4
6174.3
6123.65
6698.95
5256.55
5838.2


Summary of computational transaction
Raw Input view raw input (R code)
Raw Outputview raw output of R engine
Computing time1 seconds
R ServerBig Analytics Cloud Computing Center

\begin{tabular}{lllllllll}
\hline
Summary of computational transaction \tabularnewline
Raw Input view raw input (R code)  \tabularnewline
Raw Outputview raw output of R engine  \tabularnewline
Computing time1 seconds \tabularnewline
R ServerBig Analytics Cloud Computing Center \tabularnewline
\hline
\end{tabular}
%Source: https://freestatistics.org/blog/index.php?pk=302752&T=0

[TABLE]
[ROW]
Summary of computational transaction[/C][/ROW] [ROW]Raw Input[/C] view raw input (R code) [/C][/ROW] [ROW]Raw Output[/C]view raw output of R engine [/C][/ROW] [ROW]Computing time[/C]1 seconds[/C][/ROW] [ROW]R Server[/C]Big Analytics Cloud Computing Center[/C][/ROW] [/TABLE] Source: https://freestatistics.org/blog/index.php?pk=302752&T=0

Globally Unique Identifier (entire table): ba.freestatistics.org/blog/index.php?pk=302752&T=0

As an alternative you can also use a QR Code:  

The GUIDs for individual cells are displayed in the table below:

Summary of computational transaction
Raw Input view raw input (R code)
Raw Outputview raw output of R engine
Computing time1 seconds
R ServerBig Analytics Cloud Computing Center


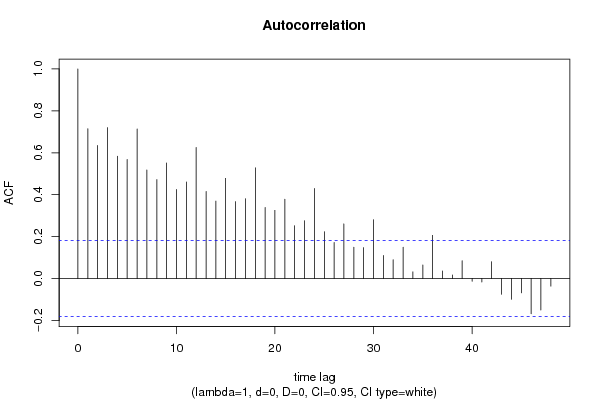
Autocorrelation Function
Time lag kACF(k)T-STATP-value
10.7148777.69950
20.6346066.83490
30.7199327.75390
40.5832516.28180
50.5677146.11450
60.7134637.68420
70.5174565.57320
80.4720835.08451e-06
90.5511945.93650
100.4251894.57946e-06
110.4605564.96031e-06
120.6255856.73780
130.4148774.46849e-06
140.3693013.97756.1e-05
150.4780035.14831e-06
160.3668053.95066.7e-05
170.38044.0973.9e-05
180.5278675.68530
190.3392683.6540.000195
200.3251683.50220.000328
210.377914.07024.3e-05
220.2517632.71160.003857
230.2753442.96550.001834
240.4297414.62845e-06
250.2233532.40560.008863
260.1722911.85560.033022
270.2605872.80660.002937
280.1495591.61080.05497
290.1474371.58790.057511
300.2805973.02210.001545
310.110021.1850.119229
320.0892340.96110.169257
330.1492761.60770.055304
340.0316680.34110.366831
350.0641610.6910.245462
360.2058712.21730.014276
370.0359490.38720.349667
380.0166030.17880.429196
390.085170.91730.180442
40-0.013221-0.14240.443508
41-0.016405-0.17670.430031
420.080080.86250.195098
43-0.075098-0.80880.210135
44-0.098931-1.06550.144426
45-0.068419-0.73690.231336
46-0.167804-1.80730.036653
47-0.15002-1.61580.054431
48-0.036354-0.39150.348056

\begin{tabular}{lllllllll}
\hline
Autocorrelation Function \tabularnewline
Time lag k & ACF(k) & T-STAT & P-value \tabularnewline
1 & 0.714877 & 7.6995 & 0 \tabularnewline
2 & 0.634606 & 6.8349 & 0 \tabularnewline
3 & 0.719932 & 7.7539 & 0 \tabularnewline
4 & 0.583251 & 6.2818 & 0 \tabularnewline
5 & 0.567714 & 6.1145 & 0 \tabularnewline
6 & 0.713463 & 7.6842 & 0 \tabularnewline
7 & 0.517456 & 5.5732 & 0 \tabularnewline
8 & 0.472083 & 5.0845 & 1e-06 \tabularnewline
9 & 0.551194 & 5.9365 & 0 \tabularnewline
10 & 0.425189 & 4.5794 & 6e-06 \tabularnewline
11 & 0.460556 & 4.9603 & 1e-06 \tabularnewline
12 & 0.625585 & 6.7378 & 0 \tabularnewline
13 & 0.414877 & 4.4684 & 9e-06 \tabularnewline
14 & 0.369301 & 3.9775 & 6.1e-05 \tabularnewline
15 & 0.478003 & 5.1483 & 1e-06 \tabularnewline
16 & 0.366805 & 3.9506 & 6.7e-05 \tabularnewline
17 & 0.3804 & 4.097 & 3.9e-05 \tabularnewline
18 & 0.527867 & 5.6853 & 0 \tabularnewline
19 & 0.339268 & 3.654 & 0.000195 \tabularnewline
20 & 0.325168 & 3.5022 & 0.000328 \tabularnewline
21 & 0.37791 & 4.0702 & 4.3e-05 \tabularnewline
22 & 0.251763 & 2.7116 & 0.003857 \tabularnewline
23 & 0.275344 & 2.9655 & 0.001834 \tabularnewline
24 & 0.429741 & 4.6284 & 5e-06 \tabularnewline
25 & 0.223353 & 2.4056 & 0.008863 \tabularnewline
26 & 0.172291 & 1.8556 & 0.033022 \tabularnewline
27 & 0.260587 & 2.8066 & 0.002937 \tabularnewline
28 & 0.149559 & 1.6108 & 0.05497 \tabularnewline
29 & 0.147437 & 1.5879 & 0.057511 \tabularnewline
30 & 0.280597 & 3.0221 & 0.001545 \tabularnewline
31 & 0.11002 & 1.185 & 0.119229 \tabularnewline
32 & 0.089234 & 0.9611 & 0.169257 \tabularnewline
33 & 0.149276 & 1.6077 & 0.055304 \tabularnewline
34 & 0.031668 & 0.3411 & 0.366831 \tabularnewline
35 & 0.064161 & 0.691 & 0.245462 \tabularnewline
36 & 0.205871 & 2.2173 & 0.014276 \tabularnewline
37 & 0.035949 & 0.3872 & 0.349667 \tabularnewline
38 & 0.016603 & 0.1788 & 0.429196 \tabularnewline
39 & 0.08517 & 0.9173 & 0.180442 \tabularnewline
40 & -0.013221 & -0.1424 & 0.443508 \tabularnewline
41 & -0.016405 & -0.1767 & 0.430031 \tabularnewline
42 & 0.08008 & 0.8625 & 0.195098 \tabularnewline
43 & -0.075098 & -0.8088 & 0.210135 \tabularnewline
44 & -0.098931 & -1.0655 & 0.144426 \tabularnewline
45 & -0.068419 & -0.7369 & 0.231336 \tabularnewline
46 & -0.167804 & -1.8073 & 0.036653 \tabularnewline
47 & -0.15002 & -1.6158 & 0.054431 \tabularnewline
48 & -0.036354 & -0.3915 & 0.348056 \tabularnewline
\hline
\end{tabular}
%Source: https://freestatistics.org/blog/index.php?pk=302752&T=1

[TABLE]
[ROW][C]Autocorrelation Function[/C][/ROW]
[ROW][C]Time lag k[/C][C]ACF(k)[/C][C]T-STAT[/C][C]P-value[/C][/ROW]
[ROW][C]1[/C][C]0.714877[/C][C]7.6995[/C][C]0[/C][/ROW]
[ROW][C]2[/C][C]0.634606[/C][C]6.8349[/C][C]0[/C][/ROW]
[ROW][C]3[/C][C]0.719932[/C][C]7.7539[/C][C]0[/C][/ROW]
[ROW][C]4[/C][C]0.583251[/C][C]6.2818[/C][C]0[/C][/ROW]
[ROW][C]5[/C][C]0.567714[/C][C]6.1145[/C][C]0[/C][/ROW]
[ROW][C]6[/C][C]0.713463[/C][C]7.6842[/C][C]0[/C][/ROW]
[ROW][C]7[/C][C]0.517456[/C][C]5.5732[/C][C]0[/C][/ROW]
[ROW][C]8[/C][C]0.472083[/C][C]5.0845[/C][C]1e-06[/C][/ROW]
[ROW][C]9[/C][C]0.551194[/C][C]5.9365[/C][C]0[/C][/ROW]
[ROW][C]10[/C][C]0.425189[/C][C]4.5794[/C][C]6e-06[/C][/ROW]
[ROW][C]11[/C][C]0.460556[/C][C]4.9603[/C][C]1e-06[/C][/ROW]
[ROW][C]12[/C][C]0.625585[/C][C]6.7378[/C][C]0[/C][/ROW]
[ROW][C]13[/C][C]0.414877[/C][C]4.4684[/C][C]9e-06[/C][/ROW]
[ROW][C]14[/C][C]0.369301[/C][C]3.9775[/C][C]6.1e-05[/C][/ROW]
[ROW][C]15[/C][C]0.478003[/C][C]5.1483[/C][C]1e-06[/C][/ROW]
[ROW][C]16[/C][C]0.366805[/C][C]3.9506[/C][C]6.7e-05[/C][/ROW]
[ROW][C]17[/C][C]0.3804[/C][C]4.097[/C][C]3.9e-05[/C][/ROW]
[ROW][C]18[/C][C]0.527867[/C][C]5.6853[/C][C]0[/C][/ROW]
[ROW][C]19[/C][C]0.339268[/C][C]3.654[/C][C]0.000195[/C][/ROW]
[ROW][C]20[/C][C]0.325168[/C][C]3.5022[/C][C]0.000328[/C][/ROW]
[ROW][C]21[/C][C]0.37791[/C][C]4.0702[/C][C]4.3e-05[/C][/ROW]
[ROW][C]22[/C][C]0.251763[/C][C]2.7116[/C][C]0.003857[/C][/ROW]
[ROW][C]23[/C][C]0.275344[/C][C]2.9655[/C][C]0.001834[/C][/ROW]
[ROW][C]24[/C][C]0.429741[/C][C]4.6284[/C][C]5e-06[/C][/ROW]
[ROW][C]25[/C][C]0.223353[/C][C]2.4056[/C][C]0.008863[/C][/ROW]
[ROW][C]26[/C][C]0.172291[/C][C]1.8556[/C][C]0.033022[/C][/ROW]
[ROW][C]27[/C][C]0.260587[/C][C]2.8066[/C][C]0.002937[/C][/ROW]
[ROW][C]28[/C][C]0.149559[/C][C]1.6108[/C][C]0.05497[/C][/ROW]
[ROW][C]29[/C][C]0.147437[/C][C]1.5879[/C][C]0.057511[/C][/ROW]
[ROW][C]30[/C][C]0.280597[/C][C]3.0221[/C][C]0.001545[/C][/ROW]
[ROW][C]31[/C][C]0.11002[/C][C]1.185[/C][C]0.119229[/C][/ROW]
[ROW][C]32[/C][C]0.089234[/C][C]0.9611[/C][C]0.169257[/C][/ROW]
[ROW][C]33[/C][C]0.149276[/C][C]1.6077[/C][C]0.055304[/C][/ROW]
[ROW][C]34[/C][C]0.031668[/C][C]0.3411[/C][C]0.366831[/C][/ROW]
[ROW][C]35[/C][C]0.064161[/C][C]0.691[/C][C]0.245462[/C][/ROW]
[ROW][C]36[/C][C]0.205871[/C][C]2.2173[/C][C]0.014276[/C][/ROW]
[ROW][C]37[/C][C]0.035949[/C][C]0.3872[/C][C]0.349667[/C][/ROW]
[ROW][C]38[/C][C]0.016603[/C][C]0.1788[/C][C]0.429196[/C][/ROW]
[ROW][C]39[/C][C]0.08517[/C][C]0.9173[/C][C]0.180442[/C][/ROW]
[ROW][C]40[/C][C]-0.013221[/C][C]-0.1424[/C][C]0.443508[/C][/ROW]
[ROW][C]41[/C][C]-0.016405[/C][C]-0.1767[/C][C]0.430031[/C][/ROW]
[ROW][C]42[/C][C]0.08008[/C][C]0.8625[/C][C]0.195098[/C][/ROW]
[ROW][C]43[/C][C]-0.075098[/C][C]-0.8088[/C][C]0.210135[/C][/ROW]
[ROW][C]44[/C][C]-0.098931[/C][C]-1.0655[/C][C]0.144426[/C][/ROW]
[ROW][C]45[/C][C]-0.068419[/C][C]-0.7369[/C][C]0.231336[/C][/ROW]
[ROW][C]46[/C][C]-0.167804[/C][C]-1.8073[/C][C]0.036653[/C][/ROW]
[ROW][C]47[/C][C]-0.15002[/C][C]-1.6158[/C][C]0.054431[/C][/ROW]
[ROW][C]48[/C][C]-0.036354[/C][C]-0.3915[/C][C]0.348056[/C][/ROW]
[/TABLE]
Source: https://freestatistics.org/blog/index.php?pk=302752&T=1

Globally Unique Identifier (entire table): ba.freestatistics.org/blog/index.php?pk=302752&T=1

As an alternative you can also use a QR Code:  

The GUIDs for individual cells are displayed in the table below:

Autocorrelation Function
Time lag kACF(k)T-STATP-value
10.7148777.69950
20.6346066.83490
30.7199327.75390
40.5832516.28180
50.5677146.11450
60.7134637.68420
70.5174565.57320
80.4720835.08451e-06
90.5511945.93650
100.4251894.57946e-06
110.4605564.96031e-06
120.6255856.73780
130.4148774.46849e-06
140.3693013.97756.1e-05
150.4780035.14831e-06
160.3668053.95066.7e-05
170.38044.0973.9e-05
180.5278675.68530
190.3392683.6540.000195
200.3251683.50220.000328
210.377914.07024.3e-05
220.2517632.71160.003857
230.2753442.96550.001834
240.4297414.62845e-06
250.2233532.40560.008863
260.1722911.85560.033022
270.2605872.80660.002937
280.1495591.61080.05497
290.1474371.58790.057511
300.2805973.02210.001545
310.110021.1850.119229
320.0892340.96110.169257
330.1492761.60770.055304
340.0316680.34110.366831
350.0641610.6910.245462
360.2058712.21730.014276
370.0359490.38720.349667
380.0166030.17880.429196
390.085170.91730.180442
40-0.013221-0.14240.443508
41-0.016405-0.17670.430031
420.080080.86250.195098
43-0.075098-0.80880.210135
44-0.098931-1.06550.144426
45-0.068419-0.73690.231336
46-0.167804-1.80730.036653
47-0.15002-1.61580.054431
48-0.036354-0.39150.348056


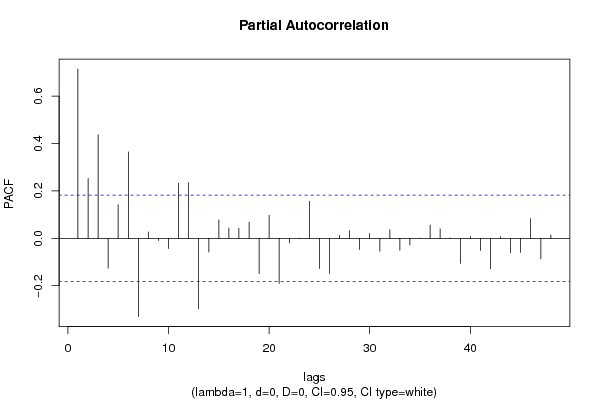
Partial Autocorrelation Function
Time lag kPACF(k)T-STATP-value
10.7148777.69950
20.2526962.72160.003749
30.4375074.71213e-06
4-0.125814-1.35510.089016
50.1416531.52560.06491
60.3644943.92577.4e-05
7-0.330646-3.56120.000268
80.0270530.29140.385646
9-0.009491-0.10220.45938
10-0.042941-0.46250.3223
110.2321632.50050.0069
120.2343872.52440.00647
13-0.297952-3.2090.000861
14-0.057888-0.62350.267101
150.0773360.83290.203296
160.0436920.47060.319414
170.042540.45820.323842
180.0682410.7350.231916
19-0.14914-1.60630.055465
200.0976061.05120.147665
21-0.190945-2.05650.020987
22-0.019792-0.21320.415786
23-0.002197-0.02370.49058
240.1564971.68550.047288
25-0.127309-1.37120.086486
26-0.148231-1.59650.056549
270.0122760.13220.447522
280.0320340.3450.365353
29-0.046963-0.50580.306976
300.0199440.21480.41515
31-0.054047-0.58210.280813
320.0360550.38830.349242
33-0.050634-0.54530.293281
34-0.02857-0.30770.379427
35-0.00076-0.00820.496743
360.0556590.59950.275014
370.0398910.42960.334127
380.0012150.01310.494791
39-0.105648-1.13790.128761
400.0076760.08270.467125
41-0.051338-0.55290.290688
42-0.128493-1.38390.08452
430.0063340.06820.472866
44-0.061271-0.65990.25531
45-0.058561-0.63070.264733
460.0827290.8910.187382
47-0.086347-0.930.177155
480.0138760.14950.440728

\begin{tabular}{lllllllll}
\hline
Partial Autocorrelation Function \tabularnewline
Time lag k & PACF(k) & T-STAT & P-value \tabularnewline
1 & 0.714877 & 7.6995 & 0 \tabularnewline
2 & 0.252696 & 2.7216 & 0.003749 \tabularnewline
3 & 0.437507 & 4.7121 & 3e-06 \tabularnewline
4 & -0.125814 & -1.3551 & 0.089016 \tabularnewline
5 & 0.141653 & 1.5256 & 0.06491 \tabularnewline
6 & 0.364494 & 3.9257 & 7.4e-05 \tabularnewline
7 & -0.330646 & -3.5612 & 0.000268 \tabularnewline
8 & 0.027053 & 0.2914 & 0.385646 \tabularnewline
9 & -0.009491 & -0.1022 & 0.45938 \tabularnewline
10 & -0.042941 & -0.4625 & 0.3223 \tabularnewline
11 & 0.232163 & 2.5005 & 0.0069 \tabularnewline
12 & 0.234387 & 2.5244 & 0.00647 \tabularnewline
13 & -0.297952 & -3.209 & 0.000861 \tabularnewline
14 & -0.057888 & -0.6235 & 0.267101 \tabularnewline
15 & 0.077336 & 0.8329 & 0.203296 \tabularnewline
16 & 0.043692 & 0.4706 & 0.319414 \tabularnewline
17 & 0.04254 & 0.4582 & 0.323842 \tabularnewline
18 & 0.068241 & 0.735 & 0.231916 \tabularnewline
19 & -0.14914 & -1.6063 & 0.055465 \tabularnewline
20 & 0.097606 & 1.0512 & 0.147665 \tabularnewline
21 & -0.190945 & -2.0565 & 0.020987 \tabularnewline
22 & -0.019792 & -0.2132 & 0.415786 \tabularnewline
23 & -0.002197 & -0.0237 & 0.49058 \tabularnewline
24 & 0.156497 & 1.6855 & 0.047288 \tabularnewline
25 & -0.127309 & -1.3712 & 0.086486 \tabularnewline
26 & -0.148231 & -1.5965 & 0.056549 \tabularnewline
27 & 0.012276 & 0.1322 & 0.447522 \tabularnewline
28 & 0.032034 & 0.345 & 0.365353 \tabularnewline
29 & -0.046963 & -0.5058 & 0.306976 \tabularnewline
30 & 0.019944 & 0.2148 & 0.41515 \tabularnewline
31 & -0.054047 & -0.5821 & 0.280813 \tabularnewline
32 & 0.036055 & 0.3883 & 0.349242 \tabularnewline
33 & -0.050634 & -0.5453 & 0.293281 \tabularnewline
34 & -0.02857 & -0.3077 & 0.379427 \tabularnewline
35 & -0.00076 & -0.0082 & 0.496743 \tabularnewline
36 & 0.055659 & 0.5995 & 0.275014 \tabularnewline
37 & 0.039891 & 0.4296 & 0.334127 \tabularnewline
38 & 0.001215 & 0.0131 & 0.494791 \tabularnewline
39 & -0.105648 & -1.1379 & 0.128761 \tabularnewline
40 & 0.007676 & 0.0827 & 0.467125 \tabularnewline
41 & -0.051338 & -0.5529 & 0.290688 \tabularnewline
42 & -0.128493 & -1.3839 & 0.08452 \tabularnewline
43 & 0.006334 & 0.0682 & 0.472866 \tabularnewline
44 & -0.061271 & -0.6599 & 0.25531 \tabularnewline
45 & -0.058561 & -0.6307 & 0.264733 \tabularnewline
46 & 0.082729 & 0.891 & 0.187382 \tabularnewline
47 & -0.086347 & -0.93 & 0.177155 \tabularnewline
48 & 0.013876 & 0.1495 & 0.440728 \tabularnewline
\hline
\end{tabular}
%Source: https://freestatistics.org/blog/index.php?pk=302752&T=2

[TABLE]
[ROW][C]Partial Autocorrelation Function[/C][/ROW]
[ROW][C]Time lag k[/C][C]PACF(k)[/C][C]T-STAT[/C][C]P-value[/C][/ROW]
[ROW][C]1[/C][C]0.714877[/C][C]7.6995[/C][C]0[/C][/ROW]
[ROW][C]2[/C][C]0.252696[/C][C]2.7216[/C][C]0.003749[/C][/ROW]
[ROW][C]3[/C][C]0.437507[/C][C]4.7121[/C][C]3e-06[/C][/ROW]
[ROW][C]4[/C][C]-0.125814[/C][C]-1.3551[/C][C]0.089016[/C][/ROW]
[ROW][C]5[/C][C]0.141653[/C][C]1.5256[/C][C]0.06491[/C][/ROW]
[ROW][C]6[/C][C]0.364494[/C][C]3.9257[/C][C]7.4e-05[/C][/ROW]
[ROW][C]7[/C][C]-0.330646[/C][C]-3.5612[/C][C]0.000268[/C][/ROW]
[ROW][C]8[/C][C]0.027053[/C][C]0.2914[/C][C]0.385646[/C][/ROW]
[ROW][C]9[/C][C]-0.009491[/C][C]-0.1022[/C][C]0.45938[/C][/ROW]
[ROW][C]10[/C][C]-0.042941[/C][C]-0.4625[/C][C]0.3223[/C][/ROW]
[ROW][C]11[/C][C]0.232163[/C][C]2.5005[/C][C]0.0069[/C][/ROW]
[ROW][C]12[/C][C]0.234387[/C][C]2.5244[/C][C]0.00647[/C][/ROW]
[ROW][C]13[/C][C]-0.297952[/C][C]-3.209[/C][C]0.000861[/C][/ROW]
[ROW][C]14[/C][C]-0.057888[/C][C]-0.6235[/C][C]0.267101[/C][/ROW]
[ROW][C]15[/C][C]0.077336[/C][C]0.8329[/C][C]0.203296[/C][/ROW]
[ROW][C]16[/C][C]0.043692[/C][C]0.4706[/C][C]0.319414[/C][/ROW]
[ROW][C]17[/C][C]0.04254[/C][C]0.4582[/C][C]0.323842[/C][/ROW]
[ROW][C]18[/C][C]0.068241[/C][C]0.735[/C][C]0.231916[/C][/ROW]
[ROW][C]19[/C][C]-0.14914[/C][C]-1.6063[/C][C]0.055465[/C][/ROW]
[ROW][C]20[/C][C]0.097606[/C][C]1.0512[/C][C]0.147665[/C][/ROW]
[ROW][C]21[/C][C]-0.190945[/C][C]-2.0565[/C][C]0.020987[/C][/ROW]
[ROW][C]22[/C][C]-0.019792[/C][C]-0.2132[/C][C]0.415786[/C][/ROW]
[ROW][C]23[/C][C]-0.002197[/C][C]-0.0237[/C][C]0.49058[/C][/ROW]
[ROW][C]24[/C][C]0.156497[/C][C]1.6855[/C][C]0.047288[/C][/ROW]
[ROW][C]25[/C][C]-0.127309[/C][C]-1.3712[/C][C]0.086486[/C][/ROW]
[ROW][C]26[/C][C]-0.148231[/C][C]-1.5965[/C][C]0.056549[/C][/ROW]
[ROW][C]27[/C][C]0.012276[/C][C]0.1322[/C][C]0.447522[/C][/ROW]
[ROW][C]28[/C][C]0.032034[/C][C]0.345[/C][C]0.365353[/C][/ROW]
[ROW][C]29[/C][C]-0.046963[/C][C]-0.5058[/C][C]0.306976[/C][/ROW]
[ROW][C]30[/C][C]0.019944[/C][C]0.2148[/C][C]0.41515[/C][/ROW]
[ROW][C]31[/C][C]-0.054047[/C][C]-0.5821[/C][C]0.280813[/C][/ROW]
[ROW][C]32[/C][C]0.036055[/C][C]0.3883[/C][C]0.349242[/C][/ROW]
[ROW][C]33[/C][C]-0.050634[/C][C]-0.5453[/C][C]0.293281[/C][/ROW]
[ROW][C]34[/C][C]-0.02857[/C][C]-0.3077[/C][C]0.379427[/C][/ROW]
[ROW][C]35[/C][C]-0.00076[/C][C]-0.0082[/C][C]0.496743[/C][/ROW]
[ROW][C]36[/C][C]0.055659[/C][C]0.5995[/C][C]0.275014[/C][/ROW]
[ROW][C]37[/C][C]0.039891[/C][C]0.4296[/C][C]0.334127[/C][/ROW]
[ROW][C]38[/C][C]0.001215[/C][C]0.0131[/C][C]0.494791[/C][/ROW]
[ROW][C]39[/C][C]-0.105648[/C][C]-1.1379[/C][C]0.128761[/C][/ROW]
[ROW][C]40[/C][C]0.007676[/C][C]0.0827[/C][C]0.467125[/C][/ROW]
[ROW][C]41[/C][C]-0.051338[/C][C]-0.5529[/C][C]0.290688[/C][/ROW]
[ROW][C]42[/C][C]-0.128493[/C][C]-1.3839[/C][C]0.08452[/C][/ROW]
[ROW][C]43[/C][C]0.006334[/C][C]0.0682[/C][C]0.472866[/C][/ROW]
[ROW][C]44[/C][C]-0.061271[/C][C]-0.6599[/C][C]0.25531[/C][/ROW]
[ROW][C]45[/C][C]-0.058561[/C][C]-0.6307[/C][C]0.264733[/C][/ROW]
[ROW][C]46[/C][C]0.082729[/C][C]0.891[/C][C]0.187382[/C][/ROW]
[ROW][C]47[/C][C]-0.086347[/C][C]-0.93[/C][C]0.177155[/C][/ROW]
[ROW][C]48[/C][C]0.013876[/C][C]0.1495[/C][C]0.440728[/C][/ROW]
[/TABLE]
Source: https://freestatistics.org/blog/index.php?pk=302752&T=2

Globally Unique Identifier (entire table): ba.freestatistics.org/blog/index.php?pk=302752&T=2

As an alternative you can also use a QR Code:  

The GUIDs for individual cells are displayed in the table below:

Partial Autocorrelation Function
Time lag kPACF(k)T-STATP-value
10.7148777.69950
20.2526962.72160.003749
30.4375074.71213e-06
4-0.125814-1.35510.089016
50.1416531.52560.06491
60.3644943.92577.4e-05
7-0.330646-3.56120.000268
80.0270530.29140.385646
9-0.009491-0.10220.45938
10-0.042941-0.46250.3223
110.2321632.50050.0069
120.2343872.52440.00647
13-0.297952-3.2090.000861
14-0.057888-0.62350.267101
150.0773360.83290.203296
160.0436920.47060.319414
170.042540.45820.323842
180.0682410.7350.231916
19-0.14914-1.60630.055465
200.0976061.05120.147665
21-0.190945-2.05650.020987
22-0.019792-0.21320.415786
23-0.002197-0.02370.49058
240.1564971.68550.047288
25-0.127309-1.37120.086486
26-0.148231-1.59650.056549
270.0122760.13220.447522
280.0320340.3450.365353
29-0.046963-0.50580.306976
300.0199440.21480.41515
31-0.054047-0.58210.280813
320.0360550.38830.349242
33-0.050634-0.54530.293281
34-0.02857-0.30770.379427
35-0.00076-0.00820.496743
360.0556590.59950.275014
370.0398910.42960.334127
380.0012150.01310.494791
39-0.105648-1.13790.128761
400.0076760.08270.467125
41-0.051338-0.55290.290688
42-0.128493-1.38390.08452
430.0063340.06820.472866
44-0.061271-0.65990.25531
45-0.058561-0.63070.264733
460.0827290.8910.187382
47-0.086347-0.930.177155
480.0138760.14950.440728


Parameters (Session):
par1 = 48 ; par2 = 1 ; par3 = 0 ; par4 = 0 ; par5 = 12 ; par6 = White Noise ; par7 = 0.95 ;
Parameters (R input):
par1 = 48 ; par2 = 1 ; par3 = 0 ; par4 = 0 ; par5 = 12 ; par6 = White Noise ; par7 = 0.95 ; par8 = ;
R code (references can be found in the software module):
par8 <- ''
par7 <- '0.95'
par6 <- 'White Noise'
par5 <- '12'
par4 <- '0'
par3 <- '0'
par2 <- '1'
par1 <- '48'
if (par1 == 'Default') {
par1 = 10*log10(length(x))
} else {
par1 <- as.numeric(par1)
}
par2 <- as.numeric(par2)
par3 <- as.numeric(par3)
par4 <- as.numeric(par4)
par5 <- as.numeric(par5)
if (par6 == 'White Noise') par6 <- 'white' else par6 <- 'ma'
par7 <- as.numeric(par7)
if (par8 != '') par8 <- as.numeric(par8)
x <- na.omit(x)
ox <- x
if (par8 == '') {
if (par2 == 0) {
x <- log(x)
} else {
x <- (x ^ par2 - 1) / par2
}
} else {
x <- log(x,base=par8)
}
if (par3 > 0) x <- diff(x,lag=1,difference=par3)
if (par4 > 0) x <- diff(x,lag=par5,difference=par4)
bitmap(file='picts.png')
op <- par(mfrow=c(2,1))
plot(ox,type='l',main='Original Time Series',xlab='time',ylab='value')
if (par8=='') {
mytitle <- paste('Working Time Series (lambda=',par2,', d=',par3,', D=',par4,')',sep='')
mysub <- paste('(lambda=',par2,', d=',par3,', D=',par4,', CI=', par7, ', CI type=',par6,')',sep='')
} else {
mytitle <- paste('Working Time Series (base=',par8,', d=',par3,', D=',par4,')',sep='')
mysub <- paste('(base=',par8,', d=',par3,', D=',par4,', CI=', par7, ', CI type=',par6,')',sep='')
}
plot(x,type='l', main=mytitle,xlab='time',ylab='value')
par(op)
dev.off()
bitmap(file='pic1.png')
racf <- acf(x, par1, main='Autocorrelation', xlab='time lag', ylab='ACF', ci.type=par6, ci=par7, sub=mysub)
dev.off()
bitmap(file='pic2.png')
rpacf <- pacf(x,par1,main='Partial Autocorrelation',xlab='lags',ylab='PACF',sub=mysub)
dev.off()
(myacf <- c(racf$acf))
(mypacf <- c(rpacf$acf))
lengthx <- length(x)
sqrtn <- sqrt(lengthx)
load(file='createtable')
a<-table.start()
a<-table.row.start(a)
a<-table.element(a,'Autocorrelation Function',4,TRUE)
a<-table.row.end(a)
a<-table.row.start(a)
a<-table.element(a,'Time lag k',header=TRUE)
a<-table.element(a,'ACF(k)',header=TRUE)
a<-table.element(a,'T-STAT',header=TRUE)
a<-table.element(a,'P-value',header=TRUE)
a<-table.row.end(a)
for (i in 2:(par1+1)) {
a<-table.row.start(a)
a<-table.element(a,i-1,header=TRUE)
a<-table.element(a,round(myacf[i],6))
mytstat <- myacf[i]*sqrtn
a<-table.element(a,round(mytstat,4))
a<-table.element(a,round(1-pt(abs(mytstat),lengthx),6))
a<-table.row.end(a)
}
a<-table.end(a)
table.save(a,file='mytable.tab')
a<-table.start()
a<-table.row.start(a)
a<-table.element(a,'Partial Autocorrelation Function',4,TRUE)
a<-table.row.end(a)
a<-table.row.start(a)
a<-table.element(a,'Time lag k',header=TRUE)
a<-table.element(a,'PACF(k)',header=TRUE)
a<-table.element(a,'T-STAT',header=TRUE)
a<-table.element(a,'P-value',header=TRUE)
a<-table.row.end(a)
for (i in 1:par1) {
a<-table.row.start(a)
a<-table.element(a,i,header=TRUE)
a<-table.element(a,round(mypacf[i],6))
mytstat <- mypacf[i]*sqrtn
a<-table.element(a,round(mytstat,4))
a<-table.element(a,round(1-pt(abs(mytstat),lengthx),6))
a<-table.row.end(a)
}
a<-table.end(a)
table.save(a,file='mytable1.tab')