Free Statistics

of Irreproducible Research!

Author's title

Author*The author of this computation has been verified*
R Software Modulerwasp_arimabackwardselection.wasp
Title produced by softwareARIMA Backward Selection
Date of computationFri, 23 Dec 2016 09:07:47 +0100
Cite this page as followsStatistical Computations at FreeStatistics.org, Office for Research Development and Education, URL https://freestatistics.org/blog/index.php?v=date/2016/Dec/23/t1482480507x9lfry51y4q71nu.htm/, Retrieved Tue, 07 May 2024 22:22:21 +0000
Statistical Computations at FreeStatistics.org, Office for Research Development and Education, URL https://freestatistics.org/blog/index.php?pk=302770, Retrieved Tue, 07 May 2024 22:22:21 +0000
QR Codes:

Original text written by user:
IsPrivate?No (this computation is public)
User-defined keywords
Estimated Impact109
Family? (F = Feedback message, R = changed R code, M = changed R Module, P = changed Parameters, D = changed Data)
-     [Kendall tau Correlation Matrix] [Correlation matrices] [2016-12-21 16:26:17] [b011e1d1c3fc908d73f0b66878a70c1c]
- RMPD    [ARIMA Backward Selection] [ARIMA Backward se...] [2016-12-23 08:07:47] [0fd57913e31aa45e4c342a705351a504] [Current]
Feedback Forum

Post a new message
Dataseries X:
3233.7
3097.3
3216.8
3729.6
3447.7
3384.3
3494.7
3904.2
3605.2
3674.6
3751.1
4039.5
3885.9
3906.1
3965
4411.6
4325.1
4349.2
4426.1
4915
4506.9
4497.4
4546.5
5122
4471.3
4560.6
4581.6
5186.2
4719.8
4784.1
4778.6
5494.8
4966.8
5188.2
5135.4
5690.4
5293.5
5673.8
5568.9
6094.2
5712.7
5858.7
5814.6
6616.6


Summary of computational transaction
Raw Input view raw input (R code)
Raw Outputview raw output of R engine
Computing time3 seconds
R ServerBig Analytics Cloud Computing Center

\begin{tabular}{lllllllll}
\hline
Summary of computational transaction \tabularnewline
Raw Input view raw input (R code)  \tabularnewline
Raw Outputview raw output of R engine  \tabularnewline
Computing time3 seconds \tabularnewline
R ServerBig Analytics Cloud Computing Center \tabularnewline
\hline
\end{tabular}
%Source: https://freestatistics.org/blog/index.php?pk=302770&T=0

[TABLE]
[ROW]
Summary of computational transaction[/C][/ROW] [ROW]Raw Input[/C] view raw input (R code) [/C][/ROW] [ROW]Raw Output[/C]view raw output of R engine [/C][/ROW] [ROW]Computing time[/C]3 seconds[/C][/ROW] [ROW]R Server[/C]Big Analytics Cloud Computing Center[/C][/ROW] [/TABLE] Source: https://freestatistics.org/blog/index.php?pk=302770&T=0

Globally Unique Identifier (entire table): ba.freestatistics.org/blog/index.php?pk=302770&T=0

As an alternative you can also use a QR Code:  

The GUIDs for individual cells are displayed in the table below:

Summary of computational transaction
Raw Input view raw input (R code)
Raw Outputview raw output of R engine
Computing time3 seconds
R ServerBig Analytics Cloud Computing Center


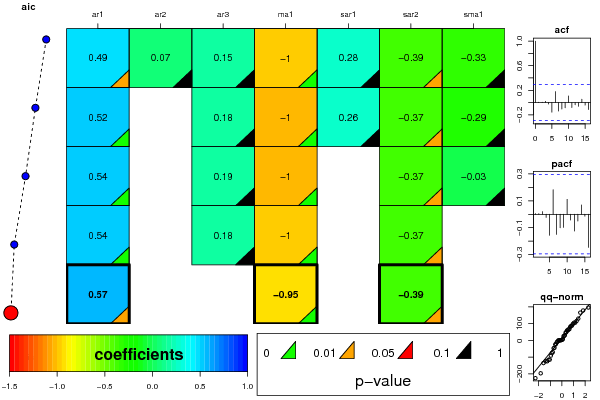
ARIMA Parameter Estimation and Backward Selection
Iterationar1ar2ar3ma1sar1sar2sma1
Estimates ( 1 )0.48960.07240.1514-10.276-0.3889-0.3343
(p-val)(0.0169 )(0.7583 )(0.4139 )(0 )(0.4608 )(0.0338 )(0.416 )
Estimates ( 2 )0.520600.1775-10.2568-0.3724-0.289
(p-val)(0.0035 )(NA )(0.2787 )(0 )(0.5385 )(0.033 )(0.5067 )
Estimates ( 3 )0.543700.1867-10-0.3686-0.0257
(p-val)(0.0014 )(NA )(0.237 )(0 )(NA )(0.0273 )(0.8937 )
Estimates ( 4 )0.54100.1819-10-0.36820
(p-val)(0.0013 )(NA )(0.2372 )(0 )(NA )(0.0274 )(NA )
Estimates ( 5 )0.57200-0.94740-0.38880
(p-val)(0.0253 )(NA )(NA )(0.0022 )(NA )(0.0235 )(NA )
Estimates ( 6 )NANANANANANANA
(p-val)(NA )(NA )(NA )(NA )(NA )(NA )(NA )
Estimates ( 7 )NANANANANANANA
(p-val)(NA )(NA )(NA )(NA )(NA )(NA )(NA )
Estimates ( 8 )NANANANANANANA
(p-val)(NA )(NA )(NA )(NA )(NA )(NA )(NA )
Estimates ( 9 )NANANANANANANA
(p-val)(NA )(NA )(NA )(NA )(NA )(NA )(NA )
Estimates ( 10 )NANANANANANANA
(p-val)(NA )(NA )(NA )(NA )(NA )(NA )(NA )
Estimates ( 11 )NANANANANANANA
(p-val)(NA )(NA )(NA )(NA )(NA )(NA )(NA )
Estimates ( 12 )NANANANANANANA
(p-val)(NA )(NA )(NA )(NA )(NA )(NA )(NA )
Estimates ( 13 )NANANANANANANA
(p-val)(NA )(NA )(NA )(NA )(NA )(NA )(NA )

\begin{tabular}{lllllllll}
\hline
ARIMA Parameter Estimation and Backward Selection \tabularnewline
Iteration & ar1 & ar2 & ar3 & ma1 & sar1 & sar2 & sma1 \tabularnewline
Estimates ( 1 ) & 0.4896 & 0.0724 & 0.1514 & -1 & 0.276 & -0.3889 & -0.3343 \tabularnewline
(p-val) & (0.0169 ) & (0.7583 ) & (0.4139 ) & (0 ) & (0.4608 ) & (0.0338 ) & (0.416 ) \tabularnewline
Estimates ( 2 ) & 0.5206 & 0 & 0.1775 & -1 & 0.2568 & -0.3724 & -0.289 \tabularnewline
(p-val) & (0.0035 ) & (NA ) & (0.2787 ) & (0 ) & (0.5385 ) & (0.033 ) & (0.5067 ) \tabularnewline
Estimates ( 3 ) & 0.5437 & 0 & 0.1867 & -1 & 0 & -0.3686 & -0.0257 \tabularnewline
(p-val) & (0.0014 ) & (NA ) & (0.237 ) & (0 ) & (NA ) & (0.0273 ) & (0.8937 ) \tabularnewline
Estimates ( 4 ) & 0.541 & 0 & 0.1819 & -1 & 0 & -0.3682 & 0 \tabularnewline
(p-val) & (0.0013 ) & (NA ) & (0.2372 ) & (0 ) & (NA ) & (0.0274 ) & (NA ) \tabularnewline
Estimates ( 5 ) & 0.572 & 0 & 0 & -0.9474 & 0 & -0.3888 & 0 \tabularnewline
(p-val) & (0.0253 ) & (NA ) & (NA ) & (0.0022 ) & (NA ) & (0.0235 ) & (NA ) \tabularnewline
Estimates ( 6 ) & NA & NA & NA & NA & NA & NA & NA \tabularnewline
(p-val) & (NA ) & (NA ) & (NA ) & (NA ) & (NA ) & (NA ) & (NA ) \tabularnewline
Estimates ( 7 ) & NA & NA & NA & NA & NA & NA & NA \tabularnewline
(p-val) & (NA ) & (NA ) & (NA ) & (NA ) & (NA ) & (NA ) & (NA ) \tabularnewline
Estimates ( 8 ) & NA & NA & NA & NA & NA & NA & NA \tabularnewline
(p-val) & (NA ) & (NA ) & (NA ) & (NA ) & (NA ) & (NA ) & (NA ) \tabularnewline
Estimates ( 9 ) & NA & NA & NA & NA & NA & NA & NA \tabularnewline
(p-val) & (NA ) & (NA ) & (NA ) & (NA ) & (NA ) & (NA ) & (NA ) \tabularnewline
Estimates ( 10 ) & NA & NA & NA & NA & NA & NA & NA \tabularnewline
(p-val) & (NA ) & (NA ) & (NA ) & (NA ) & (NA ) & (NA ) & (NA ) \tabularnewline
Estimates ( 11 ) & NA & NA & NA & NA & NA & NA & NA \tabularnewline
(p-val) & (NA ) & (NA ) & (NA ) & (NA ) & (NA ) & (NA ) & (NA ) \tabularnewline
Estimates ( 12 ) & NA & NA & NA & NA & NA & NA & NA \tabularnewline
(p-val) & (NA ) & (NA ) & (NA ) & (NA ) & (NA ) & (NA ) & (NA ) \tabularnewline
Estimates ( 13 ) & NA & NA & NA & NA & NA & NA & NA \tabularnewline
(p-val) & (NA ) & (NA ) & (NA ) & (NA ) & (NA ) & (NA ) & (NA ) \tabularnewline
\hline
\end{tabular}
%Source: https://freestatistics.org/blog/index.php?pk=302770&T=1

[TABLE]
[ROW][C]ARIMA Parameter Estimation and Backward Selection[/C][/ROW]
[ROW][C]Iteration[/C][C]ar1[/C][C]ar2[/C][C]ar3[/C][C]ma1[/C][C]sar1[/C][C]sar2[/C][C]sma1[/C][/ROW]
[ROW][C]Estimates ( 1 )[/C][C]0.4896[/C][C]0.0724[/C][C]0.1514[/C][C]-1[/C][C]0.276[/C][C]-0.3889[/C][C]-0.3343[/C][/ROW]
[ROW][C](p-val)[/C][C](0.0169 )[/C][C](0.7583 )[/C][C](0.4139 )[/C][C](0 )[/C][C](0.4608 )[/C][C](0.0338 )[/C][C](0.416 )[/C][/ROW]
[ROW][C]Estimates ( 2 )[/C][C]0.5206[/C][C]0[/C][C]0.1775[/C][C]-1[/C][C]0.2568[/C][C]-0.3724[/C][C]-0.289[/C][/ROW]
[ROW][C](p-val)[/C][C](0.0035 )[/C][C](NA )[/C][C](0.2787 )[/C][C](0 )[/C][C](0.5385 )[/C][C](0.033 )[/C][C](0.5067 )[/C][/ROW]
[ROW][C]Estimates ( 3 )[/C][C]0.5437[/C][C]0[/C][C]0.1867[/C][C]-1[/C][C]0[/C][C]-0.3686[/C][C]-0.0257[/C][/ROW]
[ROW][C](p-val)[/C][C](0.0014 )[/C][C](NA )[/C][C](0.237 )[/C][C](0 )[/C][C](NA )[/C][C](0.0273 )[/C][C](0.8937 )[/C][/ROW]
[ROW][C]Estimates ( 4 )[/C][C]0.541[/C][C]0[/C][C]0.1819[/C][C]-1[/C][C]0[/C][C]-0.3682[/C][C]0[/C][/ROW]
[ROW][C](p-val)[/C][C](0.0013 )[/C][C](NA )[/C][C](0.2372 )[/C][C](0 )[/C][C](NA )[/C][C](0.0274 )[/C][C](NA )[/C][/ROW]
[ROW][C]Estimates ( 5 )[/C][C]0.572[/C][C]0[/C][C]0[/C][C]-0.9474[/C][C]0[/C][C]-0.3888[/C][C]0[/C][/ROW]
[ROW][C](p-val)[/C][C](0.0253 )[/C][C](NA )[/C][C](NA )[/C][C](0.0022 )[/C][C](NA )[/C][C](0.0235 )[/C][C](NA )[/C][/ROW]
[ROW][C]Estimates ( 6 )[/C][C]NA[/C][C]NA[/C][C]NA[/C][C]NA[/C][C]NA[/C][C]NA[/C][C]NA[/C][/ROW]
[ROW][C](p-val)[/C][C](NA )[/C][C](NA )[/C][C](NA )[/C][C](NA )[/C][C](NA )[/C][C](NA )[/C][C](NA )[/C][/ROW]
[ROW][C]Estimates ( 7 )[/C][C]NA[/C][C]NA[/C][C]NA[/C][C]NA[/C][C]NA[/C][C]NA[/C][C]NA[/C][/ROW]
[ROW][C](p-val)[/C][C](NA )[/C][C](NA )[/C][C](NA )[/C][C](NA )[/C][C](NA )[/C][C](NA )[/C][C](NA )[/C][/ROW]
[ROW][C]Estimates ( 8 )[/C][C]NA[/C][C]NA[/C][C]NA[/C][C]NA[/C][C]NA[/C][C]NA[/C][C]NA[/C][/ROW]
[ROW][C](p-val)[/C][C](NA )[/C][C](NA )[/C][C](NA )[/C][C](NA )[/C][C](NA )[/C][C](NA )[/C][C](NA )[/C][/ROW]
[ROW][C]Estimates ( 9 )[/C][C]NA[/C][C]NA[/C][C]NA[/C][C]NA[/C][C]NA[/C][C]NA[/C][C]NA[/C][/ROW]
[ROW][C](p-val)[/C][C](NA )[/C][C](NA )[/C][C](NA )[/C][C](NA )[/C][C](NA )[/C][C](NA )[/C][C](NA )[/C][/ROW]
[ROW][C]Estimates ( 10 )[/C][C]NA[/C][C]NA[/C][C]NA[/C][C]NA[/C][C]NA[/C][C]NA[/C][C]NA[/C][/ROW]
[ROW][C](p-val)[/C][C](NA )[/C][C](NA )[/C][C](NA )[/C][C](NA )[/C][C](NA )[/C][C](NA )[/C][C](NA )[/C][/ROW]
[ROW][C]Estimates ( 11 )[/C][C]NA[/C][C]NA[/C][C]NA[/C][C]NA[/C][C]NA[/C][C]NA[/C][C]NA[/C][/ROW]
[ROW][C](p-val)[/C][C](NA )[/C][C](NA )[/C][C](NA )[/C][C](NA )[/C][C](NA )[/C][C](NA )[/C][C](NA )[/C][/ROW]
[ROW][C]Estimates ( 12 )[/C][C]NA[/C][C]NA[/C][C]NA[/C][C]NA[/C][C]NA[/C][C]NA[/C][C]NA[/C][/ROW]
[ROW][C](p-val)[/C][C](NA )[/C][C](NA )[/C][C](NA )[/C][C](NA )[/C][C](NA )[/C][C](NA )[/C][C](NA )[/C][/ROW]
[ROW][C]Estimates ( 13 )[/C][C]NA[/C][C]NA[/C][C]NA[/C][C]NA[/C][C]NA[/C][C]NA[/C][C]NA[/C][/ROW]
[ROW][C](p-val)[/C][C](NA )[/C][C](NA )[/C][C](NA )[/C][C](NA )[/C][C](NA )[/C][C](NA )[/C][C](NA )[/C][/ROW]
[/TABLE]
Source: https://freestatistics.org/blog/index.php?pk=302770&T=1

Globally Unique Identifier (entire table): ba.freestatistics.org/blog/index.php?pk=302770&T=1

As an alternative you can also use a QR Code:  

The GUIDs for individual cells are displayed in the table below:

ARIMA Parameter Estimation and Backward Selection
Iterationar1ar2ar3ma1sar1sar2sma1
Estimates ( 1 )0.48960.07240.1514-10.276-0.3889-0.3343
(p-val)(0.0169 )(0.7583 )(0.4139 )(0 )(0.4608 )(0.0338 )(0.416 )
Estimates ( 2 )0.520600.1775-10.2568-0.3724-0.289
(p-val)(0.0035 )(NA )(0.2787 )(0 )(0.5385 )(0.033 )(0.5067 )
Estimates ( 3 )0.543700.1867-10-0.3686-0.0257
(p-val)(0.0014 )(NA )(0.237 )(0 )(NA )(0.0273 )(0.8937 )
Estimates ( 4 )0.54100.1819-10-0.36820
(p-val)(0.0013 )(NA )(0.2372 )(0 )(NA )(0.0274 )(NA )
Estimates ( 5 )0.57200-0.94740-0.38880
(p-val)(0.0253 )(NA )(NA )(0.0022 )(NA )(0.0235 )(NA )
Estimates ( 6 )NANANANANANANA
(p-val)(NA )(NA )(NA )(NA )(NA )(NA )(NA )
Estimates ( 7 )NANANANANANANA
(p-val)(NA )(NA )(NA )(NA )(NA )(NA )(NA )
Estimates ( 8 )NANANANANANANA
(p-val)(NA )(NA )(NA )(NA )(NA )(NA )(NA )
Estimates ( 9 )NANANANANANANA
(p-val)(NA )(NA )(NA )(NA )(NA )(NA )(NA )
Estimates ( 10 )NANANANANANANA
(p-val)(NA )(NA )(NA )(NA )(NA )(NA )(NA )
Estimates ( 11 )NANANANANANANA
(p-val)(NA )(NA )(NA )(NA )(NA )(NA )(NA )
Estimates ( 12 )NANANANANANANA
(p-val)(NA )(NA )(NA )(NA )(NA )(NA )(NA )
Estimates ( 13 )NANANANANANANA
(p-val)(NA )(NA )(NA )(NA )(NA )(NA )(NA )


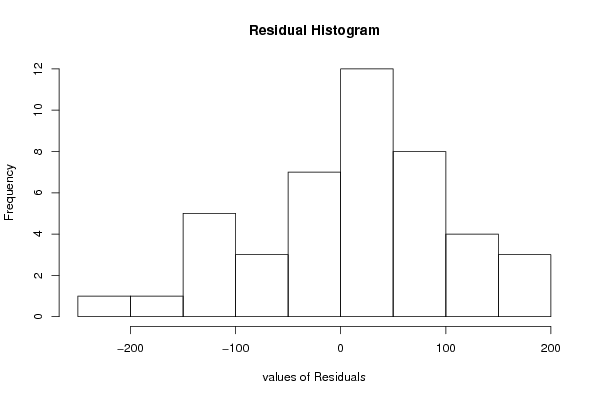
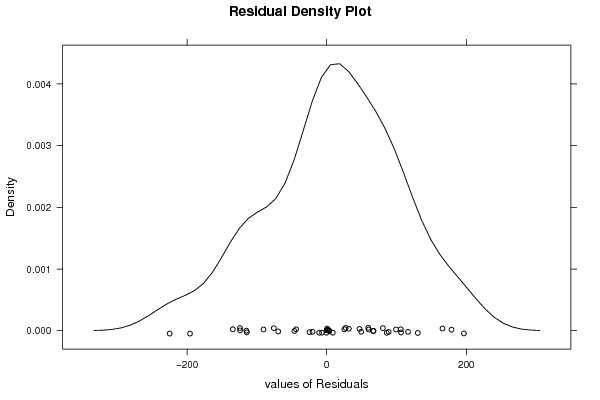
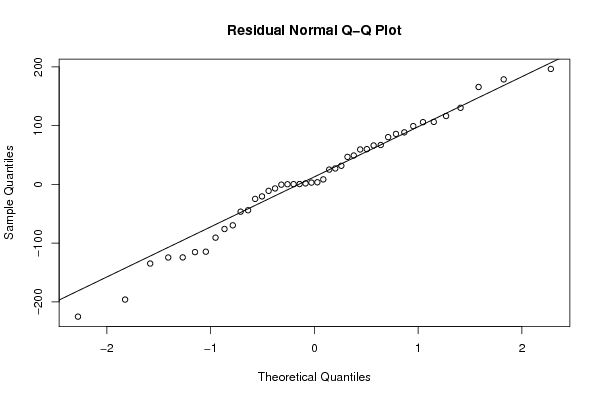
Estimated ARIMA Residuals
Value
-6.72617378375217
59.5827130161505
8.66039418687275
-75.7845821525154
-46.2847161294621
86.0343689939946
3.12255623747963
-90.532127058776
80.5331522521716
-10.7930434833626
0.419244469943562
106.089364637785
99.3289744308422
116.521716840869
66.386515670467
46.9875974950216
-224.975341789912
-124.14721529566
-124.265709345918
88.7222523189723
-195.916292599706
31.8221664015193
-69.4990387957983
27.2322214430732
49.3354334943038
-20.2939297520091
-43.8553626933965
106.518884632835
-115.127187506937
165.934672971035
-24.6022198410127
-114.453777192955
130.530400842804
178.849765746482
60.1824833520157
67.2023934638943
25.3610481021528
-134.573940261221
3.78111707179251
196.642389824587

\begin{tabular}{lllllllll}
\hline
Estimated ARIMA Residuals \tabularnewline
Value \tabularnewline
-6.72617378375217 \tabularnewline
59.5827130161505 \tabularnewline
8.66039418687275 \tabularnewline
-75.7845821525154 \tabularnewline
-46.2847161294621 \tabularnewline
86.0343689939946 \tabularnewline
3.12255623747963 \tabularnewline
-90.532127058776 \tabularnewline
80.5331522521716 \tabularnewline
-10.7930434833626 \tabularnewline
0.419244469943562 \tabularnewline
106.089364637785 \tabularnewline
99.3289744308422 \tabularnewline
116.521716840869 \tabularnewline
66.386515670467 \tabularnewline
46.9875974950216 \tabularnewline
-224.975341789912 \tabularnewline
-124.14721529566 \tabularnewline
-124.265709345918 \tabularnewline
88.7222523189723 \tabularnewline
-195.916292599706 \tabularnewline
31.8221664015193 \tabularnewline
-69.4990387957983 \tabularnewline
27.2322214430732 \tabularnewline
49.3354334943038 \tabularnewline
-20.2939297520091 \tabularnewline
-43.8553626933965 \tabularnewline
106.518884632835 \tabularnewline
-115.127187506937 \tabularnewline
165.934672971035 \tabularnewline
-24.6022198410127 \tabularnewline
-114.453777192955 \tabularnewline
130.530400842804 \tabularnewline
178.849765746482 \tabularnewline
60.1824833520157 \tabularnewline
67.2023934638943 \tabularnewline
25.3610481021528 \tabularnewline
-134.573940261221 \tabularnewline
3.78111707179251 \tabularnewline
196.642389824587 \tabularnewline
\hline
\end{tabular}
%Source: https://freestatistics.org/blog/index.php?pk=302770&T=2

[TABLE]
[ROW][C]Estimated ARIMA Residuals[/C][/ROW]
[ROW][C]Value[/C][/ROW]
[ROW][C]-6.72617378375217[/C][/ROW]
[ROW][C]59.5827130161505[/C][/ROW]
[ROW][C]8.66039418687275[/C][/ROW]
[ROW][C]-75.7845821525154[/C][/ROW]
[ROW][C]-46.2847161294621[/C][/ROW]
[ROW][C]86.0343689939946[/C][/ROW]
[ROW][C]3.12255623747963[/C][/ROW]
[ROW][C]-90.532127058776[/C][/ROW]
[ROW][C]80.5331522521716[/C][/ROW]
[ROW][C]-10.7930434833626[/C][/ROW]
[ROW][C]0.419244469943562[/C][/ROW]
[ROW][C]106.089364637785[/C][/ROW]
[ROW][C]99.3289744308422[/C][/ROW]
[ROW][C]116.521716840869[/C][/ROW]
[ROW][C]66.386515670467[/C][/ROW]
[ROW][C]46.9875974950216[/C][/ROW]
[ROW][C]-224.975341789912[/C][/ROW]
[ROW][C]-124.14721529566[/C][/ROW]
[ROW][C]-124.265709345918[/C][/ROW]
[ROW][C]88.7222523189723[/C][/ROW]
[ROW][C]-195.916292599706[/C][/ROW]
[ROW][C]31.8221664015193[/C][/ROW]
[ROW][C]-69.4990387957983[/C][/ROW]
[ROW][C]27.2322214430732[/C][/ROW]
[ROW][C]49.3354334943038[/C][/ROW]
[ROW][C]-20.2939297520091[/C][/ROW]
[ROW][C]-43.8553626933965[/C][/ROW]
[ROW][C]106.518884632835[/C][/ROW]
[ROW][C]-115.127187506937[/C][/ROW]
[ROW][C]165.934672971035[/C][/ROW]
[ROW][C]-24.6022198410127[/C][/ROW]
[ROW][C]-114.453777192955[/C][/ROW]
[ROW][C]130.530400842804[/C][/ROW]
[ROW][C]178.849765746482[/C][/ROW]
[ROW][C]60.1824833520157[/C][/ROW]
[ROW][C]67.2023934638943[/C][/ROW]
[ROW][C]25.3610481021528[/C][/ROW]
[ROW][C]-134.573940261221[/C][/ROW]
[ROW][C]3.78111707179251[/C][/ROW]
[ROW][C]196.642389824587[/C][/ROW]
[/TABLE]
Source: https://freestatistics.org/blog/index.php?pk=302770&T=2

Globally Unique Identifier (entire table): ba.freestatistics.org/blog/index.php?pk=302770&T=2

As an alternative you can also use a QR Code:  

The GUIDs for individual cells are displayed in the table below:

Estimated ARIMA Residuals
Value
-6.72617378375217
59.5827130161505
8.66039418687275
-75.7845821525154
-46.2847161294621
86.0343689939946
3.12255623747963
-90.532127058776
80.5331522521716
-10.7930434833626
0.419244469943562
106.089364637785
99.3289744308422
116.521716840869
66.386515670467
46.9875974950216
-224.975341789912
-124.14721529566
-124.265709345918
88.7222523189723
-195.916292599706
31.8221664015193
-69.4990387957983
27.2322214430732
49.3354334943038
-20.2939297520091
-43.8553626933965
106.518884632835
-115.127187506937
165.934672971035
-24.6022198410127
-114.453777192955
130.530400842804
178.849765746482
60.1824833520157
67.2023934638943
25.3610481021528
-134.573940261221
3.78111707179251
196.642389824587


Parameters (Session):
par4 = 12 ;
Parameters (R input):
par1 = FALSE ; par2 = 1 ; par3 = 1 ; par4 = 1 ; par5 = 4 ; par6 = 3 ; par7 = 1 ; par8 = 2 ; par9 = 1 ;
R code (references can be found in the software module):
par9 <- '0'
par8 <- '2'
par7 <- '1'
par6 <- '1'
par5 <- '4'
par4 <- '1'
par3 <- '1'
par2 <- '1'
par1 <- 'FALSE'
library(lattice)
if (par1 == 'TRUE') par1 <- TRUE
if (par1 == 'FALSE') par1 <- FALSE
par2 <- as.numeric(par2) #Box-Cox lambda transformation parameter
par3 <- as.numeric(par3) #degree of non-seasonal differencing
par4 <- as.numeric(par4) #degree of seasonal differencing
par5 <- as.numeric(par5) #seasonal period
par6 <- as.numeric(par6) #degree (p) of the non-seasonal AR(p) polynomial
par7 <- as.numeric(par7) #degree (q) of the non-seasonal MA(q) polynomial
par8 <- as.numeric(par8) #degree (P) of the seasonal AR(P) polynomial
par9 <- as.numeric(par9) #degree (Q) of the seasonal MA(Q) polynomial
armaGR <- function(arima.out, names, n){
try1 <- arima.out$coef
try2 <- sqrt(diag(arima.out$var.coef))
try.data.frame <- data.frame(matrix(NA,ncol=4,nrow=length(names)))
dimnames(try.data.frame) <- list(names,c('coef','std','tstat','pv'))
try.data.frame[,1] <- try1
for(i in 1:length(try2)) try.data.frame[which(rownames(try.data.frame)==names(try2)[i]),2] <- try2[i]
try.data.frame[,3] <- try.data.frame[,1] / try.data.frame[,2]
try.data.frame[,4] <- round((1-pt(abs(try.data.frame[,3]),df=n-(length(try2)+1)))*2,5)
vector <- rep(NA,length(names))
vector[is.na(try.data.frame[,4])] <- 0
maxi <- which.max(try.data.frame[,4])
continue <- max(try.data.frame[,4],na.rm=TRUE) > .05
vector[maxi] <- 0
list(summary=try.data.frame,next.vector=vector,continue=continue)
}
arimaSelect <- function(series, order=c(13,0,0), seasonal=list(order=c(2,0,0),period=12), include.mean=F){
nrc <- order[1]+order[3]+seasonal$order[1]+seasonal$order[3]
coeff <- matrix(NA, nrow=nrc*2, ncol=nrc)
pval <- matrix(NA, nrow=nrc*2, ncol=nrc)
mylist <- rep(list(NULL), nrc)
names <- NULL
if(order[1] > 0) names <- paste('ar',1:order[1],sep='')
if(order[3] > 0) names <- c( names , paste('ma',1:order[3],sep='') )
if(seasonal$order[1] > 0) names <- c(names, paste('sar',1:seasonal$order[1],sep=''))
if(seasonal$order[3] > 0) names <- c(names, paste('sma',1:seasonal$order[3],sep=''))
arima.out <- arima(series, order=order, seasonal=seasonal, include.mean=include.mean, method='ML')
mylist[[1]] <- arima.out
last.arma <- armaGR(arima.out, names, length(series))
mystop <- FALSE
i <- 1
coeff[i,] <- last.arma[[1]][,1]
pval [i,] <- last.arma[[1]][,4]
i <- 2
aic <- arima.out$aic
while(!mystop){
mylist[[i]] <- arima.out
arima.out <- arima(series, order=order, seasonal=seasonal, include.mean=include.mean, method='ML', fixed=last.arma$next.vector)
aic <- c(aic, arima.out$aic)
last.arma <- armaGR(arima.out, names, length(series))
mystop <- !last.arma$continue
coeff[i,] <- last.arma[[1]][,1]
pval [i,] <- last.arma[[1]][,4]
i <- i+1
}
list(coeff, pval, mylist, aic=aic)
}
arimaSelectplot <- function(arimaSelect.out,noms,choix){
noms <- names(arimaSelect.out[[3]][[1]]$coef)
coeff <- arimaSelect.out[[1]]
k <- min(which(is.na(coeff[,1])))-1
coeff <- coeff[1:k,]
pval <- arimaSelect.out[[2]][1:k,]
aic <- arimaSelect.out$aic[1:k]
coeff[coeff==0] <- NA
n <- ncol(coeff)
if(missing(choix)) choix <- k
layout(matrix(c(1,1,1,2,
3,3,3,2,
3,3,3,4,
5,6,7,7),nr=4),
widths=c(10,35,45,15),
heights=c(30,30,15,15))
couleurs <- rainbow(75)[1:50]#(50)
ticks <- pretty(coeff)
par(mar=c(1,1,3,1))
plot(aic,k:1-.5,type='o',pch=21,bg='blue',cex=2,axes=F,lty=2,xpd=NA)
points(aic[choix],k-choix+.5,pch=21,cex=4,bg=2,xpd=NA)
title('aic',line=2)
par(mar=c(3,0,0,0))
plot(0,axes=F,xlab='',ylab='',xlim=range(ticks),ylim=c(.1,1))
rect(xleft = min(ticks) + (0:49)/50*(max(ticks)-min(ticks)),
xright = min(ticks) + (1:50)/50*(max(ticks)-min(ticks)),
ytop = rep(1,50),
ybottom= rep(0,50),col=couleurs,border=NA)
axis(1,ticks)
rect(xleft=min(ticks),xright=max(ticks),ytop=1,ybottom=0)
text(mean(coeff,na.rm=T),.5,'coefficients',cex=2,font=2)
par(mar=c(1,1,3,1))
image(1:n,1:k,t(coeff[k:1,]),axes=F,col=couleurs,zlim=range(ticks))
for(i in 1:n) for(j in 1:k) if(!is.na(coeff[j,i])) {
if(pval[j,i]<.01) symb = 'green'
else if( (pval[j,i]<.05) & (pval[j,i]>=.01)) symb = 'orange'
else if( (pval[j,i]<.1) & (pval[j,i]>=.05)) symb = 'red'
else symb = 'black'
polygon(c(i+.5 ,i+.2 ,i+.5 ,i+.5),
c(k-j+0.5,k-j+0.5,k-j+0.8,k-j+0.5),
col=symb)
if(j==choix) {
rect(xleft=i-.5,
xright=i+.5,
ybottom=k-j+1.5,
ytop=k-j+.5,
lwd=4)
text(i,
k-j+1,
round(coeff[j,i],2),
cex=1.2,
font=2)
}
else{
rect(xleft=i-.5,xright=i+.5,ybottom=k-j+1.5,ytop=k-j+.5)
text(i,k-j+1,round(coeff[j,i],2),cex=1.2,font=1)
}
}
axis(3,1:n,noms)
par(mar=c(0.5,0,0,0.5))
plot(0,axes=F,xlab='',ylab='',type='n',xlim=c(0,8),ylim=c(-.2,.8))
cols <- c('green','orange','red','black')
niv <- c('0','0.01','0.05','0.1')
for(i in 0:3){
polygon(c(1+2*i ,1+2*i ,1+2*i-.5 ,1+2*i),
c(.4 ,.7 , .4 , .4),
col=cols[i+1])
text(2*i,0.5,niv[i+1],cex=1.5)
}
text(8,.5,1,cex=1.5)
text(4,0,'p-value',cex=2)
box()
residus <- arimaSelect.out[[3]][[choix]]$res
par(mar=c(1,2,4,1))
acf(residus,main='')
title('acf',line=.5)
par(mar=c(1,2,4,1))
pacf(residus,main='')
title('pacf',line=.5)
par(mar=c(2,2,4,1))
qqnorm(residus,main='')
title('qq-norm',line=.5)
qqline(residus)
residus
}
if (par2 == 0) x <- log(x)
if (par2 != 0) x <- x^par2
(selection <- arimaSelect(x, order=c(par6,par3,par7), seasonal=list(order=c(par8,par4,par9), period=par5)))
bitmap(file='test1.png')
resid <- arimaSelectplot(selection)
dev.off()
resid
bitmap(file='test2.png')
acf(resid,length(resid)/2, main='Residual Autocorrelation Function')
dev.off()
bitmap(file='test3.png')
pacf(resid,length(resid)/2, main='Residual Partial Autocorrelation Function')
dev.off()
bitmap(file='test4.png')
cpgram(resid, main='Residual Cumulative Periodogram')
dev.off()
bitmap(file='test5.png')
hist(resid, main='Residual Histogram', xlab='values of Residuals')
dev.off()
bitmap(file='test6.png')
densityplot(~resid,col='black',main='Residual Density Plot', xlab='values of Residuals')
dev.off()
bitmap(file='test7.png')
qqnorm(resid, main='Residual Normal Q-Q Plot')
qqline(resid)
dev.off()
ncols <- length(selection[[1]][1,])
nrows <- length(selection[[2]][,1])-1
load(file='createtable')
a<-table.start()
a<-table.row.start(a)
a<-table.element(a,'ARIMA Parameter Estimation and Backward Selection', ncols+1,TRUE)
a<-table.row.end(a)
a<-table.row.start(a)
a<-table.element(a,'Iteration', header=TRUE)
for (i in 1:ncols) {
a<-table.element(a,names(selection[[3]][[1]]$coef)[i],header=TRUE)
}
a<-table.row.end(a)
for (j in 1:nrows) {
a<-table.row.start(a)
mydum <- 'Estimates ('
mydum <- paste(mydum,j)
mydum <- paste(mydum,')')
a<-table.element(a,mydum, header=TRUE)
for (i in 1:ncols) {
a<-table.element(a,round(selection[[1]][j,i],4))
}
a<-table.row.end(a)
a<-table.row.start(a)
a<-table.element(a,'(p-val)', header=TRUE)
for (i in 1:ncols) {
mydum <- '('
mydum <- paste(mydum,round(selection[[2]][j,i],4),sep='')
mydum <- paste(mydum,')')
a<-table.element(a,mydum)
}
a<-table.row.end(a)
}
a<-table.end(a)
table.save(a,file='mytable.tab')
a<-table.start()
a<-table.row.start(a)
a<-table.element(a,'Estimated ARIMA Residuals', 1,TRUE)
a<-table.row.end(a)
a<-table.row.start(a)
a<-table.element(a,'Value', 1,TRUE)
a<-table.row.end(a)
for (i in (par4*par5+par3):length(resid)) {
a<-table.row.start(a)
a<-table.element(a,resid[i])
a<-table.row.end(a)
}
a<-table.end(a)
table.save(a,file='mytable1.tab')