Free Statistics

of Irreproducible Research!

Author's title

Author*The author of this computation has been verified*
R Software Modulerwasp_arimabackwardselection.wasp
Title produced by softwareARIMA Backward Selection
Date of computationFri, 23 Dec 2016 09:09:07 +0100
Cite this page as followsStatistical Computations at FreeStatistics.org, Office for Research Development and Education, URL https://freestatistics.org/blog/index.php?v=date/2016/Dec/23/t1482480582sq48rpo0on0kwfc.htm/, Retrieved Tue, 07 May 2024 14:04:06 +0000
Statistical Computations at FreeStatistics.org, Office for Research Development and Education, URL https://freestatistics.org/blog/index.php?pk=302773, Retrieved Tue, 07 May 2024 14:04:06 +0000
QR Codes:

Original text written by user:
IsPrivate?No (this computation is public)
User-defined keywords
Estimated Impact111
Family? (F = Feedback message, R = changed R code, M = changed R Module, P = changed Parameters, D = changed Data)
-     [ARIMA Backward Selection] [Forcast: ARIMA ] [2016-12-16 12:58:19] [5d300c3f2919dcb76af3d6c83a609189]
- R P     [ARIMA Backward Selection] [zonder] [2016-12-23 08:09:07] [111362aa4cdbe055231fbc5cb9e916c4] [Current]
-   P       [ARIMA Backward Selection] [met] [2016-12-23 08:10:43] [5d300c3f2919dcb76af3d6c83a609189]
Feedback Forum

Post a new message
Dataseries X:
4030
4320
4840
4410
4180
4240
3680
4270
4140
4470
4180
4510
4490
3960
3750
3670
3590
2840
3530
4320
3740
3710
3830
3490
4200
4280
4650
2100
2410
1230
2420
2360
1870
2250
1960
2550
3180
3330
3760
3930
3710
3250
3450
3480
3090
3690
3250
3300
4040
3630
3820
3400
2500
2380
2520
2340
2420
2430
2080
2420
2430
2400
2790
2370
2700
2640
2910
2420
2800
2830
2310
2540
2780
2820
3610
3270
3030
3250
3040
3630
3320
3440
3110
3180
3330
3100
3440
3320
3380
3610
3320
3860
3430
3510
3290
3010
3860
3530
3610
3370
3700
3500
4110
4590
3680
4220
3740
3550
4150
4110
4160
3780
3150
3260
4750
4110
3610
3890
2800
2610
3600
3400
3400
3120
3150
3240


Summary of computational transaction
Raw Input view raw input (R code)
Raw Outputview raw output of R engine
Computing time3 seconds
R ServerBig Analytics Cloud Computing Center

\begin{tabular}{lllllllll}
\hline
Summary of computational transaction \tabularnewline
Raw Input view raw input (R code)  \tabularnewline
Raw Outputview raw output of R engine  \tabularnewline
Computing time3 seconds \tabularnewline
R ServerBig Analytics Cloud Computing Center \tabularnewline
\hline
\end{tabular}
%Source: https://freestatistics.org/blog/index.php?pk=302773&T=0

[TABLE]
[ROW]
Summary of computational transaction[/C][/ROW] [ROW]Raw Input[/C] view raw input (R code) [/C][/ROW] [ROW]Raw Output[/C]view raw output of R engine [/C][/ROW] [ROW]Computing time[/C]3 seconds[/C][/ROW] [ROW]R Server[/C]Big Analytics Cloud Computing Center[/C][/ROW] [/TABLE] Source: https://freestatistics.org/blog/index.php?pk=302773&T=0

Globally Unique Identifier (entire table): ba.freestatistics.org/blog/index.php?pk=302773&T=0

As an alternative you can also use a QR Code:  

The GUIDs for individual cells are displayed in the table below:

Summary of computational transaction
Raw Input view raw input (R code)
Raw Outputview raw output of R engine
Computing time3 seconds
R ServerBig Analytics Cloud Computing Center


ARIMA Parameter Estimation and Backward Selection
Iterationar1ar2ar3ma1sar1sar2sma1
Estimates ( 1 )0.3465-0.0712-0.28670.1174-0.9557-0.49520.1174
(p-val)(0.3291 )(0.7956 )(0.1374 )(0.7967 )(0 )(9e-04 )(0.7967 )
Estimates ( 2 )0.3904-0.0965-0.26780-0.9505-0.47950.1857
(p-val)(0.3239 )(0.7719 )(0.2288 )(NA )(0 )(8e-04 )(0.6611 )
Estimates ( 3 )0.28510-0.32290-0.9483-0.5060.2869
(p-val)(0.0847 )(NA )(6e-04 )(NA )(0 )(0 )(0.3681 )
Estimates ( 4 )0.38950-0.31030-0.7799-0.43170
(p-val)(3e-04 )(NA )(5e-04 )(NA )(0 )(1e-04 )(NA )
Estimates ( 5 )NANANANANANANA
(p-val)(NA )(NA )(NA )(NA )(NA )(NA )(NA )
Estimates ( 6 )NANANANANANANA
(p-val)(NA )(NA )(NA )(NA )(NA )(NA )(NA )
Estimates ( 7 )NANANANANANANA
(p-val)(NA )(NA )(NA )(NA )(NA )(NA )(NA )
Estimates ( 8 )NANANANANANANA
(p-val)(NA )(NA )(NA )(NA )(NA )(NA )(NA )
Estimates ( 9 )NANANANANANANA
(p-val)(NA )(NA )(NA )(NA )(NA )(NA )(NA )
Estimates ( 10 )NANANANANANANA
(p-val)(NA )(NA )(NA )(NA )(NA )(NA )(NA )
Estimates ( 11 )NANANANANANANA
(p-val)(NA )(NA )(NA )(NA )(NA )(NA )(NA )
Estimates ( 12 )NANANANANANANA
(p-val)(NA )(NA )(NA )(NA )(NA )(NA )(NA )
Estimates ( 13 )NANANANANANANA
(p-val)(NA )(NA )(NA )(NA )(NA )(NA )(NA )

\begin{tabular}{lllllllll}
\hline
ARIMA Parameter Estimation and Backward Selection \tabularnewline
Iteration & ar1 & ar2 & ar3 & ma1 & sar1 & sar2 & sma1 \tabularnewline
Estimates ( 1 ) & 0.3465 & -0.0712 & -0.2867 & 0.1174 & -0.9557 & -0.4952 & 0.1174 \tabularnewline
(p-val) & (0.3291 ) & (0.7956 ) & (0.1374 ) & (0.7967 ) & (0 ) & (9e-04 ) & (0.7967 ) \tabularnewline
Estimates ( 2 ) & 0.3904 & -0.0965 & -0.2678 & 0 & -0.9505 & -0.4795 & 0.1857 \tabularnewline
(p-val) & (0.3239 ) & (0.7719 ) & (0.2288 ) & (NA ) & (0 ) & (8e-04 ) & (0.6611 ) \tabularnewline
Estimates ( 3 ) & 0.2851 & 0 & -0.3229 & 0 & -0.9483 & -0.506 & 0.2869 \tabularnewline
(p-val) & (0.0847 ) & (NA ) & (6e-04 ) & (NA ) & (0 ) & (0 ) & (0.3681 ) \tabularnewline
Estimates ( 4 ) & 0.3895 & 0 & -0.3103 & 0 & -0.7799 & -0.4317 & 0 \tabularnewline
(p-val) & (3e-04 ) & (NA ) & (5e-04 ) & (NA ) & (0 ) & (1e-04 ) & (NA ) \tabularnewline
Estimates ( 5 ) & NA & NA & NA & NA & NA & NA & NA \tabularnewline
(p-val) & (NA ) & (NA ) & (NA ) & (NA ) & (NA ) & (NA ) & (NA ) \tabularnewline
Estimates ( 6 ) & NA & NA & NA & NA & NA & NA & NA \tabularnewline
(p-val) & (NA ) & (NA ) & (NA ) & (NA ) & (NA ) & (NA ) & (NA ) \tabularnewline
Estimates ( 7 ) & NA & NA & NA & NA & NA & NA & NA \tabularnewline
(p-val) & (NA ) & (NA ) & (NA ) & (NA ) & (NA ) & (NA ) & (NA ) \tabularnewline
Estimates ( 8 ) & NA & NA & NA & NA & NA & NA & NA \tabularnewline
(p-val) & (NA ) & (NA ) & (NA ) & (NA ) & (NA ) & (NA ) & (NA ) \tabularnewline
Estimates ( 9 ) & NA & NA & NA & NA & NA & NA & NA \tabularnewline
(p-val) & (NA ) & (NA ) & (NA ) & (NA ) & (NA ) & (NA ) & (NA ) \tabularnewline
Estimates ( 10 ) & NA & NA & NA & NA & NA & NA & NA \tabularnewline
(p-val) & (NA ) & (NA ) & (NA ) & (NA ) & (NA ) & (NA ) & (NA ) \tabularnewline
Estimates ( 11 ) & NA & NA & NA & NA & NA & NA & NA \tabularnewline
(p-val) & (NA ) & (NA ) & (NA ) & (NA ) & (NA ) & (NA ) & (NA ) \tabularnewline
Estimates ( 12 ) & NA & NA & NA & NA & NA & NA & NA \tabularnewline
(p-val) & (NA ) & (NA ) & (NA ) & (NA ) & (NA ) & (NA ) & (NA ) \tabularnewline
Estimates ( 13 ) & NA & NA & NA & NA & NA & NA & NA \tabularnewline
(p-val) & (NA ) & (NA ) & (NA ) & (NA ) & (NA ) & (NA ) & (NA ) \tabularnewline
\hline
\end{tabular}
%Source: https://freestatistics.org/blog/index.php?pk=302773&T=1

[TABLE]
[ROW][C]ARIMA Parameter Estimation and Backward Selection[/C][/ROW]
[ROW][C]Iteration[/C][C]ar1[/C][C]ar2[/C][C]ar3[/C][C]ma1[/C][C]sar1[/C][C]sar2[/C][C]sma1[/C][/ROW]
[ROW][C]Estimates ( 1 )[/C][C]0.3465[/C][C]-0.0712[/C][C]-0.2867[/C][C]0.1174[/C][C]-0.9557[/C][C]-0.4952[/C][C]0.1174[/C][/ROW]
[ROW][C](p-val)[/C][C](0.3291 )[/C][C](0.7956 )[/C][C](0.1374 )[/C][C](0.7967 )[/C][C](0 )[/C][C](9e-04 )[/C][C](0.7967 )[/C][/ROW]
[ROW][C]Estimates ( 2 )[/C][C]0.3904[/C][C]-0.0965[/C][C]-0.2678[/C][C]0[/C][C]-0.9505[/C][C]-0.4795[/C][C]0.1857[/C][/ROW]
[ROW][C](p-val)[/C][C](0.3239 )[/C][C](0.7719 )[/C][C](0.2288 )[/C][C](NA )[/C][C](0 )[/C][C](8e-04 )[/C][C](0.6611 )[/C][/ROW]
[ROW][C]Estimates ( 3 )[/C][C]0.2851[/C][C]0[/C][C]-0.3229[/C][C]0[/C][C]-0.9483[/C][C]-0.506[/C][C]0.2869[/C][/ROW]
[ROW][C](p-val)[/C][C](0.0847 )[/C][C](NA )[/C][C](6e-04 )[/C][C](NA )[/C][C](0 )[/C][C](0 )[/C][C](0.3681 )[/C][/ROW]
[ROW][C]Estimates ( 4 )[/C][C]0.3895[/C][C]0[/C][C]-0.3103[/C][C]0[/C][C]-0.7799[/C][C]-0.4317[/C][C]0[/C][/ROW]
[ROW][C](p-val)[/C][C](3e-04 )[/C][C](NA )[/C][C](5e-04 )[/C][C](NA )[/C][C](0 )[/C][C](1e-04 )[/C][C](NA )[/C][/ROW]
[ROW][C]Estimates ( 5 )[/C][C]NA[/C][C]NA[/C][C]NA[/C][C]NA[/C][C]NA[/C][C]NA[/C][C]NA[/C][/ROW]
[ROW][C](p-val)[/C][C](NA )[/C][C](NA )[/C][C](NA )[/C][C](NA )[/C][C](NA )[/C][C](NA )[/C][C](NA )[/C][/ROW]
[ROW][C]Estimates ( 6 )[/C][C]NA[/C][C]NA[/C][C]NA[/C][C]NA[/C][C]NA[/C][C]NA[/C][C]NA[/C][/ROW]
[ROW][C](p-val)[/C][C](NA )[/C][C](NA )[/C][C](NA )[/C][C](NA )[/C][C](NA )[/C][C](NA )[/C][C](NA )[/C][/ROW]
[ROW][C]Estimates ( 7 )[/C][C]NA[/C][C]NA[/C][C]NA[/C][C]NA[/C][C]NA[/C][C]NA[/C][C]NA[/C][/ROW]
[ROW][C](p-val)[/C][C](NA )[/C][C](NA )[/C][C](NA )[/C][C](NA )[/C][C](NA )[/C][C](NA )[/C][C](NA )[/C][/ROW]
[ROW][C]Estimates ( 8 )[/C][C]NA[/C][C]NA[/C][C]NA[/C][C]NA[/C][C]NA[/C][C]NA[/C][C]NA[/C][/ROW]
[ROW][C](p-val)[/C][C](NA )[/C][C](NA )[/C][C](NA )[/C][C](NA )[/C][C](NA )[/C][C](NA )[/C][C](NA )[/C][/ROW]
[ROW][C]Estimates ( 9 )[/C][C]NA[/C][C]NA[/C][C]NA[/C][C]NA[/C][C]NA[/C][C]NA[/C][C]NA[/C][/ROW]
[ROW][C](p-val)[/C][C](NA )[/C][C](NA )[/C][C](NA )[/C][C](NA )[/C][C](NA )[/C][C](NA )[/C][C](NA )[/C][/ROW]
[ROW][C]Estimates ( 10 )[/C][C]NA[/C][C]NA[/C][C]NA[/C][C]NA[/C][C]NA[/C][C]NA[/C][C]NA[/C][/ROW]
[ROW][C](p-val)[/C][C](NA )[/C][C](NA )[/C][C](NA )[/C][C](NA )[/C][C](NA )[/C][C](NA )[/C][C](NA )[/C][/ROW]
[ROW][C]Estimates ( 11 )[/C][C]NA[/C][C]NA[/C][C]NA[/C][C]NA[/C][C]NA[/C][C]NA[/C][C]NA[/C][/ROW]
[ROW][C](p-val)[/C][C](NA )[/C][C](NA )[/C][C](NA )[/C][C](NA )[/C][C](NA )[/C][C](NA )[/C][C](NA )[/C][/ROW]
[ROW][C]Estimates ( 12 )[/C][C]NA[/C][C]NA[/C][C]NA[/C][C]NA[/C][C]NA[/C][C]NA[/C][C]NA[/C][/ROW]
[ROW][C](p-val)[/C][C](NA )[/C][C](NA )[/C][C](NA )[/C][C](NA )[/C][C](NA )[/C][C](NA )[/C][C](NA )[/C][/ROW]
[ROW][C]Estimates ( 13 )[/C][C]NA[/C][C]NA[/C][C]NA[/C][C]NA[/C][C]NA[/C][C]NA[/C][C]NA[/C][/ROW]
[ROW][C](p-val)[/C][C](NA )[/C][C](NA )[/C][C](NA )[/C][C](NA )[/C][C](NA )[/C][C](NA )[/C][C](NA )[/C][/ROW]
[/TABLE]
Source: https://freestatistics.org/blog/index.php?pk=302773&T=1

Globally Unique Identifier (entire table): ba.freestatistics.org/blog/index.php?pk=302773&T=1

As an alternative you can also use a QR Code:  

The GUIDs for individual cells are displayed in the table below:

ARIMA Parameter Estimation and Backward Selection
Iterationar1ar2ar3ma1sar1sar2sma1
Estimates ( 1 )0.3465-0.0712-0.28670.1174-0.9557-0.49520.1174
(p-val)(0.3291 )(0.7956 )(0.1374 )(0.7967 )(0 )(9e-04 )(0.7967 )
Estimates ( 2 )0.3904-0.0965-0.26780-0.9505-0.47950.1857
(p-val)(0.3239 )(0.7719 )(0.2288 )(NA )(0 )(8e-04 )(0.6611 )
Estimates ( 3 )0.28510-0.32290-0.9483-0.5060.2869
(p-val)(0.0847 )(NA )(6e-04 )(NA )(0 )(0 )(0.3681 )
Estimates ( 4 )0.38950-0.31030-0.7799-0.43170
(p-val)(3e-04 )(NA )(5e-04 )(NA )(0 )(1e-04 )(NA )
Estimates ( 5 )NANANANANANANA
(p-val)(NA )(NA )(NA )(NA )(NA )(NA )(NA )
Estimates ( 6 )NANANANANANANA
(p-val)(NA )(NA )(NA )(NA )(NA )(NA )(NA )
Estimates ( 7 )NANANANANANANA
(p-val)(NA )(NA )(NA )(NA )(NA )(NA )(NA )
Estimates ( 8 )NANANANANANANA
(p-val)(NA )(NA )(NA )(NA )(NA )(NA )(NA )
Estimates ( 9 )NANANANANANANA
(p-val)(NA )(NA )(NA )(NA )(NA )(NA )(NA )
Estimates ( 10 )NANANANANANANA
(p-val)(NA )(NA )(NA )(NA )(NA )(NA )(NA )
Estimates ( 11 )NANANANANANANA
(p-val)(NA )(NA )(NA )(NA )(NA )(NA )(NA )
Estimates ( 12 )NANANANANANANA
(p-val)(NA )(NA )(NA )(NA )(NA )(NA )(NA )
Estimates ( 13 )NANANANANANANA
(p-val)(NA )(NA )(NA )(NA )(NA )(NA )(NA )


Estimated ARIMA Residuals
Value
4.02999758702368
265.009290577654
588.551327966627
-221.761607371918
-301.702436724862
62.0865196722765
-462.141863712401
277.455253207943
-80.1933066719541
286.577543417989
-240.258523184119
350.293364239688
145.562752608285
-479.266294654623
-404.664922721048
-177.971302711665
-178.362613839843
-973.792916739343
287.932299920542
915.214091954431
-327.563962373038
-254.013110394179
266.16974350333
-92.8360975128467
485.520521796053
248.985777936066
490.031703164354
-2384.02149810376
-433.957705094881
-1244.17190832389
508.25408281099
-359.56238802447
-678.672005205533
137.49229731437
-32.0018858804392
584.891012131388
693.213868879513
492.478812815897
615.309659385138
559.807353255032
149.536257572518
-383.104057559824
139.514942030071
97.2332727441867
-472.628038731614
342.94233471437
-240.894792102513
-59.1377785101467
679.1127715573
-60.8548652106824
82.1252456992734
-338.546893102895
-875.149422732716
-535.504892510845
-81.842189057812
-350.257840992899
-271.519965811085
-60.2176522348577
-316.129705453801
182.968325373963
97.4124223428939
-17.5876956720062
332.704670311107
-215.147879930262
258.308810826267
47.9051143048518
333.709909296395
-426.746287566782
262.777739896469
174.948281566458
-475.413189865332
-9.46462099664495
314.393565071922
141.553594638562
719.235206068831
15.3754788631263
-165.562268039042
220.774004521343
3.7111192544744
483.579638681153
-196.643841154902
100.477809780659
-275.256129080456
49.3485720789822
127.413412273273
-223.421415645349
217.96586188019
-16.9128285924976
81.6583442402684
232.903802302031
-145.043376403962
472.987797899249
-236.034906268217
18.1905345499636
-228.245056081809
-300.42076547701
669.493371862078
-109.351226271129
-11.5162390244559
-231.239291246809
411.587023374513
-103.658734456225
512.56456262617
688.92377993611
-619.456371799289
328.909909462913
-190.800469252342
-242.296905585529
326.639324938484
150.400436871933
29.0081625063849
-394.004344516817
-611.680900776505
-127.184179328579
1391.89816525777
-245.906869283566
-738.162144680241
206.264057386774
-721.415410387183
-681.834052104401
595.135778943849
50.4450908909153
-235.785946541625
-318.887014350425
172.143581379264
95.0266697618958

\begin{tabular}{lllllllll}
\hline
Estimated ARIMA Residuals \tabularnewline
Value \tabularnewline
4.02999758702368 \tabularnewline
265.009290577654 \tabularnewline
588.551327966627 \tabularnewline
-221.761607371918 \tabularnewline
-301.702436724862 \tabularnewline
62.0865196722765 \tabularnewline
-462.141863712401 \tabularnewline
277.455253207943 \tabularnewline
-80.1933066719541 \tabularnewline
286.577543417989 \tabularnewline
-240.258523184119 \tabularnewline
350.293364239688 \tabularnewline
145.562752608285 \tabularnewline
-479.266294654623 \tabularnewline
-404.664922721048 \tabularnewline
-177.971302711665 \tabularnewline
-178.362613839843 \tabularnewline
-973.792916739343 \tabularnewline
287.932299920542 \tabularnewline
915.214091954431 \tabularnewline
-327.563962373038 \tabularnewline
-254.013110394179 \tabularnewline
266.16974350333 \tabularnewline
-92.8360975128467 \tabularnewline
485.520521796053 \tabularnewline
248.985777936066 \tabularnewline
490.031703164354 \tabularnewline
-2384.02149810376 \tabularnewline
-433.957705094881 \tabularnewline
-1244.17190832389 \tabularnewline
508.25408281099 \tabularnewline
-359.56238802447 \tabularnewline
-678.672005205533 \tabularnewline
137.49229731437 \tabularnewline
-32.0018858804392 \tabularnewline
584.891012131388 \tabularnewline
693.213868879513 \tabularnewline
492.478812815897 \tabularnewline
615.309659385138 \tabularnewline
559.807353255032 \tabularnewline
149.536257572518 \tabularnewline
-383.104057559824 \tabularnewline
139.514942030071 \tabularnewline
97.2332727441867 \tabularnewline
-472.628038731614 \tabularnewline
342.94233471437 \tabularnewline
-240.894792102513 \tabularnewline
-59.1377785101467 \tabularnewline
679.1127715573 \tabularnewline
-60.8548652106824 \tabularnewline
82.1252456992734 \tabularnewline
-338.546893102895 \tabularnewline
-875.149422732716 \tabularnewline
-535.504892510845 \tabularnewline
-81.842189057812 \tabularnewline
-350.257840992899 \tabularnewline
-271.519965811085 \tabularnewline
-60.2176522348577 \tabularnewline
-316.129705453801 \tabularnewline
182.968325373963 \tabularnewline
97.4124223428939 \tabularnewline
-17.5876956720062 \tabularnewline
332.704670311107 \tabularnewline
-215.147879930262 \tabularnewline
258.308810826267 \tabularnewline
47.9051143048518 \tabularnewline
333.709909296395 \tabularnewline
-426.746287566782 \tabularnewline
262.777739896469 \tabularnewline
174.948281566458 \tabularnewline
-475.413189865332 \tabularnewline
-9.46462099664495 \tabularnewline
314.393565071922 \tabularnewline
141.553594638562 \tabularnewline
719.235206068831 \tabularnewline
15.3754788631263 \tabularnewline
-165.562268039042 \tabularnewline
220.774004521343 \tabularnewline
3.7111192544744 \tabularnewline
483.579638681153 \tabularnewline
-196.643841154902 \tabularnewline
100.477809780659 \tabularnewline
-275.256129080456 \tabularnewline
49.3485720789822 \tabularnewline
127.413412273273 \tabularnewline
-223.421415645349 \tabularnewline
217.96586188019 \tabularnewline
-16.9128285924976 \tabularnewline
81.6583442402684 \tabularnewline
232.903802302031 \tabularnewline
-145.043376403962 \tabularnewline
472.987797899249 \tabularnewline
-236.034906268217 \tabularnewline
18.1905345499636 \tabularnewline
-228.245056081809 \tabularnewline
-300.42076547701 \tabularnewline
669.493371862078 \tabularnewline
-109.351226271129 \tabularnewline
-11.5162390244559 \tabularnewline
-231.239291246809 \tabularnewline
411.587023374513 \tabularnewline
-103.658734456225 \tabularnewline
512.56456262617 \tabularnewline
688.92377993611 \tabularnewline
-619.456371799289 \tabularnewline
328.909909462913 \tabularnewline
-190.800469252342 \tabularnewline
-242.296905585529 \tabularnewline
326.639324938484 \tabularnewline
150.400436871933 \tabularnewline
29.0081625063849 \tabularnewline
-394.004344516817 \tabularnewline
-611.680900776505 \tabularnewline
-127.184179328579 \tabularnewline
1391.89816525777 \tabularnewline
-245.906869283566 \tabularnewline
-738.162144680241 \tabularnewline
206.264057386774 \tabularnewline
-721.415410387183 \tabularnewline
-681.834052104401 \tabularnewline
595.135778943849 \tabularnewline
50.4450908909153 \tabularnewline
-235.785946541625 \tabularnewline
-318.887014350425 \tabularnewline
172.143581379264 \tabularnewline
95.0266697618958 \tabularnewline
\hline
\end{tabular}
%Source: https://freestatistics.org/blog/index.php?pk=302773&T=2

[TABLE]
[ROW][C]Estimated ARIMA Residuals[/C][/ROW]
[ROW][C]Value[/C][/ROW]
[ROW][C]4.02999758702368[/C][/ROW]
[ROW][C]265.009290577654[/C][/ROW]
[ROW][C]588.551327966627[/C][/ROW]
[ROW][C]-221.761607371918[/C][/ROW]
[ROW][C]-301.702436724862[/C][/ROW]
[ROW][C]62.0865196722765[/C][/ROW]
[ROW][C]-462.141863712401[/C][/ROW]
[ROW][C]277.455253207943[/C][/ROW]
[ROW][C]-80.1933066719541[/C][/ROW]
[ROW][C]286.577543417989[/C][/ROW]
[ROW][C]-240.258523184119[/C][/ROW]
[ROW][C]350.293364239688[/C][/ROW]
[ROW][C]145.562752608285[/C][/ROW]
[ROW][C]-479.266294654623[/C][/ROW]
[ROW][C]-404.664922721048[/C][/ROW]
[ROW][C]-177.971302711665[/C][/ROW]
[ROW][C]-178.362613839843[/C][/ROW]
[ROW][C]-973.792916739343[/C][/ROW]
[ROW][C]287.932299920542[/C][/ROW]
[ROW][C]915.214091954431[/C][/ROW]
[ROW][C]-327.563962373038[/C][/ROW]
[ROW][C]-254.013110394179[/C][/ROW]
[ROW][C]266.16974350333[/C][/ROW]
[ROW][C]-92.8360975128467[/C][/ROW]
[ROW][C]485.520521796053[/C][/ROW]
[ROW][C]248.985777936066[/C][/ROW]
[ROW][C]490.031703164354[/C][/ROW]
[ROW][C]-2384.02149810376[/C][/ROW]
[ROW][C]-433.957705094881[/C][/ROW]
[ROW][C]-1244.17190832389[/C][/ROW]
[ROW][C]508.25408281099[/C][/ROW]
[ROW][C]-359.56238802447[/C][/ROW]
[ROW][C]-678.672005205533[/C][/ROW]
[ROW][C]137.49229731437[/C][/ROW]
[ROW][C]-32.0018858804392[/C][/ROW]
[ROW][C]584.891012131388[/C][/ROW]
[ROW][C]693.213868879513[/C][/ROW]
[ROW][C]492.478812815897[/C][/ROW]
[ROW][C]615.309659385138[/C][/ROW]
[ROW][C]559.807353255032[/C][/ROW]
[ROW][C]149.536257572518[/C][/ROW]
[ROW][C]-383.104057559824[/C][/ROW]
[ROW][C]139.514942030071[/C][/ROW]
[ROW][C]97.2332727441867[/C][/ROW]
[ROW][C]-472.628038731614[/C][/ROW]
[ROW][C]342.94233471437[/C][/ROW]
[ROW][C]-240.894792102513[/C][/ROW]
[ROW][C]-59.1377785101467[/C][/ROW]
[ROW][C]679.1127715573[/C][/ROW]
[ROW][C]-60.8548652106824[/C][/ROW]
[ROW][C]82.1252456992734[/C][/ROW]
[ROW][C]-338.546893102895[/C][/ROW]
[ROW][C]-875.149422732716[/C][/ROW]
[ROW][C]-535.504892510845[/C][/ROW]
[ROW][C]-81.842189057812[/C][/ROW]
[ROW][C]-350.257840992899[/C][/ROW]
[ROW][C]-271.519965811085[/C][/ROW]
[ROW][C]-60.2176522348577[/C][/ROW]
[ROW][C]-316.129705453801[/C][/ROW]
[ROW][C]182.968325373963[/C][/ROW]
[ROW][C]97.4124223428939[/C][/ROW]
[ROW][C]-17.5876956720062[/C][/ROW]
[ROW][C]332.704670311107[/C][/ROW]
[ROW][C]-215.147879930262[/C][/ROW]
[ROW][C]258.308810826267[/C][/ROW]
[ROW][C]47.9051143048518[/C][/ROW]
[ROW][C]333.709909296395[/C][/ROW]
[ROW][C]-426.746287566782[/C][/ROW]
[ROW][C]262.777739896469[/C][/ROW]
[ROW][C]174.948281566458[/C][/ROW]
[ROW][C]-475.413189865332[/C][/ROW]
[ROW][C]-9.46462099664495[/C][/ROW]
[ROW][C]314.393565071922[/C][/ROW]
[ROW][C]141.553594638562[/C][/ROW]
[ROW][C]719.235206068831[/C][/ROW]
[ROW][C]15.3754788631263[/C][/ROW]
[ROW][C]-165.562268039042[/C][/ROW]
[ROW][C]220.774004521343[/C][/ROW]
[ROW][C]3.7111192544744[/C][/ROW]
[ROW][C]483.579638681153[/C][/ROW]
[ROW][C]-196.643841154902[/C][/ROW]
[ROW][C]100.477809780659[/C][/ROW]
[ROW][C]-275.256129080456[/C][/ROW]
[ROW][C]49.3485720789822[/C][/ROW]
[ROW][C]127.413412273273[/C][/ROW]
[ROW][C]-223.421415645349[/C][/ROW]
[ROW][C]217.96586188019[/C][/ROW]
[ROW][C]-16.9128285924976[/C][/ROW]
[ROW][C]81.6583442402684[/C][/ROW]
[ROW][C]232.903802302031[/C][/ROW]
[ROW][C]-145.043376403962[/C][/ROW]
[ROW][C]472.987797899249[/C][/ROW]
[ROW][C]-236.034906268217[/C][/ROW]
[ROW][C]18.1905345499636[/C][/ROW]
[ROW][C]-228.245056081809[/C][/ROW]
[ROW][C]-300.42076547701[/C][/ROW]
[ROW][C]669.493371862078[/C][/ROW]
[ROW][C]-109.351226271129[/C][/ROW]
[ROW][C]-11.5162390244559[/C][/ROW]
[ROW][C]-231.239291246809[/C][/ROW]
[ROW][C]411.587023374513[/C][/ROW]
[ROW][C]-103.658734456225[/C][/ROW]
[ROW][C]512.56456262617[/C][/ROW]
[ROW][C]688.92377993611[/C][/ROW]
[ROW][C]-619.456371799289[/C][/ROW]
[ROW][C]328.909909462913[/C][/ROW]
[ROW][C]-190.800469252342[/C][/ROW]
[ROW][C]-242.296905585529[/C][/ROW]
[ROW][C]326.639324938484[/C][/ROW]
[ROW][C]150.400436871933[/C][/ROW]
[ROW][C]29.0081625063849[/C][/ROW]
[ROW][C]-394.004344516817[/C][/ROW]
[ROW][C]-611.680900776505[/C][/ROW]
[ROW][C]-127.184179328579[/C][/ROW]
[ROW][C]1391.89816525777[/C][/ROW]
[ROW][C]-245.906869283566[/C][/ROW]
[ROW][C]-738.162144680241[/C][/ROW]
[ROW][C]206.264057386774[/C][/ROW]
[ROW][C]-721.415410387183[/C][/ROW]
[ROW][C]-681.834052104401[/C][/ROW]
[ROW][C]595.135778943849[/C][/ROW]
[ROW][C]50.4450908909153[/C][/ROW]
[ROW][C]-235.785946541625[/C][/ROW]
[ROW][C]-318.887014350425[/C][/ROW]
[ROW][C]172.143581379264[/C][/ROW]
[ROW][C]95.0266697618958[/C][/ROW]
[/TABLE]
Source: https://freestatistics.org/blog/index.php?pk=302773&T=2

Globally Unique Identifier (entire table): ba.freestatistics.org/blog/index.php?pk=302773&T=2

As an alternative you can also use a QR Code:  

The GUIDs for individual cells are displayed in the table below:

Estimated ARIMA Residuals
Value
4.02999758702368
265.009290577654
588.551327966627
-221.761607371918
-301.702436724862
62.0865196722765
-462.141863712401
277.455253207943
-80.1933066719541
286.577543417989
-240.258523184119
350.293364239688
145.562752608285
-479.266294654623
-404.664922721048
-177.971302711665
-178.362613839843
-973.792916739343
287.932299920542
915.214091954431
-327.563962373038
-254.013110394179
266.16974350333
-92.8360975128467
485.520521796053
248.985777936066
490.031703164354
-2384.02149810376
-433.957705094881
-1244.17190832389
508.25408281099
-359.56238802447
-678.672005205533
137.49229731437
-32.0018858804392
584.891012131388
693.213868879513
492.478812815897
615.309659385138
559.807353255032
149.536257572518
-383.104057559824
139.514942030071
97.2332727441867
-472.628038731614
342.94233471437
-240.894792102513
-59.1377785101467
679.1127715573
-60.8548652106824
82.1252456992734
-338.546893102895
-875.149422732716
-535.504892510845
-81.842189057812
-350.257840992899
-271.519965811085
-60.2176522348577
-316.129705453801
182.968325373963
97.4124223428939
-17.5876956720062
332.704670311107
-215.147879930262
258.308810826267
47.9051143048518
333.709909296395
-426.746287566782
262.777739896469
174.948281566458
-475.413189865332
-9.46462099664495
314.393565071922
141.553594638562
719.235206068831
15.3754788631263
-165.562268039042
220.774004521343
3.7111192544744
483.579638681153
-196.643841154902
100.477809780659
-275.256129080456
49.3485720789822
127.413412273273
-223.421415645349
217.96586188019
-16.9128285924976
81.6583442402684
232.903802302031
-145.043376403962
472.987797899249
-236.034906268217
18.1905345499636
-228.245056081809
-300.42076547701
669.493371862078
-109.351226271129
-11.5162390244559
-231.239291246809
411.587023374513
-103.658734456225
512.56456262617
688.92377993611
-619.456371799289
328.909909462913
-190.800469252342
-242.296905585529
326.639324938484
150.400436871933
29.0081625063849
-394.004344516817
-611.680900776505
-127.184179328579
1391.89816525777
-245.906869283566
-738.162144680241
206.264057386774
-721.415410387183
-681.834052104401
595.135778943849
50.4450908909153
-235.785946541625
-318.887014350425
172.143581379264
95.0266697618958


Parameters (Session):
par1 = 12 ; par2 = 1 ; par3 = 1 ; par4 = 0 ; par5 = 1 ; par6 = 3 ; par7 = 1 ; par8 = 0 ; par9 = 0 ;
Parameters (R input):
par1 = 12 ; par2 = 1 ; par3 = 1 ; par4 = 0 ; par5 = 1 ; par6 = 3 ; par7 = 1 ; par8 = 0 ; par9 = 0 ;
R code (references can be found in the software module):
par9 <- '1'
par8 <- '2'
par7 <- '1'
par6 <- '3'
par5 <- '1'
par4 <- '0'
par3 <- '1'
par2 <- '1'
par1 <- 'FALSE'
library(lattice)
if (par1 == 'TRUE') par1 <- TRUE
if (par1 == 'FALSE') par1 <- FALSE
par2 <- as.numeric(par2) #Box-Cox lambda transformation parameter
par3 <- as.numeric(par3) #degree of non-seasonal differencing
par4 <- as.numeric(par4) #degree of seasonal differencing
par5 <- as.numeric(par5) #seasonal period
par6 <- as.numeric(par6) #degree (p) of the non-seasonal AR(p) polynomial
par7 <- as.numeric(par7) #degree (q) of the non-seasonal MA(q) polynomial
par8 <- as.numeric(par8) #degree (P) of the seasonal AR(P) polynomial
par9 <- as.numeric(par9) #degree (Q) of the seasonal MA(Q) polynomial
armaGR <- function(arima.out, names, n){
try1 <- arima.out$coef
try2 <- sqrt(diag(arima.out$var.coef))
try.data.frame <- data.frame(matrix(NA,ncol=4,nrow=length(names)))
dimnames(try.data.frame) <- list(names,c('coef','std','tstat','pv'))
try.data.frame[,1] <- try1
for(i in 1:length(try2)) try.data.frame[which(rownames(try.data.frame)==names(try2)[i]),2] <- try2[i]
try.data.frame[,3] <- try.data.frame[,1] / try.data.frame[,2]
try.data.frame[,4] <- round((1-pt(abs(try.data.frame[,3]),df=n-(length(try2)+1)))*2,5)
vector <- rep(NA,length(names))
vector[is.na(try.data.frame[,4])] <- 0
maxi <- which.max(try.data.frame[,4])
continue <- max(try.data.frame[,4],na.rm=TRUE) > .05
vector[maxi] <- 0
list(summary=try.data.frame,next.vector=vector,continue=continue)
}
arimaSelect <- function(series, order=c(13,0,0), seasonal=list(order=c(2,0,0),period=12), include.mean=F){
nrc <- order[1]+order[3]+seasonal$order[1]+seasonal$order[3]
coeff <- matrix(NA, nrow=nrc*2, ncol=nrc)
pval <- matrix(NA, nrow=nrc*2, ncol=nrc)
mylist <- rep(list(NULL), nrc)
names <- NULL
if(order[1] > 0) names <- paste('ar',1:order[1],sep='')
if(order[3] > 0) names <- c( names , paste('ma',1:order[3],sep='') )
if(seasonal$order[1] > 0) names <- c(names, paste('sar',1:seasonal$order[1],sep=''))
if(seasonal$order[3] > 0) names <- c(names, paste('sma',1:seasonal$order[3],sep=''))
arima.out <- arima(series, order=order, seasonal=seasonal, include.mean=include.mean, method='ML')
mylist[[1]] <- arima.out
last.arma <- armaGR(arima.out, names, length(series))
mystop <- FALSE
i <- 1
coeff[i,] <- last.arma[[1]][,1]
pval [i,] <- last.arma[[1]][,4]
i <- 2
aic <- arima.out$aic
while(!mystop){
mylist[[i]] <- arima.out
arima.out <- arima(series, order=order, seasonal=seasonal, include.mean=include.mean, method='ML', fixed=last.arma$next.vector)
aic <- c(aic, arima.out$aic)
last.arma <- armaGR(arima.out, names, length(series))
mystop <- !last.arma$continue
coeff[i,] <- last.arma[[1]][,1]
pval [i,] <- last.arma[[1]][,4]
i <- i+1
}
list(coeff, pval, mylist, aic=aic)
}
arimaSelectplot <- function(arimaSelect.out,noms,choix){
noms <- names(arimaSelect.out[[3]][[1]]$coef)
coeff <- arimaSelect.out[[1]]
k <- min(which(is.na(coeff[,1])))-1
coeff <- coeff[1:k,]
pval <- arimaSelect.out[[2]][1:k,]
aic <- arimaSelect.out$aic[1:k]
coeff[coeff==0] <- NA
n <- ncol(coeff)
if(missing(choix)) choix <- k
layout(matrix(c(1,1,1,2,
3,3,3,2,
3,3,3,4,
5,6,7,7),nr=4),
widths=c(10,35,45,15),
heights=c(30,30,15,15))
couleurs <- rainbow(75)[1:50]#(50)
ticks <- pretty(coeff)
par(mar=c(1,1,3,1))
plot(aic,k:1-.5,type='o',pch=21,bg='blue',cex=2,axes=F,lty=2,xpd=NA)
points(aic[choix],k-choix+.5,pch=21,cex=4,bg=2,xpd=NA)
title('aic',line=2)
par(mar=c(3,0,0,0))
plot(0,axes=F,xlab='',ylab='',xlim=range(ticks),ylim=c(.1,1))
rect(xleft = min(ticks) + (0:49)/50*(max(ticks)-min(ticks)),
xright = min(ticks) + (1:50)/50*(max(ticks)-min(ticks)),
ytop = rep(1,50),
ybottom= rep(0,50),col=couleurs,border=NA)
axis(1,ticks)
rect(xleft=min(ticks),xright=max(ticks),ytop=1,ybottom=0)
text(mean(coeff,na.rm=T),.5,'coefficients',cex=2,font=2)
par(mar=c(1,1,3,1))
image(1:n,1:k,t(coeff[k:1,]),axes=F,col=couleurs,zlim=range(ticks))
for(i in 1:n) for(j in 1:k) if(!is.na(coeff[j,i])) {
if(pval[j,i]<.01) symb = 'green'
else if( (pval[j,i]<.05) & (pval[j,i]>=.01)) symb = 'orange'
else if( (pval[j,i]<.1) & (pval[j,i]>=.05)) symb = 'red'
else symb = 'black'
polygon(c(i+.5 ,i+.2 ,i+.5 ,i+.5),
c(k-j+0.5,k-j+0.5,k-j+0.8,k-j+0.5),
col=symb)
if(j==choix) {
rect(xleft=i-.5,
xright=i+.5,
ybottom=k-j+1.5,
ytop=k-j+.5,
lwd=4)
text(i,
k-j+1,
round(coeff[j,i],2),
cex=1.2,
font=2)
}
else{
rect(xleft=i-.5,xright=i+.5,ybottom=k-j+1.5,ytop=k-j+.5)
text(i,k-j+1,round(coeff[j,i],2),cex=1.2,font=1)
}
}
axis(3,1:n,noms)
par(mar=c(0.5,0,0,0.5))
plot(0,axes=F,xlab='',ylab='',type='n',xlim=c(0,8),ylim=c(-.2,.8))
cols <- c('green','orange','red','black')
niv <- c('0','0.01','0.05','0.1')
for(i in 0:3){
polygon(c(1+2*i ,1+2*i ,1+2*i-.5 ,1+2*i),
c(.4 ,.7 , .4 , .4),
col=cols[i+1])
text(2*i,0.5,niv[i+1],cex=1.5)
}
text(8,.5,1,cex=1.5)
text(4,0,'p-value',cex=2)
box()
residus <- arimaSelect.out[[3]][[choix]]$res
par(mar=c(1,2,4,1))
acf(residus,main='')
title('acf',line=.5)
par(mar=c(1,2,4,1))
pacf(residus,main='')
title('pacf',line=.5)
par(mar=c(2,2,4,1))
qqnorm(residus,main='')
title('qq-norm',line=.5)
qqline(residus)
residus
}
if (par2 == 0) x <- log(x)
if (par2 != 0) x <- x^par2
(selection <- arimaSelect(x, order=c(par6,par3,par7), seasonal=list(order=c(par8,par4,par9), period=par5)))
bitmap(file='test1.png')
resid <- arimaSelectplot(selection)
dev.off()
resid
bitmap(file='test2.png')
acf(resid,length(resid)/2, main='Residual Autocorrelation Function')
dev.off()
bitmap(file='test3.png')
pacf(resid,length(resid)/2, main='Residual Partial Autocorrelation Function')
dev.off()
bitmap(file='test4.png')
cpgram(resid, main='Residual Cumulative Periodogram')
dev.off()
bitmap(file='test5.png')
hist(resid, main='Residual Histogram', xlab='values of Residuals')
dev.off()
bitmap(file='test6.png')
densityplot(~resid,col='black',main='Residual Density Plot', xlab='values of Residuals')
dev.off()
bitmap(file='test7.png')
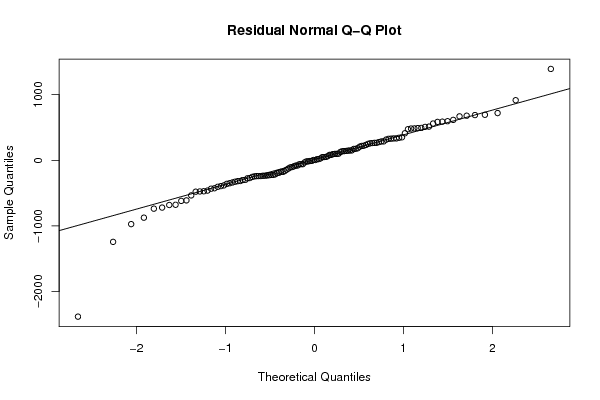
qqnorm(resid, main='Residual Normal Q-Q Plot')
qqline(resid)
dev.off()
ncols <- length(selection[[1]][1,])
nrows <- length(selection[[2]][,1])-1
load(file='createtable')
a<-table.start()
a<-table.row.start(a)
a<-table.element(a,'ARIMA Parameter Estimation and Backward Selection', ncols+1,TRUE)
a<-table.row.end(a)
a<-table.row.start(a)
a<-table.element(a,'Iteration', header=TRUE)
for (i in 1:ncols) {
a<-table.element(a,names(selection[[3]][[1]]$coef)[i],header=TRUE)
}
a<-table.row.end(a)
for (j in 1:nrows) {
a<-table.row.start(a)
mydum <- 'Estimates ('
mydum <- paste(mydum,j)
mydum <- paste(mydum,')')
a<-table.element(a,mydum, header=TRUE)
for (i in 1:ncols) {
a<-table.element(a,round(selection[[1]][j,i],4))
}
a<-table.row.end(a)
a<-table.row.start(a)
a<-table.element(a,'(p-val)', header=TRUE)
for (i in 1:ncols) {
mydum <- '('
mydum <- paste(mydum,round(selection[[2]][j,i],4),sep='')
mydum <- paste(mydum,')')
a<-table.element(a,mydum)
}
a<-table.row.end(a)
}
a<-table.end(a)
table.save(a,file='mytable.tab')
a<-table.start()
a<-table.row.start(a)
a<-table.element(a,'Estimated ARIMA Residuals', 1,TRUE)
a<-table.row.end(a)
a<-table.row.start(a)
a<-table.element(a,'Value', 1,TRUE)
a<-table.row.end(a)
for (i in (par4*par5+par3):length(resid)) {
a<-table.row.start(a)
a<-table.element(a,resid[i])
a<-table.row.end(a)
}
a<-table.end(a)
table.save(a,file='mytable1.tab')