Free Statistics

of Irreproducible Research!

Author's title

Author*The author of this computation has been verified*
R Software Modulerwasp_arimabackwardselection.wasp
Title produced by softwareARIMA Backward Selection
Date of computationFri, 23 Dec 2016 09:23:45 +0100
Cite this page as followsStatistical Computations at FreeStatistics.org, Office for Research Development and Education, URL https://freestatistics.org/blog/index.php?v=date/2016/Dec/23/t1482481519cmsrfacegua6uk5.htm/, Retrieved Tue, 07 May 2024 13:50:09 +0000
Statistical Computations at FreeStatistics.org, Office for Research Development and Education, URL https://freestatistics.org/blog/index.php?pk=302779, Retrieved Tue, 07 May 2024 13:50:09 +0000
QR Codes:

Original text written by user:
IsPrivate?No (this computation is public)
User-defined keywords
Estimated Impact96
Family? (F = Feedback message, R = changed R code, M = changed R Module, P = changed Parameters, D = changed Data)
-       [ARIMA Backward Selection] [] [2016-12-23 08:23:45] [0b5bf205c55efce49027552c8371b570] [Current]
Feedback Forum

Post a new message
Dataseries X:
3996.1
3984.2
4049
4032.8
4074.1
4114.4
4091.4
4166.6
4152.5
4112.7
4145.9
4174.4
4183.6
4172.5
4280.3
4327.4
4251.2
4256.5
4285.7
4257.4
4231.9
4274.3
4248.3
4310.5
4301.9
4336.5
4385.1
4310.4
4378.8
4338
4304.2
4266.9
4230.1
4230.6
4353.2
4371.2
4393.2
4250.2
4129.5
4124.9
4177.1
4156.9
4111.9
4167.4
4190.7
4165
4209.8
4250
4224.8
4322.7
4311.7
4373.8
4358.9
4441.2
4538.9
4444.8
4537.8
4490.2
4517.3
4561.9
4567
4588.3
4656.8
4677.7
4684.2
4752.8
4738.9
4785.6
4742.7
4711.4
4758.1
4800.5
4877.3
4885
4941.4
5009.4
5017.5
4984.1
4903.9
4968.6
4937.3
4987.1
5001.9
5094.6
5177.8
5206.1
5253.1
5284.3
5266.8
5225.1
5272.8
5529.8
5535.2
5715.9
5672.2
5475.7
5435.3
5458.5
5373.3
5395.3
5515
5410.9
5400.2
5424.2
5388.5
5482.1
5506.9
5377.2
5353.5
5401.1
5438.1
5510.2
5499
5606.5
5644
5440.7


Summary of computational transaction
Raw Input view raw input (R code)
Raw Outputview raw output of R engine
Computing time2 seconds
R ServerBig Analytics Cloud Computing Center

\begin{tabular}{lllllllll}
\hline
Summary of computational transaction \tabularnewline
Raw Input view raw input (R code)  \tabularnewline
Raw Outputview raw output of R engine  \tabularnewline
Computing time2 seconds \tabularnewline
R ServerBig Analytics Cloud Computing Center \tabularnewline
\hline
\end{tabular}
%Source: https://freestatistics.org/blog/index.php?pk=302779&T=0

[TABLE]
[ROW]
Summary of computational transaction[/C][/ROW] [ROW]Raw Input[/C] view raw input (R code) [/C][/ROW] [ROW]Raw Output[/C]view raw output of R engine [/C][/ROW] [ROW]Computing time[/C]2 seconds[/C][/ROW] [ROW]R Server[/C]Big Analytics Cloud Computing Center[/C][/ROW] [/TABLE] Source: https://freestatistics.org/blog/index.php?pk=302779&T=0

Globally Unique Identifier (entire table): ba.freestatistics.org/blog/index.php?pk=302779&T=0

As an alternative you can also use a QR Code:  

The GUIDs for individual cells are displayed in the table below:

Summary of computational transaction
Raw Input view raw input (R code)
Raw Outputview raw output of R engine
Computing time2 seconds
R ServerBig Analytics Cloud Computing Center


ARIMA Parameter Estimation and Backward Selection
Iterationar1ar2ar3ma1
Estimates ( 1 )-0.0318-0.08470.0575-1
(p-val)(0.7467 )(0.3884 )(0.5602 )(0 )
Estimates ( 2 )0-0.08350.0596-1
(p-val)(NA )(0.3953 )(0.5457 )(0 )
Estimates ( 3 )0-0.08590-1.0003
(p-val)(NA )(0.3817 )(NA )(0 )
Estimates ( 4 )000-1
(p-val)(NA )(NA )(NA )(0 )
Estimates ( 5 )NANANANA
(p-val)(NA )(NA )(NA )(NA )
Estimates ( 6 )NANANANA
(p-val)(NA )(NA )(NA )(NA )
Estimates ( 7 )NANANANA
(p-val)(NA )(NA )(NA )(NA )

\begin{tabular}{lllllllll}
\hline
ARIMA Parameter Estimation and Backward Selection \tabularnewline
Iteration & ar1 & ar2 & ar3 & ma1 \tabularnewline
Estimates ( 1 ) & -0.0318 & -0.0847 & 0.0575 & -1 \tabularnewline
(p-val) & (0.7467 ) & (0.3884 ) & (0.5602 ) & (0 ) \tabularnewline
Estimates ( 2 ) & 0 & -0.0835 & 0.0596 & -1 \tabularnewline
(p-val) & (NA ) & (0.3953 ) & (0.5457 ) & (0 ) \tabularnewline
Estimates ( 3 ) & 0 & -0.0859 & 0 & -1.0003 \tabularnewline
(p-val) & (NA ) & (0.3817 ) & (NA ) & (0 ) \tabularnewline
Estimates ( 4 ) & 0 & 0 & 0 & -1 \tabularnewline
(p-val) & (NA ) & (NA ) & (NA ) & (0 ) \tabularnewline
Estimates ( 5 ) & NA & NA & NA & NA \tabularnewline
(p-val) & (NA ) & (NA ) & (NA ) & (NA ) \tabularnewline
Estimates ( 6 ) & NA & NA & NA & NA \tabularnewline
(p-val) & (NA ) & (NA ) & (NA ) & (NA ) \tabularnewline
Estimates ( 7 ) & NA & NA & NA & NA \tabularnewline
(p-val) & (NA ) & (NA ) & (NA ) & (NA ) \tabularnewline
\hline
\end{tabular}
%Source: https://freestatistics.org/blog/index.php?pk=302779&T=1

[TABLE]
[ROW][C]ARIMA Parameter Estimation and Backward Selection[/C][/ROW]
[ROW][C]Iteration[/C][C]ar1[/C][C]ar2[/C][C]ar3[/C][C]ma1[/C][/ROW]
[ROW][C]Estimates ( 1 )[/C][C]-0.0318[/C][C]-0.0847[/C][C]0.0575[/C][C]-1[/C][/ROW]
[ROW][C](p-val)[/C][C](0.7467 )[/C][C](0.3884 )[/C][C](0.5602 )[/C][C](0 )[/C][/ROW]
[ROW][C]Estimates ( 2 )[/C][C]0[/C][C]-0.0835[/C][C]0.0596[/C][C]-1[/C][/ROW]
[ROW][C](p-val)[/C][C](NA )[/C][C](0.3953 )[/C][C](0.5457 )[/C][C](0 )[/C][/ROW]
[ROW][C]Estimates ( 3 )[/C][C]0[/C][C]-0.0859[/C][C]0[/C][C]-1.0003[/C][/ROW]
[ROW][C](p-val)[/C][C](NA )[/C][C](0.3817 )[/C][C](NA )[/C][C](0 )[/C][/ROW]
[ROW][C]Estimates ( 4 )[/C][C]0[/C][C]0[/C][C]0[/C][C]-1[/C][/ROW]
[ROW][C](p-val)[/C][C](NA )[/C][C](NA )[/C][C](NA )[/C][C](0 )[/C][/ROW]
[ROW][C]Estimates ( 5 )[/C][C]NA[/C][C]NA[/C][C]NA[/C][C]NA[/C][/ROW]
[ROW][C](p-val)[/C][C](NA )[/C][C](NA )[/C][C](NA )[/C][C](NA )[/C][/ROW]
[ROW][C]Estimates ( 6 )[/C][C]NA[/C][C]NA[/C][C]NA[/C][C]NA[/C][/ROW]
[ROW][C](p-val)[/C][C](NA )[/C][C](NA )[/C][C](NA )[/C][C](NA )[/C][/ROW]
[ROW][C]Estimates ( 7 )[/C][C]NA[/C][C]NA[/C][C]NA[/C][C]NA[/C][/ROW]
[ROW][C](p-val)[/C][C](NA )[/C][C](NA )[/C][C](NA )[/C][C](NA )[/C][/ROW]
[/TABLE]
Source: https://freestatistics.org/blog/index.php?pk=302779&T=1

Globally Unique Identifier (entire table): ba.freestatistics.org/blog/index.php?pk=302779&T=1

As an alternative you can also use a QR Code:  

The GUIDs for individual cells are displayed in the table below:

ARIMA Parameter Estimation and Backward Selection
Iterationar1ar2ar3ma1
Estimates ( 1 )-0.0318-0.08470.0575-1
(p-val)(0.7467 )(0.3884 )(0.5602 )(0 )
Estimates ( 2 )0-0.08350.0596-1
(p-val)(NA )(0.3953 )(0.5457 )(0 )
Estimates ( 3 )0-0.08590-1.0003
(p-val)(NA )(0.3817 )(NA )(0 )
Estimates ( 4 )000-1
(p-val)(NA )(NA )(NA )(0 )
Estimates ( 5 )NANANANA
(p-val)(NA )(NA )(NA )(NA )
Estimates ( 6 )NANANANA
(p-val)(NA )(NA )(NA )(NA )
Estimates ( 7 )NANANANA
(p-val)(NA )(NA )(NA )(NA )


Estimated ARIMA Residuals
Value
-5.38791818633079
54.0195128201588
-36.391289006286
30.0908490803972
15.7225154471649
-40.3152769029926
56.716815680551
-39.5651248658837
-50.951122824504
16.472324068
8.27564218678096
-4.92503229186922
-24.3882410616431
90.3270915831578
23.678679275143
-87.2927963220575
-7.93754359892682
5.45246215234935
-43.9721337638834
-36.9513347655571
26.2937664485533
-41.5088899650549
52.2864883791518
-24.9981406921354
25.7649119202832
32.5045005214085
-86.0499841329978
58.7703978445849
-60.9825354750429
-39.933209528724
-51.2745029536912
-48.5462724297314
-10.6131625478489
110.00737541765
6.87708828138172
20.9610692468881
-151.191253464062
-124.786160632737
-20.9265049853438
37.5707386981922
-25.0139228340884
-44.0855754146355
50.1190632369463
15.0280770873833
-25.2218821199862
42.3170130254993
32.6885203980009
-26.7167703868101
95.2602590051477
-20.0203211013795
63.2100390481114
-23.5267225413399
79.4018504868163
86.6126576071754
-96.7300069677498
91.7218883695001
-65.5705153730767
25.5422932948841
30.4816076318556
-2.83579282940268
14.7654610174566
57.9697120777003
11.2045829809416
0.763570270214814
58.3062169058648
-25.6744114167471
40.1418953023113
-56.4113098742501
-38.9045501793674
31.4478294112242
27.7197483498122
68.1358209704142
-1.78903430865333
49.5312626073445
54.4904796037578
-1.57562247325873
-41.7885596179553
-92.8490506294026
48.7555414283762
-51.2369135929856
42.352400144765
-1.14260402130175
83.2103324979673
69.780640295999
21.033221180306
38.5634345112
17.7224906036914
-29.2995005453818
-54.3762553310783
30.963853919297
236.669674117035
-8.48344871875125
183.812472818506
-62.819242717115
-199.150476685553
-60.963428884937
-10.1199366381414
-104.51038286812
8.62931576847626
96.4771570270662
-117.983792657469
-15.5420870696912
0.0128953288274896
-51.4096752681368
80.71342849556
6.37909115679989
-136.384701152911
-35.4991501987773
22.585751777059
20.888977658686
61.7304838991505
-22.6464319483975
98.7127733208762
21.0367827729136
-208.716232764762

\begin{tabular}{lllllllll}
\hline
Estimated ARIMA Residuals \tabularnewline
Value \tabularnewline
-5.38791818633079 \tabularnewline
54.0195128201588 \tabularnewline
-36.391289006286 \tabularnewline
30.0908490803972 \tabularnewline
15.7225154471649 \tabularnewline
-40.3152769029926 \tabularnewline
56.716815680551 \tabularnewline
-39.5651248658837 \tabularnewline
-50.951122824504 \tabularnewline
16.472324068 \tabularnewline
8.27564218678096 \tabularnewline
-4.92503229186922 \tabularnewline
-24.3882410616431 \tabularnewline
90.3270915831578 \tabularnewline
23.678679275143 \tabularnewline
-87.2927963220575 \tabularnewline
-7.93754359892682 \tabularnewline
5.45246215234935 \tabularnewline
-43.9721337638834 \tabularnewline
-36.9513347655571 \tabularnewline
26.2937664485533 \tabularnewline
-41.5088899650549 \tabularnewline
52.2864883791518 \tabularnewline
-24.9981406921354 \tabularnewline
25.7649119202832 \tabularnewline
32.5045005214085 \tabularnewline
-86.0499841329978 \tabularnewline
58.7703978445849 \tabularnewline
-60.9825354750429 \tabularnewline
-39.933209528724 \tabularnewline
-51.2745029536912 \tabularnewline
-48.5462724297314 \tabularnewline
-10.6131625478489 \tabularnewline
110.00737541765 \tabularnewline
6.87708828138172 \tabularnewline
20.9610692468881 \tabularnewline
-151.191253464062 \tabularnewline
-124.786160632737 \tabularnewline
-20.9265049853438 \tabularnewline
37.5707386981922 \tabularnewline
-25.0139228340884 \tabularnewline
-44.0855754146355 \tabularnewline
50.1190632369463 \tabularnewline
15.0280770873833 \tabularnewline
-25.2218821199862 \tabularnewline
42.3170130254993 \tabularnewline
32.6885203980009 \tabularnewline
-26.7167703868101 \tabularnewline
95.2602590051477 \tabularnewline
-20.0203211013795 \tabularnewline
63.2100390481114 \tabularnewline
-23.5267225413399 \tabularnewline
79.4018504868163 \tabularnewline
86.6126576071754 \tabularnewline
-96.7300069677498 \tabularnewline
91.7218883695001 \tabularnewline
-65.5705153730767 \tabularnewline
25.5422932948841 \tabularnewline
30.4816076318556 \tabularnewline
-2.83579282940268 \tabularnewline
14.7654610174566 \tabularnewline
57.9697120777003 \tabularnewline
11.2045829809416 \tabularnewline
0.763570270214814 \tabularnewline
58.3062169058648 \tabularnewline
-25.6744114167471 \tabularnewline
40.1418953023113 \tabularnewline
-56.4113098742501 \tabularnewline
-38.9045501793674 \tabularnewline
31.4478294112242 \tabularnewline
27.7197483498122 \tabularnewline
68.1358209704142 \tabularnewline
-1.78903430865333 \tabularnewline
49.5312626073445 \tabularnewline
54.4904796037578 \tabularnewline
-1.57562247325873 \tabularnewline
-41.7885596179553 \tabularnewline
-92.8490506294026 \tabularnewline
48.7555414283762 \tabularnewline
-51.2369135929856 \tabularnewline
42.352400144765 \tabularnewline
-1.14260402130175 \tabularnewline
83.2103324979673 \tabularnewline
69.780640295999 \tabularnewline
21.033221180306 \tabularnewline
38.5634345112 \tabularnewline
17.7224906036914 \tabularnewline
-29.2995005453818 \tabularnewline
-54.3762553310783 \tabularnewline
30.963853919297 \tabularnewline
236.669674117035 \tabularnewline
-8.48344871875125 \tabularnewline
183.812472818506 \tabularnewline
-62.819242717115 \tabularnewline
-199.150476685553 \tabularnewline
-60.963428884937 \tabularnewline
-10.1199366381414 \tabularnewline
-104.51038286812 \tabularnewline
8.62931576847626 \tabularnewline
96.4771570270662 \tabularnewline
-117.983792657469 \tabularnewline
-15.5420870696912 \tabularnewline
0.0128953288274896 \tabularnewline
-51.4096752681368 \tabularnewline
80.71342849556 \tabularnewline
6.37909115679989 \tabularnewline
-136.384701152911 \tabularnewline
-35.4991501987773 \tabularnewline
22.585751777059 \tabularnewline
20.888977658686 \tabularnewline
61.7304838991505 \tabularnewline
-22.6464319483975 \tabularnewline
98.7127733208762 \tabularnewline
21.0367827729136 \tabularnewline
-208.716232764762 \tabularnewline
\hline
\end{tabular}
%Source: https://freestatistics.org/blog/index.php?pk=302779&T=2

[TABLE]
[ROW][C]Estimated ARIMA Residuals[/C][/ROW]
[ROW][C]Value[/C][/ROW]
[ROW][C]-5.38791818633079[/C][/ROW]
[ROW][C]54.0195128201588[/C][/ROW]
[ROW][C]-36.391289006286[/C][/ROW]
[ROW][C]30.0908490803972[/C][/ROW]
[ROW][C]15.7225154471649[/C][/ROW]
[ROW][C]-40.3152769029926[/C][/ROW]
[ROW][C]56.716815680551[/C][/ROW]
[ROW][C]-39.5651248658837[/C][/ROW]
[ROW][C]-50.951122824504[/C][/ROW]
[ROW][C]16.472324068[/C][/ROW]
[ROW][C]8.27564218678096[/C][/ROW]
[ROW][C]-4.92503229186922[/C][/ROW]
[ROW][C]-24.3882410616431[/C][/ROW]
[ROW][C]90.3270915831578[/C][/ROW]
[ROW][C]23.678679275143[/C][/ROW]
[ROW][C]-87.2927963220575[/C][/ROW]
[ROW][C]-7.93754359892682[/C][/ROW]
[ROW][C]5.45246215234935[/C][/ROW]
[ROW][C]-43.9721337638834[/C][/ROW]
[ROW][C]-36.9513347655571[/C][/ROW]
[ROW][C]26.2937664485533[/C][/ROW]
[ROW][C]-41.5088899650549[/C][/ROW]
[ROW][C]52.2864883791518[/C][/ROW]
[ROW][C]-24.9981406921354[/C][/ROW]
[ROW][C]25.7649119202832[/C][/ROW]
[ROW][C]32.5045005214085[/C][/ROW]
[ROW][C]-86.0499841329978[/C][/ROW]
[ROW][C]58.7703978445849[/C][/ROW]
[ROW][C]-60.9825354750429[/C][/ROW]
[ROW][C]-39.933209528724[/C][/ROW]
[ROW][C]-51.2745029536912[/C][/ROW]
[ROW][C]-48.5462724297314[/C][/ROW]
[ROW][C]-10.6131625478489[/C][/ROW]
[ROW][C]110.00737541765[/C][/ROW]
[ROW][C]6.87708828138172[/C][/ROW]
[ROW][C]20.9610692468881[/C][/ROW]
[ROW][C]-151.191253464062[/C][/ROW]
[ROW][C]-124.786160632737[/C][/ROW]
[ROW][C]-20.9265049853438[/C][/ROW]
[ROW][C]37.5707386981922[/C][/ROW]
[ROW][C]-25.0139228340884[/C][/ROW]
[ROW][C]-44.0855754146355[/C][/ROW]
[ROW][C]50.1190632369463[/C][/ROW]
[ROW][C]15.0280770873833[/C][/ROW]
[ROW][C]-25.2218821199862[/C][/ROW]
[ROW][C]42.3170130254993[/C][/ROW]
[ROW][C]32.6885203980009[/C][/ROW]
[ROW][C]-26.7167703868101[/C][/ROW]
[ROW][C]95.2602590051477[/C][/ROW]
[ROW][C]-20.0203211013795[/C][/ROW]
[ROW][C]63.2100390481114[/C][/ROW]
[ROW][C]-23.5267225413399[/C][/ROW]
[ROW][C]79.4018504868163[/C][/ROW]
[ROW][C]86.6126576071754[/C][/ROW]
[ROW][C]-96.7300069677498[/C][/ROW]
[ROW][C]91.7218883695001[/C][/ROW]
[ROW][C]-65.5705153730767[/C][/ROW]
[ROW][C]25.5422932948841[/C][/ROW]
[ROW][C]30.4816076318556[/C][/ROW]
[ROW][C]-2.83579282940268[/C][/ROW]
[ROW][C]14.7654610174566[/C][/ROW]
[ROW][C]57.9697120777003[/C][/ROW]
[ROW][C]11.2045829809416[/C][/ROW]
[ROW][C]0.763570270214814[/C][/ROW]
[ROW][C]58.3062169058648[/C][/ROW]
[ROW][C]-25.6744114167471[/C][/ROW]
[ROW][C]40.1418953023113[/C][/ROW]
[ROW][C]-56.4113098742501[/C][/ROW]
[ROW][C]-38.9045501793674[/C][/ROW]
[ROW][C]31.4478294112242[/C][/ROW]
[ROW][C]27.7197483498122[/C][/ROW]
[ROW][C]68.1358209704142[/C][/ROW]
[ROW][C]-1.78903430865333[/C][/ROW]
[ROW][C]49.5312626073445[/C][/ROW]
[ROW][C]54.4904796037578[/C][/ROW]
[ROW][C]-1.57562247325873[/C][/ROW]
[ROW][C]-41.7885596179553[/C][/ROW]
[ROW][C]-92.8490506294026[/C][/ROW]
[ROW][C]48.7555414283762[/C][/ROW]
[ROW][C]-51.2369135929856[/C][/ROW]
[ROW][C]42.352400144765[/C][/ROW]
[ROW][C]-1.14260402130175[/C][/ROW]
[ROW][C]83.2103324979673[/C][/ROW]
[ROW][C]69.780640295999[/C][/ROW]
[ROW][C]21.033221180306[/C][/ROW]
[ROW][C]38.5634345112[/C][/ROW]
[ROW][C]17.7224906036914[/C][/ROW]
[ROW][C]-29.2995005453818[/C][/ROW]
[ROW][C]-54.3762553310783[/C][/ROW]
[ROW][C]30.963853919297[/C][/ROW]
[ROW][C]236.669674117035[/C][/ROW]
[ROW][C]-8.48344871875125[/C][/ROW]
[ROW][C]183.812472818506[/C][/ROW]
[ROW][C]-62.819242717115[/C][/ROW]
[ROW][C]-199.150476685553[/C][/ROW]
[ROW][C]-60.963428884937[/C][/ROW]
[ROW][C]-10.1199366381414[/C][/ROW]
[ROW][C]-104.51038286812[/C][/ROW]
[ROW][C]8.62931576847626[/C][/ROW]
[ROW][C]96.4771570270662[/C][/ROW]
[ROW][C]-117.983792657469[/C][/ROW]
[ROW][C]-15.5420870696912[/C][/ROW]
[ROW][C]0.0128953288274896[/C][/ROW]
[ROW][C]-51.4096752681368[/C][/ROW]
[ROW][C]80.71342849556[/C][/ROW]
[ROW][C]6.37909115679989[/C][/ROW]
[ROW][C]-136.384701152911[/C][/ROW]
[ROW][C]-35.4991501987773[/C][/ROW]
[ROW][C]22.585751777059[/C][/ROW]
[ROW][C]20.888977658686[/C][/ROW]
[ROW][C]61.7304838991505[/C][/ROW]
[ROW][C]-22.6464319483975[/C][/ROW]
[ROW][C]98.7127733208762[/C][/ROW]
[ROW][C]21.0367827729136[/C][/ROW]
[ROW][C]-208.716232764762[/C][/ROW]
[/TABLE]
Source: https://freestatistics.org/blog/index.php?pk=302779&T=2

Globally Unique Identifier (entire table): ba.freestatistics.org/blog/index.php?pk=302779&T=2

As an alternative you can also use a QR Code:  

The GUIDs for individual cells are displayed in the table below:

Estimated ARIMA Residuals
Value
-5.38791818633079
54.0195128201588
-36.391289006286
30.0908490803972
15.7225154471649
-40.3152769029926
56.716815680551
-39.5651248658837
-50.951122824504
16.472324068
8.27564218678096
-4.92503229186922
-24.3882410616431
90.3270915831578
23.678679275143
-87.2927963220575
-7.93754359892682
5.45246215234935
-43.9721337638834
-36.9513347655571
26.2937664485533
-41.5088899650549
52.2864883791518
-24.9981406921354
25.7649119202832
32.5045005214085
-86.0499841329978
58.7703978445849
-60.9825354750429
-39.933209528724
-51.2745029536912
-48.5462724297314
-10.6131625478489
110.00737541765
6.87708828138172
20.9610692468881
-151.191253464062
-124.786160632737
-20.9265049853438
37.5707386981922
-25.0139228340884
-44.0855754146355
50.1190632369463
15.0280770873833
-25.2218821199862
42.3170130254993
32.6885203980009
-26.7167703868101
95.2602590051477
-20.0203211013795
63.2100390481114
-23.5267225413399
79.4018504868163
86.6126576071754
-96.7300069677498
91.7218883695001
-65.5705153730767
25.5422932948841
30.4816076318556
-2.83579282940268
14.7654610174566
57.9697120777003
11.2045829809416
0.763570270214814
58.3062169058648
-25.6744114167471
40.1418953023113
-56.4113098742501
-38.9045501793674
31.4478294112242
27.7197483498122
68.1358209704142
-1.78903430865333
49.5312626073445
54.4904796037578
-1.57562247325873
-41.7885596179553
-92.8490506294026
48.7555414283762
-51.2369135929856
42.352400144765
-1.14260402130175
83.2103324979673
69.780640295999
21.033221180306
38.5634345112
17.7224906036914
-29.2995005453818
-54.3762553310783
30.963853919297
236.669674117035
-8.48344871875125
183.812472818506
-62.819242717115
-199.150476685553
-60.963428884937
-10.1199366381414
-104.51038286812
8.62931576847626
96.4771570270662
-117.983792657469
-15.5420870696912
0.0128953288274896
-51.4096752681368
80.71342849556
6.37909115679989
-136.384701152911
-35.4991501987773
22.585751777059
20.888977658686
61.7304838991505
-22.6464319483975
98.7127733208762
21.0367827729136
-208.716232764762


Parameters (Session):
par1 = FALSE ; par2 = 1 ; par3 = 2 ; par4 = 0 ; par5 = 1 ; par6 = 3 ; par7 = 1 ; par8 = 0 ; par9 = 0 ;
Parameters (R input):
par1 = FALSE ; par2 = 1 ; par3 = 2 ; par4 = 0 ; par5 = 1 ; par6 = 3 ; par7 = 1 ; par8 = 0 ; par9 = 0 ;
R code (references can be found in the software module):
library(lattice)
if (par1 == 'TRUE') par1 <- TRUE
if (par1 == 'FALSE') par1 <- FALSE
par2 <- as.numeric(par2) #Box-Cox lambda transformation parameter
par3 <- as.numeric(par3) #degree of non-seasonal differencing
par4 <- as.numeric(par4) #degree of seasonal differencing
par5 <- as.numeric(par5) #seasonal period
par6 <- as.numeric(par6) #degree (p) of the non-seasonal AR(p) polynomial
par7 <- as.numeric(par7) #degree (q) of the non-seasonal MA(q) polynomial
par8 <- as.numeric(par8) #degree (P) of the seasonal AR(P) polynomial
par9 <- as.numeric(par9) #degree (Q) of the seasonal MA(Q) polynomial
armaGR <- function(arima.out, names, n){
try1 <- arima.out$coef
try2 <- sqrt(diag(arima.out$var.coef))
try.data.frame <- data.frame(matrix(NA,ncol=4,nrow=length(names)))
dimnames(try.data.frame) <- list(names,c('coef','std','tstat','pv'))
try.data.frame[,1] <- try1
for(i in 1:length(try2)) try.data.frame[which(rownames(try.data.frame)==names(try2)[i]),2] <- try2[i]
try.data.frame[,3] <- try.data.frame[,1] / try.data.frame[,2]
try.data.frame[,4] <- round((1-pt(abs(try.data.frame[,3]),df=n-(length(try2)+1)))*2,5)
vector <- rep(NA,length(names))
vector[is.na(try.data.frame[,4])] <- 0
maxi <- which.max(try.data.frame[,4])
continue <- max(try.data.frame[,4],na.rm=TRUE) > .05
vector[maxi] <- 0
list(summary=try.data.frame,next.vector=vector,continue=continue)
}
arimaSelect <- function(series, order=c(13,0,0), seasonal=list(order=c(2,0,0),period=12), include.mean=F){
nrc <- order[1]+order[3]+seasonal$order[1]+seasonal$order[3]
coeff <- matrix(NA, nrow=nrc*2, ncol=nrc)
pval <- matrix(NA, nrow=nrc*2, ncol=nrc)
mylist <- rep(list(NULL), nrc)
names <- NULL
if(order[1] > 0) names <- paste('ar',1:order[1],sep='')
if(order[3] > 0) names <- c( names , paste('ma',1:order[3],sep='') )
if(seasonal$order[1] > 0) names <- c(names, paste('sar',1:seasonal$order[1],sep=''))
if(seasonal$order[3] > 0) names <- c(names, paste('sma',1:seasonal$order[3],sep=''))
arima.out <- arima(series, order=order, seasonal=seasonal, include.mean=include.mean, method='ML')
mylist[[1]] <- arima.out
last.arma <- armaGR(arima.out, names, length(series))
mystop <- FALSE
i <- 1
coeff[i,] <- last.arma[[1]][,1]
pval [i,] <- last.arma[[1]][,4]
i <- 2
aic <- arima.out$aic
while(!mystop){
mylist[[i]] <- arima.out
arima.out <- arima(series, order=order, seasonal=seasonal, include.mean=include.mean, method='ML', fixed=last.arma$next.vector)
aic <- c(aic, arima.out$aic)
last.arma <- armaGR(arima.out, names, length(series))
mystop <- !last.arma$continue
coeff[i,] <- last.arma[[1]][,1]
pval [i,] <- last.arma[[1]][,4]
i <- i+1
}
list(coeff, pval, mylist, aic=aic)
}
arimaSelectplot <- function(arimaSelect.out,noms,choix){
noms <- names(arimaSelect.out[[3]][[1]]$coef)
coeff <- arimaSelect.out[[1]]
k <- min(which(is.na(coeff[,1])))-1
coeff <- coeff[1:k,]
pval <- arimaSelect.out[[2]][1:k,]
aic <- arimaSelect.out$aic[1:k]
coeff[coeff==0] <- NA
n <- ncol(coeff)
if(missing(choix)) choix <- k
layout(matrix(c(1,1,1,2,
3,3,3,2,
3,3,3,4,
5,6,7,7),nr=4),
widths=c(10,35,45,15),
heights=c(30,30,15,15))
couleurs <- rainbow(75)[1:50]#(50)
ticks <- pretty(coeff)
par(mar=c(1,1,3,1))
plot(aic,k:1-.5,type='o',pch=21,bg='blue',cex=2,axes=F,lty=2,xpd=NA)
points(aic[choix],k-choix+.5,pch=21,cex=4,bg=2,xpd=NA)
title('aic',line=2)
par(mar=c(3,0,0,0))
plot(0,axes=F,xlab='',ylab='',xlim=range(ticks),ylim=c(.1,1))
rect(xleft = min(ticks) + (0:49)/50*(max(ticks)-min(ticks)),
xright = min(ticks) + (1:50)/50*(max(ticks)-min(ticks)),
ytop = rep(1,50),
ybottom= rep(0,50),col=couleurs,border=NA)
axis(1,ticks)
rect(xleft=min(ticks),xright=max(ticks),ytop=1,ybottom=0)
text(mean(coeff,na.rm=T),.5,'coefficients',cex=2,font=2)
par(mar=c(1,1,3,1))
image(1:n,1:k,t(coeff[k:1,]),axes=F,col=couleurs,zlim=range(ticks))
for(i in 1:n) for(j in 1:k) if(!is.na(coeff[j,i])) {
if(pval[j,i]<.01) symb = 'green'
else if( (pval[j,i]<.05) & (pval[j,i]>=.01)) symb = 'orange'
else if( (pval[j,i]<.1) & (pval[j,i]>=.05)) symb = 'red'
else symb = 'black'
polygon(c(i+.5 ,i+.2 ,i+.5 ,i+.5),
c(k-j+0.5,k-j+0.5,k-j+0.8,k-j+0.5),
col=symb)
if(j==choix) {
rect(xleft=i-.5,
xright=i+.5,
ybottom=k-j+1.5,
ytop=k-j+.5,
lwd=4)
text(i,
k-j+1,
round(coeff[j,i],2),
cex=1.2,
font=2)
}
else{
rect(xleft=i-.5,xright=i+.5,ybottom=k-j+1.5,ytop=k-j+.5)
text(i,k-j+1,round(coeff[j,i],2),cex=1.2,font=1)
}
}
axis(3,1:n,noms)
par(mar=c(0.5,0,0,0.5))
plot(0,axes=F,xlab='',ylab='',type='n',xlim=c(0,8),ylim=c(-.2,.8))
cols <- c('green','orange','red','black')
niv <- c('0','0.01','0.05','0.1')
for(i in 0:3){
polygon(c(1+2*i ,1+2*i ,1+2*i-.5 ,1+2*i),
c(.4 ,.7 , .4 , .4),
col=cols[i+1])
text(2*i,0.5,niv[i+1],cex=1.5)
}
text(8,.5,1,cex=1.5)
text(4,0,'p-value',cex=2)
box()
residus <- arimaSelect.out[[3]][[choix]]$res
par(mar=c(1,2,4,1))
acf(residus,main='')
title('acf',line=.5)
par(mar=c(1,2,4,1))
pacf(residus,main='')
title('pacf',line=.5)
par(mar=c(2,2,4,1))
qqnorm(residus,main='')
title('qq-norm',line=.5)
qqline(residus)
residus
}
if (par2 == 0) x <- log(x)
if (par2 != 0) x <- x^par2
(selection <- arimaSelect(x, order=c(par6,par3,par7), seasonal=list(order=c(par8,par4,par9), period=par5)))
bitmap(file='test1.png')
resid <- arimaSelectplot(selection)
dev.off()
resid
bitmap(file='test2.png')
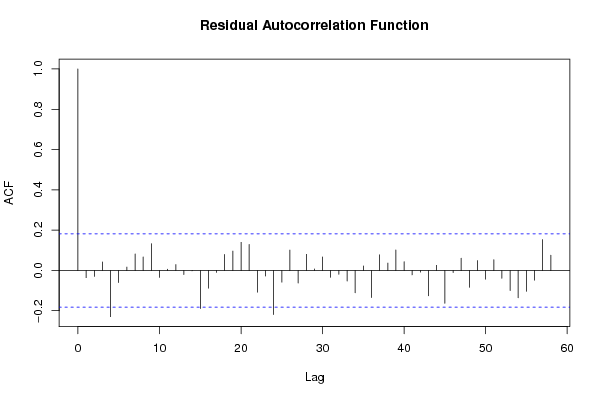
acf(resid,length(resid)/2, main='Residual Autocorrelation Function')
dev.off()
bitmap(file='test3.png')
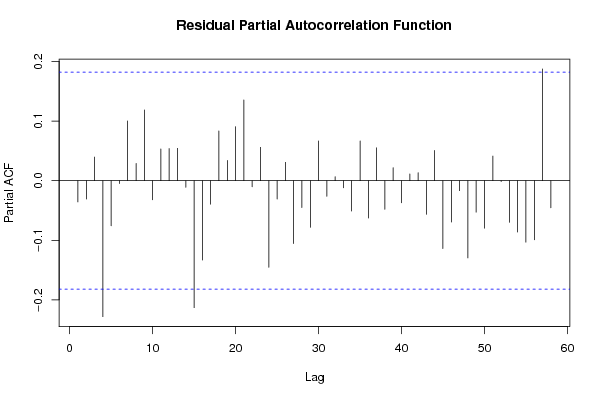
pacf(resid,length(resid)/2, main='Residual Partial Autocorrelation Function')
dev.off()
bitmap(file='test4.png')
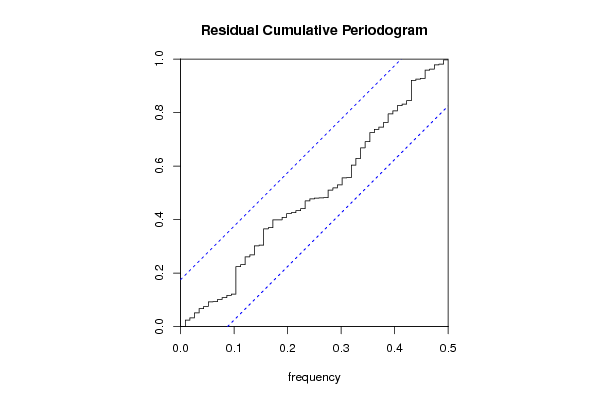
cpgram(resid, main='Residual Cumulative Periodogram')
dev.off()
bitmap(file='test5.png')
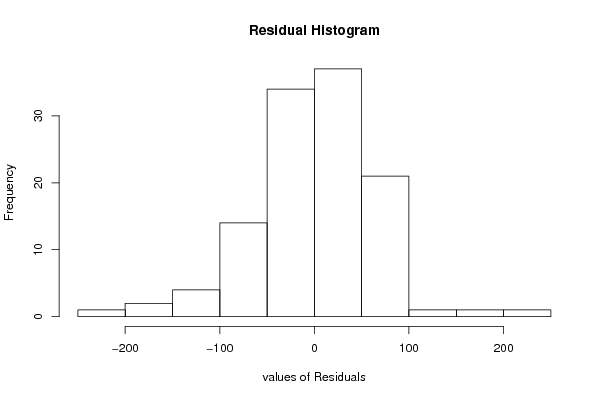
hist(resid, main='Residual Histogram', xlab='values of Residuals')
dev.off()
bitmap(file='test6.png')
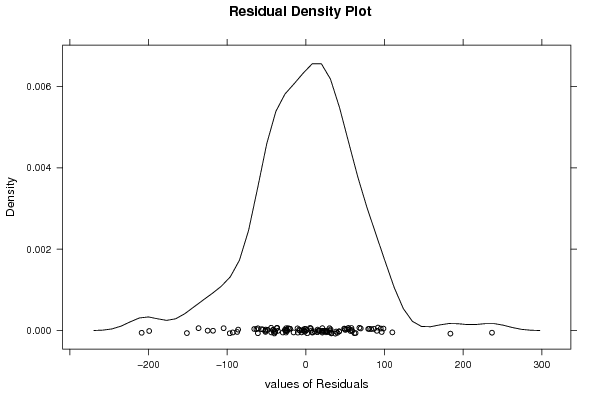
densityplot(~resid,col='black',main='Residual Density Plot', xlab='values of Residuals')
dev.off()
bitmap(file='test7.png')
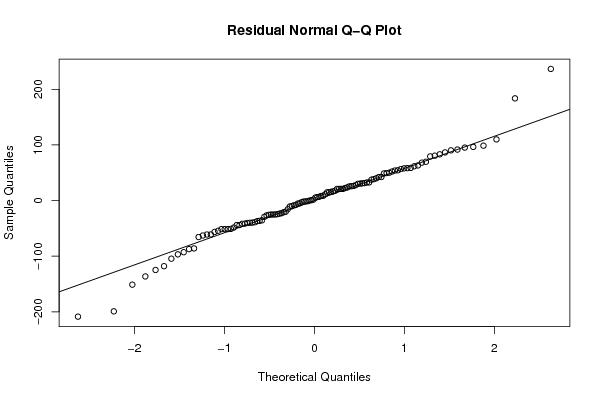
qqnorm(resid, main='Residual Normal Q-Q Plot')
qqline(resid)
dev.off()
ncols <- length(selection[[1]][1,])
nrows <- length(selection[[2]][,1])-1
load(file='createtable')
a<-table.start()
a<-table.row.start(a)
a<-table.element(a,'ARIMA Parameter Estimation and Backward Selection', ncols+1,TRUE)
a<-table.row.end(a)
a<-table.row.start(a)
a<-table.element(a,'Iteration', header=TRUE)
for (i in 1:ncols) {
a<-table.element(a,names(selection[[3]][[1]]$coef)[i],header=TRUE)
}
a<-table.row.end(a)
for (j in 1:nrows) {
a<-table.row.start(a)
mydum <- 'Estimates ('
mydum <- paste(mydum,j)
mydum <- paste(mydum,')')
a<-table.element(a,mydum, header=TRUE)
for (i in 1:ncols) {
a<-table.element(a,round(selection[[1]][j,i],4))
}
a<-table.row.end(a)
a<-table.row.start(a)
a<-table.element(a,'(p-val)', header=TRUE)
for (i in 1:ncols) {
mydum <- '('
mydum <- paste(mydum,round(selection[[2]][j,i],4),sep='')
mydum <- paste(mydum,')')
a<-table.element(a,mydum)
}
a<-table.row.end(a)
}
a<-table.end(a)
table.save(a,file='mytable.tab')
a<-table.start()
a<-table.row.start(a)
a<-table.element(a,'Estimated ARIMA Residuals', 1,TRUE)
a<-table.row.end(a)
a<-table.row.start(a)
a<-table.element(a,'Value', 1,TRUE)
a<-table.row.end(a)
for (i in (par4*par5+par3):length(resid)) {
a<-table.row.start(a)
a<-table.element(a,resid[i])
a<-table.row.end(a)
}
a<-table.end(a)
table.save(a,file='mytable1.tab')