Free Statistics

of Irreproducible Research!

Author's title

Author*The author of this computation has been verified*
R Software Modulerwasp_arimabackwardselection.wasp
Title produced by softwareARIMA Backward Selection
Date of computationFri, 23 Dec 2016 09:33:12 +0100
Cite this page as followsStatistical Computations at FreeStatistics.org, Office for Research Development and Education, URL https://freestatistics.org/blog/index.php?v=date/2016/Dec/23/t1482482221s0de0yma758ysg6.htm/, Retrieved Tue, 07 May 2024 06:04:19 +0000
Statistical Computations at FreeStatistics.org, Office for Research Development and Education, URL https://freestatistics.org/blog/index.php?pk=302780, Retrieved Tue, 07 May 2024 06:04:19 +0000
QR Codes:

Original text written by user:
IsPrivate?No (this computation is public)
User-defined keywords
Estimated Impact84
Family? (F = Feedback message, R = changed R code, M = changed R Module, P = changed Parameters, D = changed Data)
-       [ARIMA Backward Selection] [Arima Backward Se...] [2016-12-23 08:33:12] [5eeb1dffd6aae54bb54a6ca77f27aabf] [Current]
Feedback Forum

Post a new message
Dataseries X:
2312
1089
2742
3145
2966
2055
2450
2742
1697
2409
2233
2100
3434
1867
2365
3578
2845
2778
2056
2757
3325
3671
2147
3225
3556
4661
3344
5375
3907
3356
2184
3510
2834
3271
2834
2408
3261
1526
2938
2352
3915
3145
1566
2746
3572
2651
2805
3354
2523
1480
3278
5081
3332
2789
4111
2508
1833
2371
4268
2194
2935
3347
3034
5448
3427
3036
4196
3009
3369
4168
3403
1779
2761
2582
3153
3011
3419
4042
4379
4602
3249
4372
4328
3695
3614
2114
2839
2490
2610
2372
2833
4018
2734
3027
3862
3281
2746
2538
1805
2500
2601
3178
4193
2606
2491
4090
2786
2280
2403
2934
1601
1946
2554
2006
2830
3173
1960
3052
2151
2493
2752
2542
2027
1940
1877


Summary of computational transaction
Raw Input view raw input (R code)
Raw Outputview raw output of R engine
Computing time3 seconds
R ServerBig Analytics Cloud Computing Center

\begin{tabular}{lllllllll}
\hline
Summary of computational transaction \tabularnewline
Raw Input view raw input (R code)  \tabularnewline
Raw Outputview raw output of R engine  \tabularnewline
Computing time3 seconds \tabularnewline
R ServerBig Analytics Cloud Computing Center \tabularnewline
\hline
\end{tabular}
%Source: https://freestatistics.org/blog/index.php?pk=302780&T=0

[TABLE]
[ROW]
Summary of computational transaction[/C][/ROW] [ROW]Raw Input[/C] view raw input (R code) [/C][/ROW] [ROW]Raw Output[/C]view raw output of R engine [/C][/ROW] [ROW]Computing time[/C]3 seconds[/C][/ROW] [ROW]R Server[/C]Big Analytics Cloud Computing Center[/C][/ROW] [/TABLE] Source: https://freestatistics.org/blog/index.php?pk=302780&T=0

Globally Unique Identifier (entire table): ba.freestatistics.org/blog/index.php?pk=302780&T=0

As an alternative you can also use a QR Code:  

The GUIDs for individual cells are displayed in the table below:

Summary of computational transaction
Raw Input view raw input (R code)
Raw Outputview raw output of R engine
Computing time3 seconds
R ServerBig Analytics Cloud Computing Center


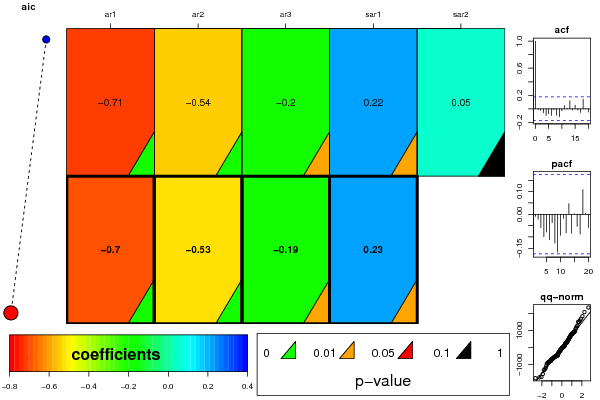
ARIMA Parameter Estimation and Backward Selection
Iterationar1ar2ar3sar1sar2
Estimates ( 1 )-0.7086-0.5369-0.19670.21650.0519
(p-val)(0 )(0 )(0.0286 )(0.018 )(0.5872 )
Estimates ( 2 )-0.6984-0.5321-0.19410.22520
(p-val)(0 )(0 )(0.0305 )(0.0134 )(NA )
Estimates ( 3 )NANANANANA
(p-val)(NA )(NA )(NA )(NA )(NA )
Estimates ( 4 )NANANANANA
(p-val)(NA )(NA )(NA )(NA )(NA )
Estimates ( 5 )NANANANANA
(p-val)(NA )(NA )(NA )(NA )(NA )
Estimates ( 6 )NANANANANA
(p-val)(NA )(NA )(NA )(NA )(NA )
Estimates ( 7 )NANANANANA
(p-val)(NA )(NA )(NA )(NA )(NA )
Estimates ( 8 )NANANANANA
(p-val)(NA )(NA )(NA )(NA )(NA )
Estimates ( 9 )NANANANANA
(p-val)(NA )(NA )(NA )(NA )(NA )

\begin{tabular}{lllllllll}
\hline
ARIMA Parameter Estimation and Backward Selection \tabularnewline
Iteration & ar1 & ar2 & ar3 & sar1 & sar2 \tabularnewline
Estimates ( 1 ) & -0.7086 & -0.5369 & -0.1967 & 0.2165 & 0.0519 \tabularnewline
(p-val) & (0 ) & (0 ) & (0.0286 ) & (0.018 ) & (0.5872 ) \tabularnewline
Estimates ( 2 ) & -0.6984 & -0.5321 & -0.1941 & 0.2252 & 0 \tabularnewline
(p-val) & (0 ) & (0 ) & (0.0305 ) & (0.0134 ) & (NA ) \tabularnewline
Estimates ( 3 ) & NA & NA & NA & NA & NA \tabularnewline
(p-val) & (NA ) & (NA ) & (NA ) & (NA ) & (NA ) \tabularnewline
Estimates ( 4 ) & NA & NA & NA & NA & NA \tabularnewline
(p-val) & (NA ) & (NA ) & (NA ) & (NA ) & (NA ) \tabularnewline
Estimates ( 5 ) & NA & NA & NA & NA & NA \tabularnewline
(p-val) & (NA ) & (NA ) & (NA ) & (NA ) & (NA ) \tabularnewline
Estimates ( 6 ) & NA & NA & NA & NA & NA \tabularnewline
(p-val) & (NA ) & (NA ) & (NA ) & (NA ) & (NA ) \tabularnewline
Estimates ( 7 ) & NA & NA & NA & NA & NA \tabularnewline
(p-val) & (NA ) & (NA ) & (NA ) & (NA ) & (NA ) \tabularnewline
Estimates ( 8 ) & NA & NA & NA & NA & NA \tabularnewline
(p-val) & (NA ) & (NA ) & (NA ) & (NA ) & (NA ) \tabularnewline
Estimates ( 9 ) & NA & NA & NA & NA & NA \tabularnewline
(p-val) & (NA ) & (NA ) & (NA ) & (NA ) & (NA ) \tabularnewline
\hline
\end{tabular}
%Source: https://freestatistics.org/blog/index.php?pk=302780&T=1

[TABLE]
[ROW][C]ARIMA Parameter Estimation and Backward Selection[/C][/ROW]
[ROW][C]Iteration[/C][C]ar1[/C][C]ar2[/C][C]ar3[/C][C]sar1[/C][C]sar2[/C][/ROW]
[ROW][C]Estimates ( 1 )[/C][C]-0.7086[/C][C]-0.5369[/C][C]-0.1967[/C][C]0.2165[/C][C]0.0519[/C][/ROW]
[ROW][C](p-val)[/C][C](0 )[/C][C](0 )[/C][C](0.0286 )[/C][C](0.018 )[/C][C](0.5872 )[/C][/ROW]
[ROW][C]Estimates ( 2 )[/C][C]-0.6984[/C][C]-0.5321[/C][C]-0.1941[/C][C]0.2252[/C][C]0[/C][/ROW]
[ROW][C](p-val)[/C][C](0 )[/C][C](0 )[/C][C](0.0305 )[/C][C](0.0134 )[/C][C](NA )[/C][/ROW]
[ROW][C]Estimates ( 3 )[/C][C]NA[/C][C]NA[/C][C]NA[/C][C]NA[/C][C]NA[/C][/ROW]
[ROW][C](p-val)[/C][C](NA )[/C][C](NA )[/C][C](NA )[/C][C](NA )[/C][C](NA )[/C][/ROW]
[ROW][C]Estimates ( 4 )[/C][C]NA[/C][C]NA[/C][C]NA[/C][C]NA[/C][C]NA[/C][/ROW]
[ROW][C](p-val)[/C][C](NA )[/C][C](NA )[/C][C](NA )[/C][C](NA )[/C][C](NA )[/C][/ROW]
[ROW][C]Estimates ( 5 )[/C][C]NA[/C][C]NA[/C][C]NA[/C][C]NA[/C][C]NA[/C][/ROW]
[ROW][C](p-val)[/C][C](NA )[/C][C](NA )[/C][C](NA )[/C][C](NA )[/C][C](NA )[/C][/ROW]
[ROW][C]Estimates ( 6 )[/C][C]NA[/C][C]NA[/C][C]NA[/C][C]NA[/C][C]NA[/C][/ROW]
[ROW][C](p-val)[/C][C](NA )[/C][C](NA )[/C][C](NA )[/C][C](NA )[/C][C](NA )[/C][/ROW]
[ROW][C]Estimates ( 7 )[/C][C]NA[/C][C]NA[/C][C]NA[/C][C]NA[/C][C]NA[/C][/ROW]
[ROW][C](p-val)[/C][C](NA )[/C][C](NA )[/C][C](NA )[/C][C](NA )[/C][C](NA )[/C][/ROW]
[ROW][C]Estimates ( 8 )[/C][C]NA[/C][C]NA[/C][C]NA[/C][C]NA[/C][C]NA[/C][/ROW]
[ROW][C](p-val)[/C][C](NA )[/C][C](NA )[/C][C](NA )[/C][C](NA )[/C][C](NA )[/C][/ROW]
[ROW][C]Estimates ( 9 )[/C][C]NA[/C][C]NA[/C][C]NA[/C][C]NA[/C][C]NA[/C][/ROW]
[ROW][C](p-val)[/C][C](NA )[/C][C](NA )[/C][C](NA )[/C][C](NA )[/C][C](NA )[/C][/ROW]
[/TABLE]
Source: https://freestatistics.org/blog/index.php?pk=302780&T=1

Globally Unique Identifier (entire table): ba.freestatistics.org/blog/index.php?pk=302780&T=1

As an alternative you can also use a QR Code:  

The GUIDs for individual cells are displayed in the table below:

ARIMA Parameter Estimation and Backward Selection
Iterationar1ar2ar3sar1sar2
Estimates ( 1 )-0.7086-0.5369-0.19670.21650.0519
(p-val)(0 )(0 )(0.0286 )(0.018 )(0.5872 )
Estimates ( 2 )-0.6984-0.5321-0.19410.22520
(p-val)(0 )(0 )(0.0305 )(0.0134 )(NA )
Estimates ( 3 )NANANANANA
(p-val)(NA )(NA )(NA )(NA )(NA )
Estimates ( 4 )NANANANANA
(p-val)(NA )(NA )(NA )(NA )(NA )
Estimates ( 5 )NANANANANA
(p-val)(NA )(NA )(NA )(NA )(NA )
Estimates ( 6 )NANANANANA
(p-val)(NA )(NA )(NA )(NA )(NA )
Estimates ( 7 )NANANANANA
(p-val)(NA )(NA )(NA )(NA )(NA )
Estimates ( 8 )NANANANANA
(p-val)(NA )(NA )(NA )(NA )(NA )
Estimates ( 9 )NANANANANA
(p-val)(NA )(NA )(NA )(NA )(NA )


Estimated ARIMA Residuals
Value
2.31199809254575
-952.088917234998
964.478143566332
891.468529030259
728.536505216613
-481.542104016816
-251.091516795275
39.2877392435747
-801.154722018485
229.781155996397
-149.678295200017
-148.189021415024
1228.85301560028
-499.241504669217
-120.352910043889
774.113532813751
-87.0747196780368
276.309711202107
-860.6755467674
-3.56581578896432
843.856459403529
941.210365590519
-793.217779513952
298.802703821199
51.7417549829406
1827.36250223974
-208.108403113688
1493.99187019594
-576.318499127181
-769.239819418113
-1737.13951166807
-93.5126985352963
-576.030846634181
215.965920648073
-39.4233075933853
-693.776223897038
261.15676215538
-1757.93629553779
584.024012411661
-780.714421213403
1672.50699816977
456.630661629277
-930.244479192399
-26.0591035797238
731.058251438912
-158.850379722813
270.058786178428
447.995191881667
-645.469823809092
-1077.84401239057
607.677454453992
2338.05753324969
-23.0256730413312
-486.238204840536
757.272715271466
-1287.48653464951
-1326.75138909596
-561.013278293312
1574.08600364263
-611.424387120766
491.90437166617
554.500555489177
-216.071866209827
2067.74106204854
-541.22827527238
-504.339260417181
268.918053643653
-688.317246577191
291.95480918699
762.695294740834
-594.719719116372
-1558.9557840606
-479.972993219713
-480.369808613252
621.347557834797
-316.556554187883
649.837176392102
1099.46856938293
892.252658739958
1154.6438683922
-842.873158186841
238.753058433551
37.8368142732916
63.1922254631163
-261.373818270094
-1806.6574026323
-645.410943134478
-867.255174226531
-137.733430007482
-372.507567129776
64.0803363331174
1268.15287862607
-53.9713178334528
0.809698973907871
583.709528110151
72.7606533061758
-346.867912432528
-295.933188331811
-1206.22577291262
82.1987999640726
136.109767249625
871.176090070077
1502.08492178583
-888.324501070324
-482.041583167033
823.030986130336
-675.391716278253
-558.766828949261
-508.530428679343
347.971019798565
-686.437651473242
-247.224499838536
208.471703857132
-373.864196045899
465.449679695695
795.695380876703
-496.874574615246
385.730059390539
-623.512724258924
184.315824698409
389.704926104038
-1.42069988341336
-176.565727509847
-448.750661196239
-502.934021905342

\begin{tabular}{lllllllll}
\hline
Estimated ARIMA Residuals \tabularnewline
Value \tabularnewline
2.31199809254575 \tabularnewline
-952.088917234998 \tabularnewline
964.478143566332 \tabularnewline
891.468529030259 \tabularnewline
728.536505216613 \tabularnewline
-481.542104016816 \tabularnewline
-251.091516795275 \tabularnewline
39.2877392435747 \tabularnewline
-801.154722018485 \tabularnewline
229.781155996397 \tabularnewline
-149.678295200017 \tabularnewline
-148.189021415024 \tabularnewline
1228.85301560028 \tabularnewline
-499.241504669217 \tabularnewline
-120.352910043889 \tabularnewline
774.113532813751 \tabularnewline
-87.0747196780368 \tabularnewline
276.309711202107 \tabularnewline
-860.6755467674 \tabularnewline
-3.56581578896432 \tabularnewline
843.856459403529 \tabularnewline
941.210365590519 \tabularnewline
-793.217779513952 \tabularnewline
298.802703821199 \tabularnewline
51.7417549829406 \tabularnewline
1827.36250223974 \tabularnewline
-208.108403113688 \tabularnewline
1493.99187019594 \tabularnewline
-576.318499127181 \tabularnewline
-769.239819418113 \tabularnewline
-1737.13951166807 \tabularnewline
-93.5126985352963 \tabularnewline
-576.030846634181 \tabularnewline
215.965920648073 \tabularnewline
-39.4233075933853 \tabularnewline
-693.776223897038 \tabularnewline
261.15676215538 \tabularnewline
-1757.93629553779 \tabularnewline
584.024012411661 \tabularnewline
-780.714421213403 \tabularnewline
1672.50699816977 \tabularnewline
456.630661629277 \tabularnewline
-930.244479192399 \tabularnewline
-26.0591035797238 \tabularnewline
731.058251438912 \tabularnewline
-158.850379722813 \tabularnewline
270.058786178428 \tabularnewline
447.995191881667 \tabularnewline
-645.469823809092 \tabularnewline
-1077.84401239057 \tabularnewline
607.677454453992 \tabularnewline
2338.05753324969 \tabularnewline
-23.0256730413312 \tabularnewline
-486.238204840536 \tabularnewline
757.272715271466 \tabularnewline
-1287.48653464951 \tabularnewline
-1326.75138909596 \tabularnewline
-561.013278293312 \tabularnewline
1574.08600364263 \tabularnewline
-611.424387120766 \tabularnewline
491.90437166617 \tabularnewline
554.500555489177 \tabularnewline
-216.071866209827 \tabularnewline
2067.74106204854 \tabularnewline
-541.22827527238 \tabularnewline
-504.339260417181 \tabularnewline
268.918053643653 \tabularnewline
-688.317246577191 \tabularnewline
291.95480918699 \tabularnewline
762.695294740834 \tabularnewline
-594.719719116372 \tabularnewline
-1558.9557840606 \tabularnewline
-479.972993219713 \tabularnewline
-480.369808613252 \tabularnewline
621.347557834797 \tabularnewline
-316.556554187883 \tabularnewline
649.837176392102 \tabularnewline
1099.46856938293 \tabularnewline
892.252658739958 \tabularnewline
1154.6438683922 \tabularnewline
-842.873158186841 \tabularnewline
238.753058433551 \tabularnewline
37.8368142732916 \tabularnewline
63.1922254631163 \tabularnewline
-261.373818270094 \tabularnewline
-1806.6574026323 \tabularnewline
-645.410943134478 \tabularnewline
-867.255174226531 \tabularnewline
-137.733430007482 \tabularnewline
-372.507567129776 \tabularnewline
64.0803363331174 \tabularnewline
1268.15287862607 \tabularnewline
-53.9713178334528 \tabularnewline
0.809698973907871 \tabularnewline
583.709528110151 \tabularnewline
72.7606533061758 \tabularnewline
-346.867912432528 \tabularnewline
-295.933188331811 \tabularnewline
-1206.22577291262 \tabularnewline
82.1987999640726 \tabularnewline
136.109767249625 \tabularnewline
871.176090070077 \tabularnewline
1502.08492178583 \tabularnewline
-888.324501070324 \tabularnewline
-482.041583167033 \tabularnewline
823.030986130336 \tabularnewline
-675.391716278253 \tabularnewline
-558.766828949261 \tabularnewline
-508.530428679343 \tabularnewline
347.971019798565 \tabularnewline
-686.437651473242 \tabularnewline
-247.224499838536 \tabularnewline
208.471703857132 \tabularnewline
-373.864196045899 \tabularnewline
465.449679695695 \tabularnewline
795.695380876703 \tabularnewline
-496.874574615246 \tabularnewline
385.730059390539 \tabularnewline
-623.512724258924 \tabularnewline
184.315824698409 \tabularnewline
389.704926104038 \tabularnewline
-1.42069988341336 \tabularnewline
-176.565727509847 \tabularnewline
-448.750661196239 \tabularnewline
-502.934021905342 \tabularnewline
\hline
\end{tabular}
%Source: https://freestatistics.org/blog/index.php?pk=302780&T=2

[TABLE]
[ROW][C]Estimated ARIMA Residuals[/C][/ROW]
[ROW][C]Value[/C][/ROW]
[ROW][C]2.31199809254575[/C][/ROW]
[ROW][C]-952.088917234998[/C][/ROW]
[ROW][C]964.478143566332[/C][/ROW]
[ROW][C]891.468529030259[/C][/ROW]
[ROW][C]728.536505216613[/C][/ROW]
[ROW][C]-481.542104016816[/C][/ROW]
[ROW][C]-251.091516795275[/C][/ROW]
[ROW][C]39.2877392435747[/C][/ROW]
[ROW][C]-801.154722018485[/C][/ROW]
[ROW][C]229.781155996397[/C][/ROW]
[ROW][C]-149.678295200017[/C][/ROW]
[ROW][C]-148.189021415024[/C][/ROW]
[ROW][C]1228.85301560028[/C][/ROW]
[ROW][C]-499.241504669217[/C][/ROW]
[ROW][C]-120.352910043889[/C][/ROW]
[ROW][C]774.113532813751[/C][/ROW]
[ROW][C]-87.0747196780368[/C][/ROW]
[ROW][C]276.309711202107[/C][/ROW]
[ROW][C]-860.6755467674[/C][/ROW]
[ROW][C]-3.56581578896432[/C][/ROW]
[ROW][C]843.856459403529[/C][/ROW]
[ROW][C]941.210365590519[/C][/ROW]
[ROW][C]-793.217779513952[/C][/ROW]
[ROW][C]298.802703821199[/C][/ROW]
[ROW][C]51.7417549829406[/C][/ROW]
[ROW][C]1827.36250223974[/C][/ROW]
[ROW][C]-208.108403113688[/C][/ROW]
[ROW][C]1493.99187019594[/C][/ROW]
[ROW][C]-576.318499127181[/C][/ROW]
[ROW][C]-769.239819418113[/C][/ROW]
[ROW][C]-1737.13951166807[/C][/ROW]
[ROW][C]-93.5126985352963[/C][/ROW]
[ROW][C]-576.030846634181[/C][/ROW]
[ROW][C]215.965920648073[/C][/ROW]
[ROW][C]-39.4233075933853[/C][/ROW]
[ROW][C]-693.776223897038[/C][/ROW]
[ROW][C]261.15676215538[/C][/ROW]
[ROW][C]-1757.93629553779[/C][/ROW]
[ROW][C]584.024012411661[/C][/ROW]
[ROW][C]-780.714421213403[/C][/ROW]
[ROW][C]1672.50699816977[/C][/ROW]
[ROW][C]456.630661629277[/C][/ROW]
[ROW][C]-930.244479192399[/C][/ROW]
[ROW][C]-26.0591035797238[/C][/ROW]
[ROW][C]731.058251438912[/C][/ROW]
[ROW][C]-158.850379722813[/C][/ROW]
[ROW][C]270.058786178428[/C][/ROW]
[ROW][C]447.995191881667[/C][/ROW]
[ROW][C]-645.469823809092[/C][/ROW]
[ROW][C]-1077.84401239057[/C][/ROW]
[ROW][C]607.677454453992[/C][/ROW]
[ROW][C]2338.05753324969[/C][/ROW]
[ROW][C]-23.0256730413312[/C][/ROW]
[ROW][C]-486.238204840536[/C][/ROW]
[ROW][C]757.272715271466[/C][/ROW]
[ROW][C]-1287.48653464951[/C][/ROW]
[ROW][C]-1326.75138909596[/C][/ROW]
[ROW][C]-561.013278293312[/C][/ROW]
[ROW][C]1574.08600364263[/C][/ROW]
[ROW][C]-611.424387120766[/C][/ROW]
[ROW][C]491.90437166617[/C][/ROW]
[ROW][C]554.500555489177[/C][/ROW]
[ROW][C]-216.071866209827[/C][/ROW]
[ROW][C]2067.74106204854[/C][/ROW]
[ROW][C]-541.22827527238[/C][/ROW]
[ROW][C]-504.339260417181[/C][/ROW]
[ROW][C]268.918053643653[/C][/ROW]
[ROW][C]-688.317246577191[/C][/ROW]
[ROW][C]291.95480918699[/C][/ROW]
[ROW][C]762.695294740834[/C][/ROW]
[ROW][C]-594.719719116372[/C][/ROW]
[ROW][C]-1558.9557840606[/C][/ROW]
[ROW][C]-479.972993219713[/C][/ROW]
[ROW][C]-480.369808613252[/C][/ROW]
[ROW][C]621.347557834797[/C][/ROW]
[ROW][C]-316.556554187883[/C][/ROW]
[ROW][C]649.837176392102[/C][/ROW]
[ROW][C]1099.46856938293[/C][/ROW]
[ROW][C]892.252658739958[/C][/ROW]
[ROW][C]1154.6438683922[/C][/ROW]
[ROW][C]-842.873158186841[/C][/ROW]
[ROW][C]238.753058433551[/C][/ROW]
[ROW][C]37.8368142732916[/C][/ROW]
[ROW][C]63.1922254631163[/C][/ROW]
[ROW][C]-261.373818270094[/C][/ROW]
[ROW][C]-1806.6574026323[/C][/ROW]
[ROW][C]-645.410943134478[/C][/ROW]
[ROW][C]-867.255174226531[/C][/ROW]
[ROW][C]-137.733430007482[/C][/ROW]
[ROW][C]-372.507567129776[/C][/ROW]
[ROW][C]64.0803363331174[/C][/ROW]
[ROW][C]1268.15287862607[/C][/ROW]
[ROW][C]-53.9713178334528[/C][/ROW]
[ROW][C]0.809698973907871[/C][/ROW]
[ROW][C]583.709528110151[/C][/ROW]
[ROW][C]72.7606533061758[/C][/ROW]
[ROW][C]-346.867912432528[/C][/ROW]
[ROW][C]-295.933188331811[/C][/ROW]
[ROW][C]-1206.22577291262[/C][/ROW]
[ROW][C]82.1987999640726[/C][/ROW]
[ROW][C]136.109767249625[/C][/ROW]
[ROW][C]871.176090070077[/C][/ROW]
[ROW][C]1502.08492178583[/C][/ROW]
[ROW][C]-888.324501070324[/C][/ROW]
[ROW][C]-482.041583167033[/C][/ROW]
[ROW][C]823.030986130336[/C][/ROW]
[ROW][C]-675.391716278253[/C][/ROW]
[ROW][C]-558.766828949261[/C][/ROW]
[ROW][C]-508.530428679343[/C][/ROW]
[ROW][C]347.971019798565[/C][/ROW]
[ROW][C]-686.437651473242[/C][/ROW]
[ROW][C]-247.224499838536[/C][/ROW]
[ROW][C]208.471703857132[/C][/ROW]
[ROW][C]-373.864196045899[/C][/ROW]
[ROW][C]465.449679695695[/C][/ROW]
[ROW][C]795.695380876703[/C][/ROW]
[ROW][C]-496.874574615246[/C][/ROW]
[ROW][C]385.730059390539[/C][/ROW]
[ROW][C]-623.512724258924[/C][/ROW]
[ROW][C]184.315824698409[/C][/ROW]
[ROW][C]389.704926104038[/C][/ROW]
[ROW][C]-1.42069988341336[/C][/ROW]
[ROW][C]-176.565727509847[/C][/ROW]
[ROW][C]-448.750661196239[/C][/ROW]
[ROW][C]-502.934021905342[/C][/ROW]
[/TABLE]
Source: https://freestatistics.org/blog/index.php?pk=302780&T=2

Globally Unique Identifier (entire table): ba.freestatistics.org/blog/index.php?pk=302780&T=2

As an alternative you can also use a QR Code:  

The GUIDs for individual cells are displayed in the table below:

Estimated ARIMA Residuals
Value
2.31199809254575
-952.088917234998
964.478143566332
891.468529030259
728.536505216613
-481.542104016816
-251.091516795275
39.2877392435747
-801.154722018485
229.781155996397
-149.678295200017
-148.189021415024
1228.85301560028
-499.241504669217
-120.352910043889
774.113532813751
-87.0747196780368
276.309711202107
-860.6755467674
-3.56581578896432
843.856459403529
941.210365590519
-793.217779513952
298.802703821199
51.7417549829406
1827.36250223974
-208.108403113688
1493.99187019594
-576.318499127181
-769.239819418113
-1737.13951166807
-93.5126985352963
-576.030846634181
215.965920648073
-39.4233075933853
-693.776223897038
261.15676215538
-1757.93629553779
584.024012411661
-780.714421213403
1672.50699816977
456.630661629277
-930.244479192399
-26.0591035797238
731.058251438912
-158.850379722813
270.058786178428
447.995191881667
-645.469823809092
-1077.84401239057
607.677454453992
2338.05753324969
-23.0256730413312
-486.238204840536
757.272715271466
-1287.48653464951
-1326.75138909596
-561.013278293312
1574.08600364263
-611.424387120766
491.90437166617
554.500555489177
-216.071866209827
2067.74106204854
-541.22827527238
-504.339260417181
268.918053643653
-688.317246577191
291.95480918699
762.695294740834
-594.719719116372
-1558.9557840606
-479.972993219713
-480.369808613252
621.347557834797
-316.556554187883
649.837176392102
1099.46856938293
892.252658739958
1154.6438683922
-842.873158186841
238.753058433551
37.8368142732916
63.1922254631163
-261.373818270094
-1806.6574026323
-645.410943134478
-867.255174226531
-137.733430007482
-372.507567129776
64.0803363331174
1268.15287862607
-53.9713178334528
0.809698973907871
583.709528110151
72.7606533061758
-346.867912432528
-295.933188331811
-1206.22577291262
82.1987999640726
136.109767249625
871.176090070077
1502.08492178583
-888.324501070324
-482.041583167033
823.030986130336
-675.391716278253
-558.766828949261
-508.530428679343
347.971019798565
-686.437651473242
-247.224499838536
208.471703857132
-373.864196045899
465.449679695695
795.695380876703
-496.874574615246
385.730059390539
-623.512724258924
184.315824698409
389.704926104038
-1.42069988341336
-176.565727509847
-448.750661196239
-502.934021905342


Parameters (Session):
par1 = FALSE ; par2 = 1 ; par3 = 1 ; par4 = 0 ; par5 = 12 ; par6 = 3 ; par7 = 0 ; par8 = 2 ; par9 = 0 ;
Parameters (R input):
par1 = FALSE ; par2 = 1 ; par3 = 1 ; par4 = 0 ; par5 = 12 ; par6 = 3 ; par7 = 0 ; par8 = 2 ; par9 = 0 ;
R code (references can be found in the software module):
par9 <- '0'
par8 <- '2'
par7 <- '0'
par6 <- '3'
par5 <- '12'
par4 <- '0'
par3 <- '1'
par2 <- '1'
par1 <- 'FALSE'
library(lattice)
if (par1 == 'TRUE') par1 <- TRUE
if (par1 == 'FALSE') par1 <- FALSE
par2 <- as.numeric(par2) #Box-Cox lambda transformation parameter
par3 <- as.numeric(par3) #degree of non-seasonal differencing
par4 <- as.numeric(par4) #degree of seasonal differencing
par5 <- as.numeric(par5) #seasonal period
par6 <- as.numeric(par6) #degree (p) of the non-seasonal AR(p) polynomial
par7 <- as.numeric(par7) #degree (q) of the non-seasonal MA(q) polynomial
par8 <- as.numeric(par8) #degree (P) of the seasonal AR(P) polynomial
par9 <- as.numeric(par9) #degree (Q) of the seasonal MA(Q) polynomial
armaGR <- function(arima.out, names, n){
try1 <- arima.out$coef
try2 <- sqrt(diag(arima.out$var.coef))
try.data.frame <- data.frame(matrix(NA,ncol=4,nrow=length(names)))
dimnames(try.data.frame) <- list(names,c('coef','std','tstat','pv'))
try.data.frame[,1] <- try1
for(i in 1:length(try2)) try.data.frame[which(rownames(try.data.frame)==names(try2)[i]),2] <- try2[i]
try.data.frame[,3] <- try.data.frame[,1] / try.data.frame[,2]
try.data.frame[,4] <- round((1-pt(abs(try.data.frame[,3]),df=n-(length(try2)+1)))*2,5)
vector <- rep(NA,length(names))
vector[is.na(try.data.frame[,4])] <- 0
maxi <- which.max(try.data.frame[,4])
continue <- max(try.data.frame[,4],na.rm=TRUE) > .05
vector[maxi] <- 0
list(summary=try.data.frame,next.vector=vector,continue=continue)
}
arimaSelect <- function(series, order=c(13,0,0), seasonal=list(order=c(2,0,0),period=12), include.mean=F){
nrc <- order[1]+order[3]+seasonal$order[1]+seasonal$order[3]
coeff <- matrix(NA, nrow=nrc*2, ncol=nrc)
pval <- matrix(NA, nrow=nrc*2, ncol=nrc)
mylist <- rep(list(NULL), nrc)
names <- NULL
if(order[1] > 0) names <- paste('ar',1:order[1],sep='')
if(order[3] > 0) names <- c( names , paste('ma',1:order[3],sep='') )
if(seasonal$order[1] > 0) names <- c(names, paste('sar',1:seasonal$order[1],sep=''))
if(seasonal$order[3] > 0) names <- c(names, paste('sma',1:seasonal$order[3],sep=''))
arima.out <- arima(series, order=order, seasonal=seasonal, include.mean=include.mean, method='ML')
mylist[[1]] <- arima.out
last.arma <- armaGR(arima.out, names, length(series))
mystop <- FALSE
i <- 1
coeff[i,] <- last.arma[[1]][,1]
pval [i,] <- last.arma[[1]][,4]
i <- 2
aic <- arima.out$aic
while(!mystop){
mylist[[i]] <- arima.out
arima.out <- arima(series, order=order, seasonal=seasonal, include.mean=include.mean, method='ML', fixed=last.arma$next.vector)
aic <- c(aic, arima.out$aic)
last.arma <- armaGR(arima.out, names, length(series))
mystop <- !last.arma$continue
coeff[i,] <- last.arma[[1]][,1]
pval [i,] <- last.arma[[1]][,4]
i <- i+1
}
list(coeff, pval, mylist, aic=aic)
}
arimaSelectplot <- function(arimaSelect.out,noms,choix){
noms <- names(arimaSelect.out[[3]][[1]]$coef)
coeff <- arimaSelect.out[[1]]
k <- min(which(is.na(coeff[,1])))-1
coeff <- coeff[1:k,]
pval <- arimaSelect.out[[2]][1:k,]
aic <- arimaSelect.out$aic[1:k]
coeff[coeff==0] <- NA
n <- ncol(coeff)
if(missing(choix)) choix <- k
layout(matrix(c(1,1,1,2,
3,3,3,2,
3,3,3,4,
5,6,7,7),nr=4),
widths=c(10,35,45,15),
heights=c(30,30,15,15))
couleurs <- rainbow(75)[1:50]#(50)
ticks <- pretty(coeff)
par(mar=c(1,1,3,1))
plot(aic,k:1-.5,type='o',pch=21,bg='blue',cex=2,axes=F,lty=2,xpd=NA)
points(aic[choix],k-choix+.5,pch=21,cex=4,bg=2,xpd=NA)
title('aic',line=2)
par(mar=c(3,0,0,0))
plot(0,axes=F,xlab='',ylab='',xlim=range(ticks),ylim=c(.1,1))
rect(xleft = min(ticks) + (0:49)/50*(max(ticks)-min(ticks)),
xright = min(ticks) + (1:50)/50*(max(ticks)-min(ticks)),
ytop = rep(1,50),
ybottom= rep(0,50),col=couleurs,border=NA)
axis(1,ticks)
rect(xleft=min(ticks),xright=max(ticks),ytop=1,ybottom=0)
text(mean(coeff,na.rm=T),.5,'coefficients',cex=2,font=2)
par(mar=c(1,1,3,1))
image(1:n,1:k,t(coeff[k:1,]),axes=F,col=couleurs,zlim=range(ticks))
for(i in 1:n) for(j in 1:k) if(!is.na(coeff[j,i])) {
if(pval[j,i]<.01) symb = 'green'
else if( (pval[j,i]<.05) & (pval[j,i]>=.01)) symb = 'orange'
else if( (pval[j,i]<.1) & (pval[j,i]>=.05)) symb = 'red'
else symb = 'black'
polygon(c(i+.5 ,i+.2 ,i+.5 ,i+.5),
c(k-j+0.5,k-j+0.5,k-j+0.8,k-j+0.5),
col=symb)
if(j==choix) {
rect(xleft=i-.5,
xright=i+.5,
ybottom=k-j+1.5,
ytop=k-j+.5,
lwd=4)
text(i,
k-j+1,
round(coeff[j,i],2),
cex=1.2,
font=2)
}
else{
rect(xleft=i-.5,xright=i+.5,ybottom=k-j+1.5,ytop=k-j+.5)
text(i,k-j+1,round(coeff[j,i],2),cex=1.2,font=1)
}
}
axis(3,1:n,noms)
par(mar=c(0.5,0,0,0.5))
plot(0,axes=F,xlab='',ylab='',type='n',xlim=c(0,8),ylim=c(-.2,.8))
cols <- c('green','orange','red','black')
niv <- c('0','0.01','0.05','0.1')
for(i in 0:3){
polygon(c(1+2*i ,1+2*i ,1+2*i-.5 ,1+2*i),
c(.4 ,.7 , .4 , .4),
col=cols[i+1])
text(2*i,0.5,niv[i+1],cex=1.5)
}
text(8,.5,1,cex=1.5)
text(4,0,'p-value',cex=2)
box()
residus <- arimaSelect.out[[3]][[choix]]$res
par(mar=c(1,2,4,1))
acf(residus,main='')
title('acf',line=.5)
par(mar=c(1,2,4,1))
pacf(residus,main='')
title('pacf',line=.5)
par(mar=c(2,2,4,1))
qqnorm(residus,main='')
title('qq-norm',line=.5)
qqline(residus)
residus
}
if (par2 == 0) x <- log(x)
if (par2 != 0) x <- x^par2
(selection <- arimaSelect(x, order=c(par6,par3,par7), seasonal=list(order=c(par8,par4,par9), period=par5)))
bitmap(file='test1.png')
resid <- arimaSelectplot(selection)
dev.off()
resid
bitmap(file='test2.png')
acf(resid,length(resid)/2, main='Residual Autocorrelation Function')
dev.off()
bitmap(file='test3.png')
pacf(resid,length(resid)/2, main='Residual Partial Autocorrelation Function')
dev.off()
bitmap(file='test4.png')
cpgram(resid, main='Residual Cumulative Periodogram')
dev.off()
bitmap(file='test5.png')
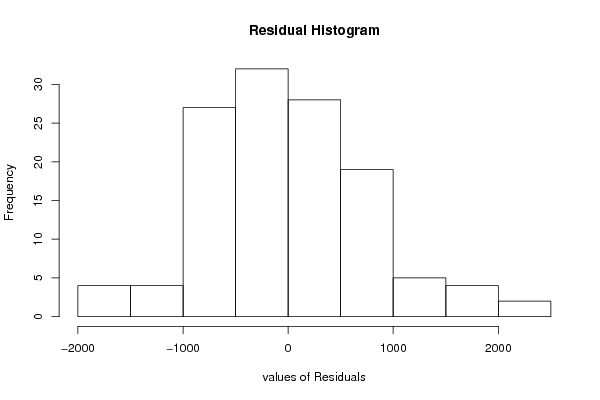
hist(resid, main='Residual Histogram', xlab='values of Residuals')
dev.off()
bitmap(file='test6.png')
densityplot(~resid,col='black',main='Residual Density Plot', xlab='values of Residuals')
dev.off()
bitmap(file='test7.png')
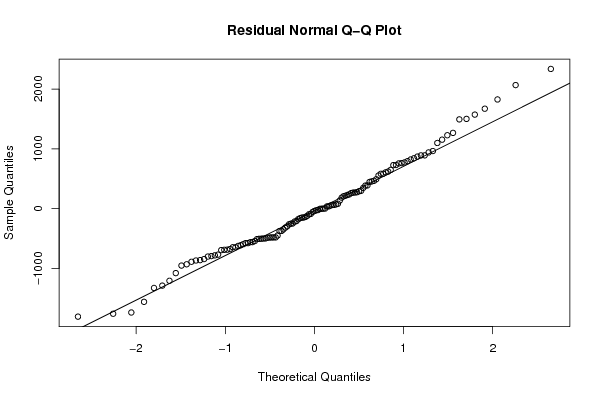
qqnorm(resid, main='Residual Normal Q-Q Plot')
qqline(resid)
dev.off()
ncols <- length(selection[[1]][1,])
nrows <- length(selection[[2]][,1])-1
load(file='createtable')
a<-table.start()
a<-table.row.start(a)
a<-table.element(a,'ARIMA Parameter Estimation and Backward Selection', ncols+1,TRUE)
a<-table.row.end(a)
a<-table.row.start(a)
a<-table.element(a,'Iteration', header=TRUE)
for (i in 1:ncols) {
a<-table.element(a,names(selection[[3]][[1]]$coef)[i],header=TRUE)
}
a<-table.row.end(a)
for (j in 1:nrows) {
a<-table.row.start(a)
mydum <- 'Estimates ('
mydum <- paste(mydum,j)
mydum <- paste(mydum,')')
a<-table.element(a,mydum, header=TRUE)
for (i in 1:ncols) {
a<-table.element(a,round(selection[[1]][j,i],4))
}
a<-table.row.end(a)
a<-table.row.start(a)
a<-table.element(a,'(p-val)', header=TRUE)
for (i in 1:ncols) {
mydum <- '('
mydum <- paste(mydum,round(selection[[2]][j,i],4),sep='')
mydum <- paste(mydum,')')
a<-table.element(a,mydum)
}
a<-table.row.end(a)
}
a<-table.end(a)
table.save(a,file='mytable.tab')
a<-table.start()
a<-table.row.start(a)
a<-table.element(a,'Estimated ARIMA Residuals', 1,TRUE)
a<-table.row.end(a)
a<-table.row.start(a)
a<-table.element(a,'Value', 1,TRUE)
a<-table.row.end(a)
for (i in (par4*par5+par3):length(resid)) {
a<-table.row.start(a)
a<-table.element(a,resid[i])
a<-table.row.end(a)
}
a<-table.end(a)
table.save(a,file='mytable1.tab')