Free Statistics

of Irreproducible Research!

Author's title

Author*The author of this computation has been verified*
R Software Modulerwasp_arimabackwardselection.wasp
Title produced by softwareARIMA Backward Selection
Date of computationFri, 23 Dec 2016 10:26:54 +0100
Cite this page as followsStatistical Computations at FreeStatistics.org, Office for Research Development and Education, URL https://freestatistics.org/blog/index.php?v=date/2016/Dec/23/t1482485452m1rwncwvgayq06h.htm/, Retrieved Tue, 07 May 2024 20:59:41 +0000
Statistical Computations at FreeStatistics.org, Office for Research Development and Education, URL https://freestatistics.org/blog/index.php?pk=302812, Retrieved Tue, 07 May 2024 20:59:41 +0000
QR Codes:

Original text written by user:
IsPrivate?No (this computation is public)
User-defined keywords
Estimated Impact73
Family? (F = Feedback message, R = changed R code, M = changed R Module, P = changed Parameters, D = changed Data)
-       [ARIMA Backward Selection] [ARIMA BACKWARD] [2016-12-23 09:26:54] [1e1af2256d87dfd5401e4c69cd3b64ca] [Current]
Feedback Forum

Post a new message
Dataseries X:
2300
2140
2760
1900
3140
2160
2060
3480
3340
3180
2800
2780
4180
2820
3500
3860
4040
2900
4400
3680
2960
4020
3360
3480
4820
3100
3200
3400
4320
4040
3600
3880
3140
3340
3540
4800
5400
3680
5860
4000
4380
4080
4780
4180
4060
4620
4320
4800
4760
4780
6260


Summary of computational transaction
Raw Input view raw input (R code)
Raw Outputview raw output of R engine
Computing time8 seconds
R ServerBig Analytics Cloud Computing Center

\begin{tabular}{lllllllll}
\hline
Summary of computational transaction \tabularnewline
Raw Input view raw input (R code)  \tabularnewline
Raw Outputview raw output of R engine  \tabularnewline
Computing time8 seconds \tabularnewline
R ServerBig Analytics Cloud Computing Center \tabularnewline
\hline
\end{tabular}
%Source: https://freestatistics.org/blog/index.php?pk=302812&T=0

[TABLE]
[ROW]
Summary of computational transaction[/C][/ROW] [ROW]Raw Input[/C] view raw input (R code) [/C][/ROW] [ROW]Raw Output[/C]view raw output of R engine [/C][/ROW] [ROW]Computing time[/C]8 seconds[/C][/ROW] [ROW]R Server[/C]Big Analytics Cloud Computing Center[/C][/ROW] [/TABLE] Source: https://freestatistics.org/blog/index.php?pk=302812&T=0

Globally Unique Identifier (entire table): ba.freestatistics.org/blog/index.php?pk=302812&T=0

As an alternative you can also use a QR Code:  

The GUIDs for individual cells are displayed in the table below:

Summary of computational transaction
Raw Input view raw input (R code)
Raw Outputview raw output of R engine
Computing time8 seconds
R ServerBig Analytics Cloud Computing Center


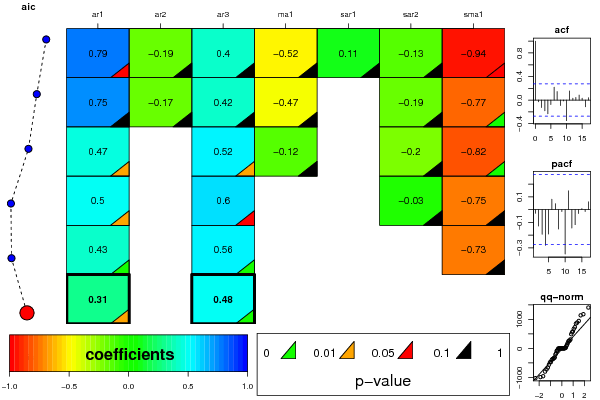
ARIMA Parameter Estimation and Backward Selection
Iterationar1ar2ar3ma1sar1sar2sma1
Estimates ( 1 )0.7857-0.18930.4035-0.51540.1099-0.1312-0.9449
(p-val)(0.0681 )(0.4566 )(0.1546 )(0.3068 )(0.7411 )(0.7231 )(0.0652 )
Estimates ( 2 )0.7514-0.17480.4211-0.47320-0.1911-0.771
(p-val)(0.1132 )(0.5171 )(0.1604 )(0.4153 )(NA )(0.4777 )(0.0079 )
Estimates ( 3 )0.473100.5237-0.12030-0.2033-0.8181
(p-val)(0.0226 )(NA )(0.012 )(0.7404 )(NA )(0.4008 )(0.0076 )
Estimates ( 4 )0.500700.599300-0.0257-0.7529
(p-val)(0.0194 )(NA )(0.0824 )(NA )(NA )(0.9743 )(0.3568 )
Estimates ( 5 )0.429200.556000-0.7346
(p-val)(0.0016 )(NA )(0 )(NA )(NA )(NA )(0.2408 )
Estimates ( 6 )0.305400.48340000
(p-val)(0.0211 )(NA )(6e-04 )(NA )(NA )(NA )(NA )
Estimates ( 7 )NANANANANANANA
(p-val)(NA )(NA )(NA )(NA )(NA )(NA )(NA )
Estimates ( 8 )NANANANANANANA
(p-val)(NA )(NA )(NA )(NA )(NA )(NA )(NA )
Estimates ( 9 )NANANANANANANA
(p-val)(NA )(NA )(NA )(NA )(NA )(NA )(NA )
Estimates ( 10 )NANANANANANANA
(p-val)(NA )(NA )(NA )(NA )(NA )(NA )(NA )
Estimates ( 11 )NANANANANANANA
(p-val)(NA )(NA )(NA )(NA )(NA )(NA )(NA )
Estimates ( 12 )NANANANANANANA
(p-val)(NA )(NA )(NA )(NA )(NA )(NA )(NA )
Estimates ( 13 )NANANANANANANA
(p-val)(NA )(NA )(NA )(NA )(NA )(NA )(NA )

\begin{tabular}{lllllllll}
\hline
ARIMA Parameter Estimation and Backward Selection \tabularnewline
Iteration & ar1 & ar2 & ar3 & ma1 & sar1 & sar2 & sma1 \tabularnewline
Estimates ( 1 ) & 0.7857 & -0.1893 & 0.4035 & -0.5154 & 0.1099 & -0.1312 & -0.9449 \tabularnewline
(p-val) & (0.0681 ) & (0.4566 ) & (0.1546 ) & (0.3068 ) & (0.7411 ) & (0.7231 ) & (0.0652 ) \tabularnewline
Estimates ( 2 ) & 0.7514 & -0.1748 & 0.4211 & -0.4732 & 0 & -0.1911 & -0.771 \tabularnewline
(p-val) & (0.1132 ) & (0.5171 ) & (0.1604 ) & (0.4153 ) & (NA ) & (0.4777 ) & (0.0079 ) \tabularnewline
Estimates ( 3 ) & 0.4731 & 0 & 0.5237 & -0.1203 & 0 & -0.2033 & -0.8181 \tabularnewline
(p-val) & (0.0226 ) & (NA ) & (0.012 ) & (0.7404 ) & (NA ) & (0.4008 ) & (0.0076 ) \tabularnewline
Estimates ( 4 ) & 0.5007 & 0 & 0.5993 & 0 & 0 & -0.0257 & -0.7529 \tabularnewline
(p-val) & (0.0194 ) & (NA ) & (0.0824 ) & (NA ) & (NA ) & (0.9743 ) & (0.3568 ) \tabularnewline
Estimates ( 5 ) & 0.4292 & 0 & 0.556 & 0 & 0 & 0 & -0.7346 \tabularnewline
(p-val) & (0.0016 ) & (NA ) & (0 ) & (NA ) & (NA ) & (NA ) & (0.2408 ) \tabularnewline
Estimates ( 6 ) & 0.3054 & 0 & 0.4834 & 0 & 0 & 0 & 0 \tabularnewline
(p-val) & (0.0211 ) & (NA ) & (6e-04 ) & (NA ) & (NA ) & (NA ) & (NA ) \tabularnewline
Estimates ( 7 ) & NA & NA & NA & NA & NA & NA & NA \tabularnewline
(p-val) & (NA ) & (NA ) & (NA ) & (NA ) & (NA ) & (NA ) & (NA ) \tabularnewline
Estimates ( 8 ) & NA & NA & NA & NA & NA & NA & NA \tabularnewline
(p-val) & (NA ) & (NA ) & (NA ) & (NA ) & (NA ) & (NA ) & (NA ) \tabularnewline
Estimates ( 9 ) & NA & NA & NA & NA & NA & NA & NA \tabularnewline
(p-val) & (NA ) & (NA ) & (NA ) & (NA ) & (NA ) & (NA ) & (NA ) \tabularnewline
Estimates ( 10 ) & NA & NA & NA & NA & NA & NA & NA \tabularnewline
(p-val) & (NA ) & (NA ) & (NA ) & (NA ) & (NA ) & (NA ) & (NA ) \tabularnewline
Estimates ( 11 ) & NA & NA & NA & NA & NA & NA & NA \tabularnewline
(p-val) & (NA ) & (NA ) & (NA ) & (NA ) & (NA ) & (NA ) & (NA ) \tabularnewline
Estimates ( 12 ) & NA & NA & NA & NA & NA & NA & NA \tabularnewline
(p-val) & (NA ) & (NA ) & (NA ) & (NA ) & (NA ) & (NA ) & (NA ) \tabularnewline
Estimates ( 13 ) & NA & NA & NA & NA & NA & NA & NA \tabularnewline
(p-val) & (NA ) & (NA ) & (NA ) & (NA ) & (NA ) & (NA ) & (NA ) \tabularnewline
\hline
\end{tabular}
%Source: https://freestatistics.org/blog/index.php?pk=302812&T=1

[TABLE]
[ROW][C]ARIMA Parameter Estimation and Backward Selection[/C][/ROW]
[ROW][C]Iteration[/C][C]ar1[/C][C]ar2[/C][C]ar3[/C][C]ma1[/C][C]sar1[/C][C]sar2[/C][C]sma1[/C][/ROW]
[ROW][C]Estimates ( 1 )[/C][C]0.7857[/C][C]-0.1893[/C][C]0.4035[/C][C]-0.5154[/C][C]0.1099[/C][C]-0.1312[/C][C]-0.9449[/C][/ROW]
[ROW][C](p-val)[/C][C](0.0681 )[/C][C](0.4566 )[/C][C](0.1546 )[/C][C](0.3068 )[/C][C](0.7411 )[/C][C](0.7231 )[/C][C](0.0652 )[/C][/ROW]
[ROW][C]Estimates ( 2 )[/C][C]0.7514[/C][C]-0.1748[/C][C]0.4211[/C][C]-0.4732[/C][C]0[/C][C]-0.1911[/C][C]-0.771[/C][/ROW]
[ROW][C](p-val)[/C][C](0.1132 )[/C][C](0.5171 )[/C][C](0.1604 )[/C][C](0.4153 )[/C][C](NA )[/C][C](0.4777 )[/C][C](0.0079 )[/C][/ROW]
[ROW][C]Estimates ( 3 )[/C][C]0.4731[/C][C]0[/C][C]0.5237[/C][C]-0.1203[/C][C]0[/C][C]-0.2033[/C][C]-0.8181[/C][/ROW]
[ROW][C](p-val)[/C][C](0.0226 )[/C][C](NA )[/C][C](0.012 )[/C][C](0.7404 )[/C][C](NA )[/C][C](0.4008 )[/C][C](0.0076 )[/C][/ROW]
[ROW][C]Estimates ( 4 )[/C][C]0.5007[/C][C]0[/C][C]0.5993[/C][C]0[/C][C]0[/C][C]-0.0257[/C][C]-0.7529[/C][/ROW]
[ROW][C](p-val)[/C][C](0.0194 )[/C][C](NA )[/C][C](0.0824 )[/C][C](NA )[/C][C](NA )[/C][C](0.9743 )[/C][C](0.3568 )[/C][/ROW]
[ROW][C]Estimates ( 5 )[/C][C]0.4292[/C][C]0[/C][C]0.556[/C][C]0[/C][C]0[/C][C]0[/C][C]-0.7346[/C][/ROW]
[ROW][C](p-val)[/C][C](0.0016 )[/C][C](NA )[/C][C](0 )[/C][C](NA )[/C][C](NA )[/C][C](NA )[/C][C](0.2408 )[/C][/ROW]
[ROW][C]Estimates ( 6 )[/C][C]0.3054[/C][C]0[/C][C]0.4834[/C][C]0[/C][C]0[/C][C]0[/C][C]0[/C][/ROW]
[ROW][C](p-val)[/C][C](0.0211 )[/C][C](NA )[/C][C](6e-04 )[/C][C](NA )[/C][C](NA )[/C][C](NA )[/C][C](NA )[/C][/ROW]
[ROW][C]Estimates ( 7 )[/C][C]NA[/C][C]NA[/C][C]NA[/C][C]NA[/C][C]NA[/C][C]NA[/C][C]NA[/C][/ROW]
[ROW][C](p-val)[/C][C](NA )[/C][C](NA )[/C][C](NA )[/C][C](NA )[/C][C](NA )[/C][C](NA )[/C][C](NA )[/C][/ROW]
[ROW][C]Estimates ( 8 )[/C][C]NA[/C][C]NA[/C][C]NA[/C][C]NA[/C][C]NA[/C][C]NA[/C][C]NA[/C][/ROW]
[ROW][C](p-val)[/C][C](NA )[/C][C](NA )[/C][C](NA )[/C][C](NA )[/C][C](NA )[/C][C](NA )[/C][C](NA )[/C][/ROW]
[ROW][C]Estimates ( 9 )[/C][C]NA[/C][C]NA[/C][C]NA[/C][C]NA[/C][C]NA[/C][C]NA[/C][C]NA[/C][/ROW]
[ROW][C](p-val)[/C][C](NA )[/C][C](NA )[/C][C](NA )[/C][C](NA )[/C][C](NA )[/C][C](NA )[/C][C](NA )[/C][/ROW]
[ROW][C]Estimates ( 10 )[/C][C]NA[/C][C]NA[/C][C]NA[/C][C]NA[/C][C]NA[/C][C]NA[/C][C]NA[/C][/ROW]
[ROW][C](p-val)[/C][C](NA )[/C][C](NA )[/C][C](NA )[/C][C](NA )[/C][C](NA )[/C][C](NA )[/C][C](NA )[/C][/ROW]
[ROW][C]Estimates ( 11 )[/C][C]NA[/C][C]NA[/C][C]NA[/C][C]NA[/C][C]NA[/C][C]NA[/C][C]NA[/C][/ROW]
[ROW][C](p-val)[/C][C](NA )[/C][C](NA )[/C][C](NA )[/C][C](NA )[/C][C](NA )[/C][C](NA )[/C][C](NA )[/C][/ROW]
[ROW][C]Estimates ( 12 )[/C][C]NA[/C][C]NA[/C][C]NA[/C][C]NA[/C][C]NA[/C][C]NA[/C][C]NA[/C][/ROW]
[ROW][C](p-val)[/C][C](NA )[/C][C](NA )[/C][C](NA )[/C][C](NA )[/C][C](NA )[/C][C](NA )[/C][C](NA )[/C][/ROW]
[ROW][C]Estimates ( 13 )[/C][C]NA[/C][C]NA[/C][C]NA[/C][C]NA[/C][C]NA[/C][C]NA[/C][C]NA[/C][/ROW]
[ROW][C](p-val)[/C][C](NA )[/C][C](NA )[/C][C](NA )[/C][C](NA )[/C][C](NA )[/C][C](NA )[/C][C](NA )[/C][/ROW]
[/TABLE]
Source: https://freestatistics.org/blog/index.php?pk=302812&T=1

Globally Unique Identifier (entire table): ba.freestatistics.org/blog/index.php?pk=302812&T=1

As an alternative you can also use a QR Code:  

The GUIDs for individual cells are displayed in the table below:

ARIMA Parameter Estimation and Backward Selection
Iterationar1ar2ar3ma1sar1sar2sma1
Estimates ( 1 )0.7857-0.18930.4035-0.51540.1099-0.1312-0.9449
(p-val)(0.0681 )(0.4566 )(0.1546 )(0.3068 )(0.7411 )(0.7231 )(0.0652 )
Estimates ( 2 )0.7514-0.17480.4211-0.47320-0.1911-0.771
(p-val)(0.1132 )(0.5171 )(0.1604 )(0.4153 )(NA )(0.4777 )(0.0079 )
Estimates ( 3 )0.473100.5237-0.12030-0.2033-0.8181
(p-val)(0.0226 )(NA )(0.012 )(0.7404 )(NA )(0.4008 )(0.0076 )
Estimates ( 4 )0.500700.599300-0.0257-0.7529
(p-val)(0.0194 )(NA )(0.0824 )(NA )(NA )(0.9743 )(0.3568 )
Estimates ( 5 )0.429200.556000-0.7346
(p-val)(0.0016 )(NA )(0 )(NA )(NA )(NA )(0.2408 )
Estimates ( 6 )0.305400.48340000
(p-val)(0.0211 )(NA )(6e-04 )(NA )(NA )(NA )(NA )
Estimates ( 7 )NANANANANANANA
(p-val)(NA )(NA )(NA )(NA )(NA )(NA )(NA )
Estimates ( 8 )NANANANANANANA
(p-val)(NA )(NA )(NA )(NA )(NA )(NA )(NA )
Estimates ( 9 )NANANANANANANA
(p-val)(NA )(NA )(NA )(NA )(NA )(NA )(NA )
Estimates ( 10 )NANANANANANANA
(p-val)(NA )(NA )(NA )(NA )(NA )(NA )(NA )
Estimates ( 11 )NANANANANANANA
(p-val)(NA )(NA )(NA )(NA )(NA )(NA )(NA )
Estimates ( 12 )NANANANANANANA
(p-val)(NA )(NA )(NA )(NA )(NA )(NA )(NA )
Estimates ( 13 )NANANANANANANA
(p-val)(NA )(NA )(NA )(NA )(NA )(NA )(NA )


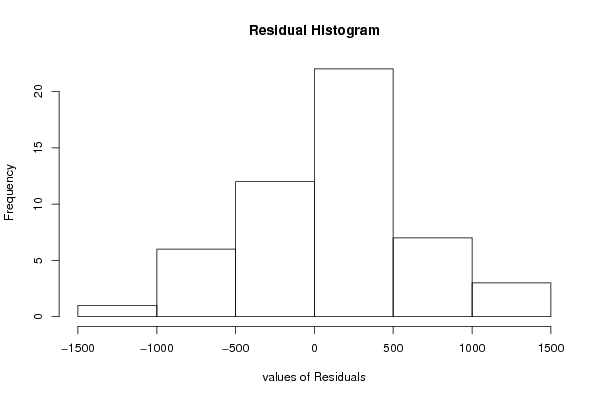
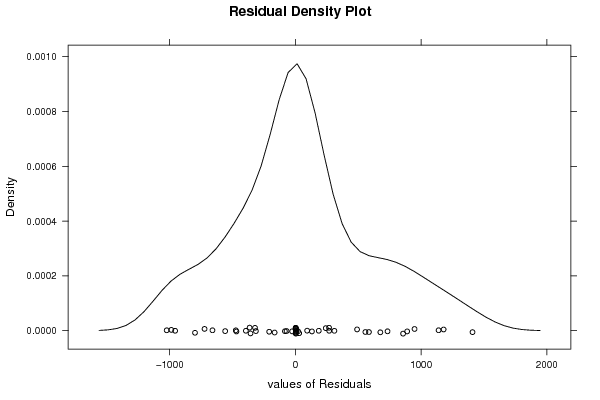
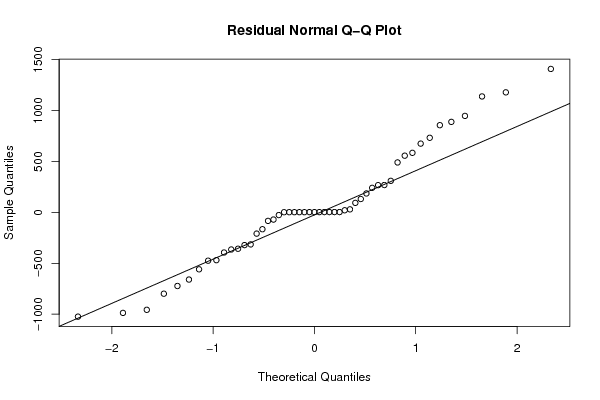
Estimated ARIMA Residuals
Value
2.77993505477141
947.790724741326
-394.004959794654
-26.0158587353006
585.159887897879
-165.273637223185
93.6391089102609
889.290102796088
-987.25995595418
-558.828980201357
-70.2850097673531
30.1949978297593
675.786651169009
268.750551352712
-474.423176466545
-722.818470335247
-321.267222819075
186.043495875209
1139.09604341634
-469.391539262831
-208.42148281923
-798.737812075245
-314.340951493812
310.152562134363
1409.14660007785
557.066281664764
-83.5022174043535
1179.3582209195
-1024.04709947907
-364.257141228104
-659.720849453263
490.691708302317
-357.14564893875
241.260568456569
21.0533012171726
267.731320362485
131.546563170199
-956.857982015219
856.687463632618
733.004841417571

\begin{tabular}{lllllllll}
\hline
Estimated ARIMA Residuals \tabularnewline
Value \tabularnewline
2.77993505477141 \tabularnewline
947.790724741326 \tabularnewline
-394.004959794654 \tabularnewline
-26.0158587353006 \tabularnewline
585.159887897879 \tabularnewline
-165.273637223185 \tabularnewline
93.6391089102609 \tabularnewline
889.290102796088 \tabularnewline
-987.25995595418 \tabularnewline
-558.828980201357 \tabularnewline
-70.2850097673531 \tabularnewline
30.1949978297593 \tabularnewline
675.786651169009 \tabularnewline
268.750551352712 \tabularnewline
-474.423176466545 \tabularnewline
-722.818470335247 \tabularnewline
-321.267222819075 \tabularnewline
186.043495875209 \tabularnewline
1139.09604341634 \tabularnewline
-469.391539262831 \tabularnewline
-208.42148281923 \tabularnewline
-798.737812075245 \tabularnewline
-314.340951493812 \tabularnewline
310.152562134363 \tabularnewline
1409.14660007785 \tabularnewline
557.066281664764 \tabularnewline
-83.5022174043535 \tabularnewline
1179.3582209195 \tabularnewline
-1024.04709947907 \tabularnewline
-364.257141228104 \tabularnewline
-659.720849453263 \tabularnewline
490.691708302317 \tabularnewline
-357.14564893875 \tabularnewline
241.260568456569 \tabularnewline
21.0533012171726 \tabularnewline
267.731320362485 \tabularnewline
131.546563170199 \tabularnewline
-956.857982015219 \tabularnewline
856.687463632618 \tabularnewline
733.004841417571 \tabularnewline
\hline
\end{tabular}
%Source: https://freestatistics.org/blog/index.php?pk=302812&T=2

[TABLE]
[ROW][C]Estimated ARIMA Residuals[/C][/ROW]
[ROW][C]Value[/C][/ROW]
[ROW][C]2.77993505477141[/C][/ROW]
[ROW][C]947.790724741326[/C][/ROW]
[ROW][C]-394.004959794654[/C][/ROW]
[ROW][C]-26.0158587353006[/C][/ROW]
[ROW][C]585.159887897879[/C][/ROW]
[ROW][C]-165.273637223185[/C][/ROW]
[ROW][C]93.6391089102609[/C][/ROW]
[ROW][C]889.290102796088[/C][/ROW]
[ROW][C]-987.25995595418[/C][/ROW]
[ROW][C]-558.828980201357[/C][/ROW]
[ROW][C]-70.2850097673531[/C][/ROW]
[ROW][C]30.1949978297593[/C][/ROW]
[ROW][C]675.786651169009[/C][/ROW]
[ROW][C]268.750551352712[/C][/ROW]
[ROW][C]-474.423176466545[/C][/ROW]
[ROW][C]-722.818470335247[/C][/ROW]
[ROW][C]-321.267222819075[/C][/ROW]
[ROW][C]186.043495875209[/C][/ROW]
[ROW][C]1139.09604341634[/C][/ROW]
[ROW][C]-469.391539262831[/C][/ROW]
[ROW][C]-208.42148281923[/C][/ROW]
[ROW][C]-798.737812075245[/C][/ROW]
[ROW][C]-314.340951493812[/C][/ROW]
[ROW][C]310.152562134363[/C][/ROW]
[ROW][C]1409.14660007785[/C][/ROW]
[ROW][C]557.066281664764[/C][/ROW]
[ROW][C]-83.5022174043535[/C][/ROW]
[ROW][C]1179.3582209195[/C][/ROW]
[ROW][C]-1024.04709947907[/C][/ROW]
[ROW][C]-364.257141228104[/C][/ROW]
[ROW][C]-659.720849453263[/C][/ROW]
[ROW][C]490.691708302317[/C][/ROW]
[ROW][C]-357.14564893875[/C][/ROW]
[ROW][C]241.260568456569[/C][/ROW]
[ROW][C]21.0533012171726[/C][/ROW]
[ROW][C]267.731320362485[/C][/ROW]
[ROW][C]131.546563170199[/C][/ROW]
[ROW][C]-956.857982015219[/C][/ROW]
[ROW][C]856.687463632618[/C][/ROW]
[ROW][C]733.004841417571[/C][/ROW]
[/TABLE]
Source: https://freestatistics.org/blog/index.php?pk=302812&T=2

Globally Unique Identifier (entire table): ba.freestatistics.org/blog/index.php?pk=302812&T=2

As an alternative you can also use a QR Code:  

The GUIDs for individual cells are displayed in the table below:

Estimated ARIMA Residuals
Value
2.77993505477141
947.790724741326
-394.004959794654
-26.0158587353006
585.159887897879
-165.273637223185
93.6391089102609
889.290102796088
-987.25995595418
-558.828980201357
-70.2850097673531
30.1949978297593
675.786651169009
268.750551352712
-474.423176466545
-722.818470335247
-321.267222819075
186.043495875209
1139.09604341634
-469.391539262831
-208.42148281923
-798.737812075245
-314.340951493812
310.152562134363
1409.14660007785
557.066281664764
-83.5022174043535
1179.3582209195
-1024.04709947907
-364.257141228104
-659.720849453263
490.691708302317
-357.14564893875
241.260568456569
21.0533012171726
267.731320362485
131.546563170199
-956.857982015219
856.687463632618
733.004841417571


Parameters (Session):
par1 = pearson ;
Parameters (R input):
par1 = FALSE ; par2 = 1 ; par3 = 0 ; par4 = 1 ; par5 = 12 ; par6 = 3 ; par7 = 1 ; par8 = 2 ; par9 = 1 ;
R code (references can be found in the software module):
library(lattice)
if (par1 == 'TRUE') par1 <- TRUE
if (par1 == 'FALSE') par1 <- FALSE
par2 <- as.numeric(par2) #Box-Cox lambda transformation parameter
par3 <- as.numeric(par3) #degree of non-seasonal differencing
par4 <- as.numeric(par4) #degree of seasonal differencing
par5 <- as.numeric(par5) #seasonal period
par6 <- as.numeric(par6) #degree (p) of the non-seasonal AR(p) polynomial
par7 <- as.numeric(par7) #degree (q) of the non-seasonal MA(q) polynomial
par8 <- as.numeric(par8) #degree (P) of the seasonal AR(P) polynomial
par9 <- as.numeric(par9) #degree (Q) of the seasonal MA(Q) polynomial
armaGR <- function(arima.out, names, n){
try1 <- arima.out$coef
try2 <- sqrt(diag(arima.out$var.coef))
try.data.frame <- data.frame(matrix(NA,ncol=4,nrow=length(names)))
dimnames(try.data.frame) <- list(names,c('coef','std','tstat','pv'))
try.data.frame[,1] <- try1
for(i in 1:length(try2)) try.data.frame[which(rownames(try.data.frame)==names(try2)[i]),2] <- try2[i]
try.data.frame[,3] <- try.data.frame[,1] / try.data.frame[,2]
try.data.frame[,4] <- round((1-pt(abs(try.data.frame[,3]),df=n-(length(try2)+1)))*2,5)
vector <- rep(NA,length(names))
vector[is.na(try.data.frame[,4])] <- 0
maxi <- which.max(try.data.frame[,4])
continue <- max(try.data.frame[,4],na.rm=TRUE) > .05
vector[maxi] <- 0
list(summary=try.data.frame,next.vector=vector,continue=continue)
}
arimaSelect <- function(series, order=c(13,0,0), seasonal=list(order=c(2,0,0),period=12), include.mean=F){
nrc <- order[1]+order[3]+seasonal$order[1]+seasonal$order[3]
coeff <- matrix(NA, nrow=nrc*2, ncol=nrc)
pval <- matrix(NA, nrow=nrc*2, ncol=nrc)
mylist <- rep(list(NULL), nrc)
names <- NULL
if(order[1] > 0) names <- paste('ar',1:order[1],sep='')
if(order[3] > 0) names <- c( names , paste('ma',1:order[3],sep='') )
if(seasonal$order[1] > 0) names <- c(names, paste('sar',1:seasonal$order[1],sep=''))
if(seasonal$order[3] > 0) names <- c(names, paste('sma',1:seasonal$order[3],sep=''))
arima.out <- arima(series, order=order, seasonal=seasonal, include.mean=include.mean, method='ML')
mylist[[1]] <- arima.out
last.arma <- armaGR(arima.out, names, length(series))
mystop <- FALSE
i <- 1
coeff[i,] <- last.arma[[1]][,1]
pval [i,] <- last.arma[[1]][,4]
i <- 2
aic <- arima.out$aic
while(!mystop){
mylist[[i]] <- arima.out
arima.out <- arima(series, order=order, seasonal=seasonal, include.mean=include.mean, method='ML', fixed=last.arma$next.vector)
aic <- c(aic, arima.out$aic)
last.arma <- armaGR(arima.out, names, length(series))
mystop <- !last.arma$continue
coeff[i,] <- last.arma[[1]][,1]
pval [i,] <- last.arma[[1]][,4]
i <- i+1
}
list(coeff, pval, mylist, aic=aic)
}
arimaSelectplot <- function(arimaSelect.out,noms,choix){
noms <- names(arimaSelect.out[[3]][[1]]$coef)
coeff <- arimaSelect.out[[1]]
k <- min(which(is.na(coeff[,1])))-1
coeff <- coeff[1:k,]
pval <- arimaSelect.out[[2]][1:k,]
aic <- arimaSelect.out$aic[1:k]
coeff[coeff==0] <- NA
n <- ncol(coeff)
if(missing(choix)) choix <- k
layout(matrix(c(1,1,1,2,
3,3,3,2,
3,3,3,4,
5,6,7,7),nr=4),
widths=c(10,35,45,15),
heights=c(30,30,15,15))
couleurs <- rainbow(75)[1:50]#(50)
ticks <- pretty(coeff)
par(mar=c(1,1,3,1))
plot(aic,k:1-.5,type='o',pch=21,bg='blue',cex=2,axes=F,lty=2,xpd=NA)
points(aic[choix],k-choix+.5,pch=21,cex=4,bg=2,xpd=NA)
title('aic',line=2)
par(mar=c(3,0,0,0))
plot(0,axes=F,xlab='',ylab='',xlim=range(ticks),ylim=c(.1,1))
rect(xleft = min(ticks) + (0:49)/50*(max(ticks)-min(ticks)),
xright = min(ticks) + (1:50)/50*(max(ticks)-min(ticks)),
ytop = rep(1,50),
ybottom= rep(0,50),col=couleurs,border=NA)
axis(1,ticks)
rect(xleft=min(ticks),xright=max(ticks),ytop=1,ybottom=0)
text(mean(coeff,na.rm=T),.5,'coefficients',cex=2,font=2)
par(mar=c(1,1,3,1))
image(1:n,1:k,t(coeff[k:1,]),axes=F,col=couleurs,zlim=range(ticks))
for(i in 1:n) for(j in 1:k) if(!is.na(coeff[j,i])) {
if(pval[j,i]<.01) symb = 'green'
else if( (pval[j,i]<.05) & (pval[j,i]>=.01)) symb = 'orange'
else if( (pval[j,i]<.1) & (pval[j,i]>=.05)) symb = 'red'
else symb = 'black'
polygon(c(i+.5 ,i+.2 ,i+.5 ,i+.5),
c(k-j+0.5,k-j+0.5,k-j+0.8,k-j+0.5),
col=symb)
if(j==choix) {
rect(xleft=i-.5,
xright=i+.5,
ybottom=k-j+1.5,
ytop=k-j+.5,
lwd=4)
text(i,
k-j+1,
round(coeff[j,i],2),
cex=1.2,
font=2)
}
else{
rect(xleft=i-.5,xright=i+.5,ybottom=k-j+1.5,ytop=k-j+.5)
text(i,k-j+1,round(coeff[j,i],2),cex=1.2,font=1)
}
}
axis(3,1:n,noms)
par(mar=c(0.5,0,0,0.5))
plot(0,axes=F,xlab='',ylab='',type='n',xlim=c(0,8),ylim=c(-.2,.8))
cols <- c('green','orange','red','black')
niv <- c('0','0.01','0.05','0.1')
for(i in 0:3){
polygon(c(1+2*i ,1+2*i ,1+2*i-.5 ,1+2*i),
c(.4 ,.7 , .4 , .4),
col=cols[i+1])
text(2*i,0.5,niv[i+1],cex=1.5)
}
text(8,.5,1,cex=1.5)
text(4,0,'p-value',cex=2)
box()
residus <- arimaSelect.out[[3]][[choix]]$res
par(mar=c(1,2,4,1))
acf(residus,main='')
title('acf',line=.5)
par(mar=c(1,2,4,1))
pacf(residus,main='')
title('pacf',line=.5)
par(mar=c(2,2,4,1))
qqnorm(residus,main='')
title('qq-norm',line=.5)
qqline(residus)
residus
}
if (par2 == 0) x <- log(x)
if (par2 != 0) x <- x^par2
(selection <- arimaSelect(x, order=c(par6,par3,par7), seasonal=list(order=c(par8,par4,par9), period=par5)))
bitmap(file='test1.png')
resid <- arimaSelectplot(selection)
dev.off()
resid
bitmap(file='test2.png')
acf(resid,length(resid)/2, main='Residual Autocorrelation Function')
dev.off()
bitmap(file='test3.png')
pacf(resid,length(resid)/2, main='Residual Partial Autocorrelation Function')
dev.off()
bitmap(file='test4.png')
cpgram(resid, main='Residual Cumulative Periodogram')
dev.off()
bitmap(file='test5.png')
hist(resid, main='Residual Histogram', xlab='values of Residuals')
dev.off()
bitmap(file='test6.png')
densityplot(~resid,col='black',main='Residual Density Plot', xlab='values of Residuals')
dev.off()
bitmap(file='test7.png')
qqnorm(resid, main='Residual Normal Q-Q Plot')
qqline(resid)
dev.off()
ncols <- length(selection[[1]][1,])
nrows <- length(selection[[2]][,1])-1
load(file='createtable')
a<-table.start()
a<-table.row.start(a)
a<-table.element(a,'ARIMA Parameter Estimation and Backward Selection', ncols+1,TRUE)
a<-table.row.end(a)
a<-table.row.start(a)
a<-table.element(a,'Iteration', header=TRUE)
for (i in 1:ncols) {
a<-table.element(a,names(selection[[3]][[1]]$coef)[i],header=TRUE)
}
a<-table.row.end(a)
for (j in 1:nrows) {
a<-table.row.start(a)
mydum <- 'Estimates ('
mydum <- paste(mydum,j)
mydum <- paste(mydum,')')
a<-table.element(a,mydum, header=TRUE)
for (i in 1:ncols) {
a<-table.element(a,round(selection[[1]][j,i],4))
}
a<-table.row.end(a)
a<-table.row.start(a)
a<-table.element(a,'(p-val)', header=TRUE)
for (i in 1:ncols) {
mydum <- '('
mydum <- paste(mydum,round(selection[[2]][j,i],4),sep='')
mydum <- paste(mydum,')')
a<-table.element(a,mydum)
}
a<-table.row.end(a)
}
a<-table.end(a)
table.save(a,file='mytable.tab')
a<-table.start()
a<-table.row.start(a)
a<-table.element(a,'Estimated ARIMA Residuals', 1,TRUE)
a<-table.row.end(a)
a<-table.row.start(a)
a<-table.element(a,'Value', 1,TRUE)
a<-table.row.end(a)
for (i in (par4*par5+par3):length(resid)) {
a<-table.row.start(a)
a<-table.element(a,resid[i])
a<-table.row.end(a)
}
a<-table.end(a)
table.save(a,file='mytable1.tab')