Free Statistics

of Irreproducible Research!

Author's title

Author*The author of this computation has been verified*
R Software Modulerwasp_histogram.wasp
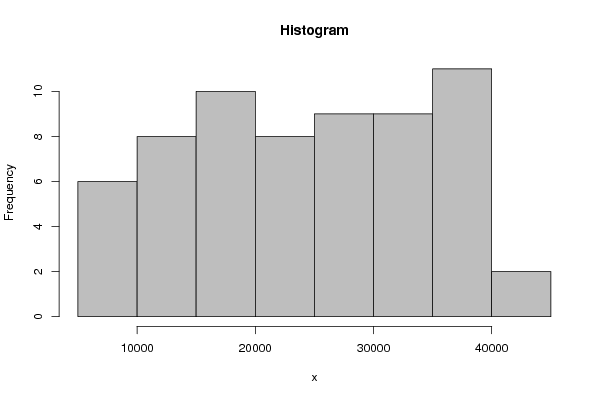
Title produced by softwareHistogram
Date of computationFri, 23 Dec 2016 10:29:45 +0100
Cite this page as followsStatistical Computations at FreeStatistics.org, Office for Research Development and Education, URL https://freestatistics.org/blog/index.php?v=date/2016/Dec/23/t14824855011tx8810rizffqg4.htm/, Retrieved Tue, 07 May 2024 19:24:35 +0000
Statistical Computations at FreeStatistics.org, Office for Research Development and Education, URL https://freestatistics.org/blog/index.php?pk=302813, Retrieved Tue, 07 May 2024 19:24:35 +0000
QR Codes:

Original text written by user:
IsPrivate?No (this computation is public)
User-defined keywords
Estimated Impact65
Family? (F = Feedback message, R = changed R code, M = changed R Module, P = changed Parameters, D = changed Data)
-       [Histogram] [] [2016-12-23 09:29:45] [9412b5b3b31fe4708efb1e5c8c74b28f] [Current]
Feedback Forum

Post a new message
Dataseries X:
40548
40331
39814
39360
38915
38583
38191
37477
37110
36670
36330
36108
35341
34764
34253
33743
33296
32875
32622
32346
31780
31003
28467
28153
27682
27217
26780
26490
26020
25227
25343
24453
23958
23475
23102
22393
21557
20893
20376
19704
19016
18274
18020
17317
16919
16372
16069
15478
15018
14561
14047
13506
13035
12471
11815
11172
10594
9914
9319
8939
8073
7431
7022


Summary of computational transaction
Raw Input view raw input (R code)
Raw Outputview raw output of R engine
Computing time0 seconds
R ServerBig Analytics Cloud Computing Center

\begin{tabular}{lllllllll}
\hline
Summary of computational transaction \tabularnewline
Raw Input view raw input (R code)  \tabularnewline
Raw Outputview raw output of R engine  \tabularnewline
Computing time0 seconds \tabularnewline
R ServerBig Analytics Cloud Computing Center \tabularnewline
\hline
\end{tabular}
%Source: https://freestatistics.org/blog/index.php?pk=302813&T=0

[TABLE]
[ROW]
Summary of computational transaction[/C][/ROW] [ROW]Raw Input[/C] view raw input (R code) [/C][/ROW] [ROW]Raw Output[/C]view raw output of R engine [/C][/ROW] [ROW]Computing time[/C]0 seconds[/C][/ROW] [ROW]R Server[/C]Big Analytics Cloud Computing Center[/C][/ROW] [/TABLE] Source: https://freestatistics.org/blog/index.php?pk=302813&T=0

Globally Unique Identifier (entire table): ba.freestatistics.org/blog/index.php?pk=302813&T=0

As an alternative you can also use a QR Code:  

The GUIDs for individual cells are displayed in the table below:

Summary of computational transaction
Raw Input view raw input (R code)
Raw Outputview raw output of R engine
Computing time0 seconds
R ServerBig Analytics Cloud Computing Center


Frequency Table (Histogram)
BinsMidpointAbs. FrequencyRel. FrequencyCumul. Rel. Freq.Density
[5000,10000[750060.0952380.0952381.9e-05
[10000,15000[1250080.1269840.2222222.5e-05
[15000,20000[17500100.158730.3809523.2e-05
[20000,25000[2250080.1269840.5079372.5e-05
[25000,30000[2750090.1428570.6507942.9e-05
[30000,35000[3250090.1428570.7936512.9e-05
[35000,40000[37500110.1746030.9682543.5e-05
[40000,45000]4250020.03174616e-06

\begin{tabular}{lllllllll}
\hline
Frequency Table (Histogram) \tabularnewline
Bins & Midpoint & Abs. Frequency & Rel. Frequency & Cumul. Rel. Freq. & Density \tabularnewline
[5000,10000[ & 7500 & 6 & 0.095238 & 0.095238 & 1.9e-05 \tabularnewline
[10000,15000[ & 12500 & 8 & 0.126984 & 0.222222 & 2.5e-05 \tabularnewline
[15000,20000[ & 17500 & 10 & 0.15873 & 0.380952 & 3.2e-05 \tabularnewline
[20000,25000[ & 22500 & 8 & 0.126984 & 0.507937 & 2.5e-05 \tabularnewline
[25000,30000[ & 27500 & 9 & 0.142857 & 0.650794 & 2.9e-05 \tabularnewline
[30000,35000[ & 32500 & 9 & 0.142857 & 0.793651 & 2.9e-05 \tabularnewline
[35000,40000[ & 37500 & 11 & 0.174603 & 0.968254 & 3.5e-05 \tabularnewline
[40000,45000] & 42500 & 2 & 0.031746 & 1 & 6e-06 \tabularnewline
\hline
\end{tabular}
%Source: https://freestatistics.org/blog/index.php?pk=302813&T=1

[TABLE]
[ROW][C]Frequency Table (Histogram)[/C][/ROW]
[ROW][C]Bins[/C][C]Midpoint[/C][C]Abs. Frequency[/C][C]Rel. Frequency[/C][C]Cumul. Rel. Freq.[/C][C]Density[/C][/ROW]
[ROW][C][5000,10000[[/C][C]7500[/C][C]6[/C][C]0.095238[/C][C]0.095238[/C][C]1.9e-05[/C][/ROW]
[ROW][C][10000,15000[[/C][C]12500[/C][C]8[/C][C]0.126984[/C][C]0.222222[/C][C]2.5e-05[/C][/ROW]
[ROW][C][15000,20000[[/C][C]17500[/C][C]10[/C][C]0.15873[/C][C]0.380952[/C][C]3.2e-05[/C][/ROW]
[ROW][C][20000,25000[[/C][C]22500[/C][C]8[/C][C]0.126984[/C][C]0.507937[/C][C]2.5e-05[/C][/ROW]
[ROW][C][25000,30000[[/C][C]27500[/C][C]9[/C][C]0.142857[/C][C]0.650794[/C][C]2.9e-05[/C][/ROW]
[ROW][C][30000,35000[[/C][C]32500[/C][C]9[/C][C]0.142857[/C][C]0.793651[/C][C]2.9e-05[/C][/ROW]
[ROW][C][35000,40000[[/C][C]37500[/C][C]11[/C][C]0.174603[/C][C]0.968254[/C][C]3.5e-05[/C][/ROW]
[ROW][C][40000,45000][/C][C]42500[/C][C]2[/C][C]0.031746[/C][C]1[/C][C]6e-06[/C][/ROW]
[/TABLE]
Source: https://freestatistics.org/blog/index.php?pk=302813&T=1

Globally Unique Identifier (entire table): ba.freestatistics.org/blog/index.php?pk=302813&T=1

As an alternative you can also use a QR Code:  

The GUIDs for individual cells are displayed in the table below:

Frequency Table (Histogram)
BinsMidpointAbs. FrequencyRel. FrequencyCumul. Rel. Freq.Density
[5000,10000[750060.0952380.0952381.9e-05
[10000,15000[1250080.1269840.2222222.5e-05
[15000,20000[17500100.158730.3809523.2e-05
[20000,25000[2250080.1269840.5079372.5e-05
[25000,30000[2750090.1428570.6507942.9e-05
[30000,35000[3250090.1428570.7936512.9e-05
[35000,40000[37500110.1746030.9682543.5e-05
[40000,45000]4250020.03174616e-06


Parameters (Session):
Parameters (R input):
par1 = ; par2 = grey ; par3 = FALSE ; par4 = Unknown ;
R code (references can be found in the software module):
par1 <- as.numeric(par1)
if (par3 == 'TRUE') par3 <- TRUE
if (par3 == 'FALSE') par3 <- FALSE
if (par4 == 'Unknown') par1 <- as.numeric(par1)
if (par4 == 'Interval/Ratio') par1 <- as.numeric(par1)
if (par4 == '3-point Likert') par1 <- c(1:3 - 0.5, 3.5)
if (par4 == '4-point Likert') par1 <- c(1:4 - 0.5, 4.5)
if (par4 == '5-point Likert') par1 <- c(1:5 - 0.5, 5.5)
if (par4 == '6-point Likert') par1 <- c(1:6 - 0.5, 6.5)
if (par4 == '7-point Likert') par1 <- c(1:7 - 0.5, 7.5)
if (par4 == '8-point Likert') par1 <- c(1:8 - 0.5, 8.5)
if (par4 == '9-point Likert') par1 <- c(1:9 - 0.5, 9.5)
if (par4 == '10-point Likert') par1 <- c(1:10 - 0.5, 10.5)
bitmap(file='test1.png')
if(is.numeric(x[1])) {
if (is.na(par1)) {
myhist<-hist(x,col=par2,main=main,xlab=xlab,right=par3)
} else {
if (par1 < 0) par1 <- 3
if (par1 > 50) par1 <- 50
myhist<-hist(x,breaks=par1,col=par2,main=main,xlab=xlab,right=par3)
}
} else {
barplot(mytab <- sort(table(x),T),col=par2,main='Frequency Plot',xlab=xlab,ylab='Absolute Frequency')
}
dev.off()
if(is.numeric(x[1])) {
myhist
n <- length(x)
load(file='createtable')
a<-table.start()
a<-table.row.start(a)
a<-table.element(a,'Frequency Table (Histogram)',6,TRUE)
a<-table.row.end(a)
a<-table.row.start(a)
a<-table.element(a,'Bins',header=TRUE)
a<-table.element(a,'Midpoint',header=TRUE)
a<-table.element(a,'Abs. Frequency',header=TRUE)
a<-table.element(a,'Rel. Frequency',header=TRUE)
a<-table.element(a,'Cumul. Rel. Freq.',header=TRUE)
a<-table.element(a,'Density',header=TRUE)
a<-table.row.end(a)
crf <- 0
if (par3 == FALSE) mybracket <- '[' else mybracket <- ']'
mynumrows <- (length(myhist$breaks)-1)
for (i in 1:mynumrows) {
a<-table.row.start(a)
if (i == 1)
dum <- paste('[',myhist$breaks[i],sep='')
else
dum <- paste(mybracket,myhist$breaks[i],sep='')
dum <- paste(dum,myhist$breaks[i+1],sep=',')
if (i==mynumrows)
dum <- paste(dum,']',sep='')
else
dum <- paste(dum,mybracket,sep='')
a<-table.element(a,dum,header=TRUE)
a<-table.element(a,myhist$mids[i])
a<-table.element(a,myhist$counts[i])
rf <- myhist$counts[i]/n
crf <- crf + rf
a<-table.element(a,round(rf,6))
a<-table.element(a,round(crf,6))
a<-table.element(a,round(myhist$density[i],6))
a<-table.row.end(a)
}
a<-table.end(a)
table.save(a,file='mytable.tab')
} else {
mytab
reltab <- mytab / sum(mytab)
n <- length(mytab)
load(file='createtable')
a<-table.start()
a<-table.row.start(a)
a<-table.element(a,'Frequency Table (Categorical Data)',3,TRUE)
a<-table.row.end(a)
a<-table.row.start(a)
a<-table.element(a,'Category',header=TRUE)
a<-table.element(a,'Abs. Frequency',header=TRUE)
a<-table.element(a,'Rel. Frequency',header=TRUE)
a<-table.row.end(a)
for (i in 1:n) {
a<-table.row.start(a)
a<-table.element(a,labels(mytab)$x[i],header=TRUE)
a<-table.element(a,mytab[i])
a<-table.element(a,round(reltab[i],4))
a<-table.row.end(a)
}
a<-table.end(a)
table.save(a,file='mytable1.tab')
}