Free Statistics

of Irreproducible Research!

Author's title

Author*The author of this computation has been verified*
R Software Modulerwasp_arimabackwardselection.wasp
Title produced by softwareARIMA Backward Selection
Date of computationFri, 23 Dec 2016 11:57:57 +0100
Cite this page as followsStatistical Computations at FreeStatistics.org, Office for Research Development and Education, URL https://freestatistics.org/blog/index.php?v=date/2016/Dec/23/t1482490706svvxvjdi4m9vyt6.htm/, Retrieved Tue, 07 May 2024 06:35:04 +0000
Statistical Computations at FreeStatistics.org, Office for Research Development and Education, URL https://freestatistics.org/blog/index.php?pk=302860, Retrieved Tue, 07 May 2024 06:35:04 +0000
QR Codes:

Original text written by user:
IsPrivate?No (this computation is public)
User-defined keywords
Estimated Impact62
Family? (F = Feedback message, R = changed R code, M = changed R Module, P = changed Parameters, D = changed Data)
-       [ARIMA Backward Selection] [ARIMA Backward Se...] [2016-12-23 10:57:57] [55eb8f21ed24cda91766c505eb72bb6f] [Current]
Feedback Forum

Post a new message
Dataseries X:
3949.9
4010.65
4381.8
4238.25
4178.1
4702.25
3944.1
4208.5
4743.45
4948.25
4735.45
4843.15
4757.75
5227.15
5739.65
4981.45
5020.05
5149.15
4513.35
4762.55
4990.45
4963.35
5010
4983.3
4924.7
5175.25
5470.3
4969.4
5020.5
5519.2
4510.75
4934.45
5430.65
5254.7
4897.8
5305.7
5055.7
5409
5683
5125.55
4965.2
5373.3
4556.1
4714.25
5513.85
5258.45
5111.4
5422.25
4753.3
5455.5
5909.15
5524.4
5477.8
5907.75
5072.55
5171
5871.4
5812.45
5692.2
5838.1
5438.2
6041.05
6335.6
5891.8
5909.65
6449.75
5312.25
5828.1
6466.15
6328.35
6131.8
6734.2
6037.25
6412.4
6785.55
6386
6045.25
6597.25
5355.9
5773.35
6539.6
6149.2
6373.45
6504.7
5451.25
6119.9
6954.95
6139.7
6383.25
6643.7
5547.75
5974
6583.6
6571.55
5736.5
6027.2
5302.65
5825.85
5910.6
5733.65
5914.3
6128.25
5680.5
5926.3
6270.5
6263
6064.55
5706.6
5365
5884.2
6504.4
6174.3
6123.65
6698.95
5256.55
5838.2


Summary of computational transaction
Raw Input view raw input (R code)
Raw Outputview raw output of R engine
Computing time7 seconds
R ServerBig Analytics Cloud Computing Center

\begin{tabular}{lllllllll}
\hline
Summary of computational transaction \tabularnewline
Raw Input view raw input (R code)  \tabularnewline
Raw Outputview raw output of R engine  \tabularnewline
Computing time7 seconds \tabularnewline
R ServerBig Analytics Cloud Computing Center \tabularnewline
\hline
\end{tabular}
%Source: https://freestatistics.org/blog/index.php?pk=302860&T=0

[TABLE]
[ROW]
Summary of computational transaction[/C][/ROW] [ROW]Raw Input[/C] view raw input (R code) [/C][/ROW] [ROW]Raw Output[/C]view raw output of R engine [/C][/ROW] [ROW]Computing time[/C]7 seconds[/C][/ROW] [ROW]R Server[/C]Big Analytics Cloud Computing Center[/C][/ROW] [/TABLE] Source: https://freestatistics.org/blog/index.php?pk=302860&T=0

Globally Unique Identifier (entire table): ba.freestatistics.org/blog/index.php?pk=302860&T=0

As an alternative you can also use a QR Code:  

The GUIDs for individual cells are displayed in the table below:

Summary of computational transaction
Raw Input view raw input (R code)
Raw Outputview raw output of R engine
Computing time7 seconds
R ServerBig Analytics Cloud Computing Center


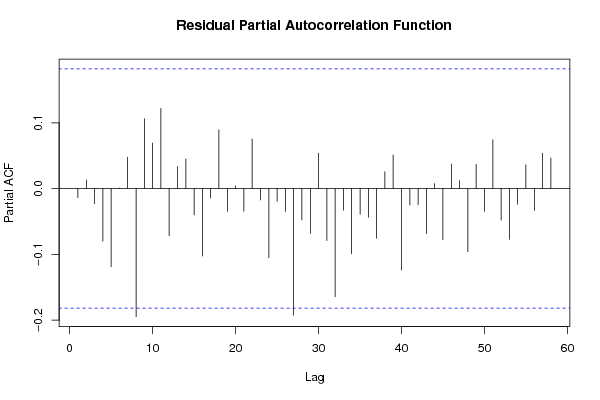
ARIMA Parameter Estimation and Backward Selection
Iterationar1ar2ar3ma1sar1sar2sma1
Estimates ( 1 )-0.4378-0.18840.1148-0.0355-0.4922-0.2161-0.2948
(p-val)(0.3826 )(0.4823 )(0.4822 )(0.9433 )(0.1133 )(0.3316 )(0.357 )
Estimates ( 2 )-0.4728-0.2060.10560-0.4909-0.2148-0.2969
(p-val)(0 )(0.0635 )(0.3209 )(NA )(0.1132 )(0.333 )(0.3504 )
Estimates ( 3 )-0.4759-0.19870.11240-0.7478-0.35970
(p-val)(0 )(0.0722 )(0.2905 )(NA )(0 )(0.002 )(NA )
Estimates ( 4 )-0.5041-0.252400-0.7168-0.36670
(p-val)(0 )(0.0112 )(NA )(NA )(0 )(0.0017 )(NA )
Estimates ( 5 )NANANANANANANA
(p-val)(NA )(NA )(NA )(NA )(NA )(NA )(NA )
Estimates ( 6 )NANANANANANANA
(p-val)(NA )(NA )(NA )(NA )(NA )(NA )(NA )
Estimates ( 7 )NANANANANANANA
(p-val)(NA )(NA )(NA )(NA )(NA )(NA )(NA )
Estimates ( 8 )NANANANANANANA
(p-val)(NA )(NA )(NA )(NA )(NA )(NA )(NA )
Estimates ( 9 )NANANANANANANA
(p-val)(NA )(NA )(NA )(NA )(NA )(NA )(NA )
Estimates ( 10 )NANANANANANANA
(p-val)(NA )(NA )(NA )(NA )(NA )(NA )(NA )
Estimates ( 11 )NANANANANANANA
(p-val)(NA )(NA )(NA )(NA )(NA )(NA )(NA )
Estimates ( 12 )NANANANANANANA
(p-val)(NA )(NA )(NA )(NA )(NA )(NA )(NA )
Estimates ( 13 )NANANANANANANA
(p-val)(NA )(NA )(NA )(NA )(NA )(NA )(NA )

\begin{tabular}{lllllllll}
\hline
ARIMA Parameter Estimation and Backward Selection \tabularnewline
Iteration & ar1 & ar2 & ar3 & ma1 & sar1 & sar2 & sma1 \tabularnewline
Estimates ( 1 ) & -0.4378 & -0.1884 & 0.1148 & -0.0355 & -0.4922 & -0.2161 & -0.2948 \tabularnewline
(p-val) & (0.3826 ) & (0.4823 ) & (0.4822 ) & (0.9433 ) & (0.1133 ) & (0.3316 ) & (0.357 ) \tabularnewline
Estimates ( 2 ) & -0.4728 & -0.206 & 0.1056 & 0 & -0.4909 & -0.2148 & -0.2969 \tabularnewline
(p-val) & (0 ) & (0.0635 ) & (0.3209 ) & (NA ) & (0.1132 ) & (0.333 ) & (0.3504 ) \tabularnewline
Estimates ( 3 ) & -0.4759 & -0.1987 & 0.1124 & 0 & -0.7478 & -0.3597 & 0 \tabularnewline
(p-val) & (0 ) & (0.0722 ) & (0.2905 ) & (NA ) & (0 ) & (0.002 ) & (NA ) \tabularnewline
Estimates ( 4 ) & -0.5041 & -0.2524 & 0 & 0 & -0.7168 & -0.3667 & 0 \tabularnewline
(p-val) & (0 ) & (0.0112 ) & (NA ) & (NA ) & (0 ) & (0.0017 ) & (NA ) \tabularnewline
Estimates ( 5 ) & NA & NA & NA & NA & NA & NA & NA \tabularnewline
(p-val) & (NA ) & (NA ) & (NA ) & (NA ) & (NA ) & (NA ) & (NA ) \tabularnewline
Estimates ( 6 ) & NA & NA & NA & NA & NA & NA & NA \tabularnewline
(p-val) & (NA ) & (NA ) & (NA ) & (NA ) & (NA ) & (NA ) & (NA ) \tabularnewline
Estimates ( 7 ) & NA & NA & NA & NA & NA & NA & NA \tabularnewline
(p-val) & (NA ) & (NA ) & (NA ) & (NA ) & (NA ) & (NA ) & (NA ) \tabularnewline
Estimates ( 8 ) & NA & NA & NA & NA & NA & NA & NA \tabularnewline
(p-val) & (NA ) & (NA ) & (NA ) & (NA ) & (NA ) & (NA ) & (NA ) \tabularnewline
Estimates ( 9 ) & NA & NA & NA & NA & NA & NA & NA \tabularnewline
(p-val) & (NA ) & (NA ) & (NA ) & (NA ) & (NA ) & (NA ) & (NA ) \tabularnewline
Estimates ( 10 ) & NA & NA & NA & NA & NA & NA & NA \tabularnewline
(p-val) & (NA ) & (NA ) & (NA ) & (NA ) & (NA ) & (NA ) & (NA ) \tabularnewline
Estimates ( 11 ) & NA & NA & NA & NA & NA & NA & NA \tabularnewline
(p-val) & (NA ) & (NA ) & (NA ) & (NA ) & (NA ) & (NA ) & (NA ) \tabularnewline
Estimates ( 12 ) & NA & NA & NA & NA & NA & NA & NA \tabularnewline
(p-val) & (NA ) & (NA ) & (NA ) & (NA ) & (NA ) & (NA ) & (NA ) \tabularnewline
Estimates ( 13 ) & NA & NA & NA & NA & NA & NA & NA \tabularnewline
(p-val) & (NA ) & (NA ) & (NA ) & (NA ) & (NA ) & (NA ) & (NA ) \tabularnewline
\hline
\end{tabular}
%Source: https://freestatistics.org/blog/index.php?pk=302860&T=1

[TABLE]
[ROW][C]ARIMA Parameter Estimation and Backward Selection[/C][/ROW]
[ROW][C]Iteration[/C][C]ar1[/C][C]ar2[/C][C]ar3[/C][C]ma1[/C][C]sar1[/C][C]sar2[/C][C]sma1[/C][/ROW]
[ROW][C]Estimates ( 1 )[/C][C]-0.4378[/C][C]-0.1884[/C][C]0.1148[/C][C]-0.0355[/C][C]-0.4922[/C][C]-0.2161[/C][C]-0.2948[/C][/ROW]
[ROW][C](p-val)[/C][C](0.3826 )[/C][C](0.4823 )[/C][C](0.4822 )[/C][C](0.9433 )[/C][C](0.1133 )[/C][C](0.3316 )[/C][C](0.357 )[/C][/ROW]
[ROW][C]Estimates ( 2 )[/C][C]-0.4728[/C][C]-0.206[/C][C]0.1056[/C][C]0[/C][C]-0.4909[/C][C]-0.2148[/C][C]-0.2969[/C][/ROW]
[ROW][C](p-val)[/C][C](0 )[/C][C](0.0635 )[/C][C](0.3209 )[/C][C](NA )[/C][C](0.1132 )[/C][C](0.333 )[/C][C](0.3504 )[/C][/ROW]
[ROW][C]Estimates ( 3 )[/C][C]-0.4759[/C][C]-0.1987[/C][C]0.1124[/C][C]0[/C][C]-0.7478[/C][C]-0.3597[/C][C]0[/C][/ROW]
[ROW][C](p-val)[/C][C](0 )[/C][C](0.0722 )[/C][C](0.2905 )[/C][C](NA )[/C][C](0 )[/C][C](0.002 )[/C][C](NA )[/C][/ROW]
[ROW][C]Estimates ( 4 )[/C][C]-0.5041[/C][C]-0.2524[/C][C]0[/C][C]0[/C][C]-0.7168[/C][C]-0.3667[/C][C]0[/C][/ROW]
[ROW][C](p-val)[/C][C](0 )[/C][C](0.0112 )[/C][C](NA )[/C][C](NA )[/C][C](0 )[/C][C](0.0017 )[/C][C](NA )[/C][/ROW]
[ROW][C]Estimates ( 5 )[/C][C]NA[/C][C]NA[/C][C]NA[/C][C]NA[/C][C]NA[/C][C]NA[/C][C]NA[/C][/ROW]
[ROW][C](p-val)[/C][C](NA )[/C][C](NA )[/C][C](NA )[/C][C](NA )[/C][C](NA )[/C][C](NA )[/C][C](NA )[/C][/ROW]
[ROW][C]Estimates ( 6 )[/C][C]NA[/C][C]NA[/C][C]NA[/C][C]NA[/C][C]NA[/C][C]NA[/C][C]NA[/C][/ROW]
[ROW][C](p-val)[/C][C](NA )[/C][C](NA )[/C][C](NA )[/C][C](NA )[/C][C](NA )[/C][C](NA )[/C][C](NA )[/C][/ROW]
[ROW][C]Estimates ( 7 )[/C][C]NA[/C][C]NA[/C][C]NA[/C][C]NA[/C][C]NA[/C][C]NA[/C][C]NA[/C][/ROW]
[ROW][C](p-val)[/C][C](NA )[/C][C](NA )[/C][C](NA )[/C][C](NA )[/C][C](NA )[/C][C](NA )[/C][C](NA )[/C][/ROW]
[ROW][C]Estimates ( 8 )[/C][C]NA[/C][C]NA[/C][C]NA[/C][C]NA[/C][C]NA[/C][C]NA[/C][C]NA[/C][/ROW]
[ROW][C](p-val)[/C][C](NA )[/C][C](NA )[/C][C](NA )[/C][C](NA )[/C][C](NA )[/C][C](NA )[/C][C](NA )[/C][/ROW]
[ROW][C]Estimates ( 9 )[/C][C]NA[/C][C]NA[/C][C]NA[/C][C]NA[/C][C]NA[/C][C]NA[/C][C]NA[/C][/ROW]
[ROW][C](p-val)[/C][C](NA )[/C][C](NA )[/C][C](NA )[/C][C](NA )[/C][C](NA )[/C][C](NA )[/C][C](NA )[/C][/ROW]
[ROW][C]Estimates ( 10 )[/C][C]NA[/C][C]NA[/C][C]NA[/C][C]NA[/C][C]NA[/C][C]NA[/C][C]NA[/C][/ROW]
[ROW][C](p-val)[/C][C](NA )[/C][C](NA )[/C][C](NA )[/C][C](NA )[/C][C](NA )[/C][C](NA )[/C][C](NA )[/C][/ROW]
[ROW][C]Estimates ( 11 )[/C][C]NA[/C][C]NA[/C][C]NA[/C][C]NA[/C][C]NA[/C][C]NA[/C][C]NA[/C][/ROW]
[ROW][C](p-val)[/C][C](NA )[/C][C](NA )[/C][C](NA )[/C][C](NA )[/C][C](NA )[/C][C](NA )[/C][C](NA )[/C][/ROW]
[ROW][C]Estimates ( 12 )[/C][C]NA[/C][C]NA[/C][C]NA[/C][C]NA[/C][C]NA[/C][C]NA[/C][C]NA[/C][/ROW]
[ROW][C](p-val)[/C][C](NA )[/C][C](NA )[/C][C](NA )[/C][C](NA )[/C][C](NA )[/C][C](NA )[/C][C](NA )[/C][/ROW]
[ROW][C]Estimates ( 13 )[/C][C]NA[/C][C]NA[/C][C]NA[/C][C]NA[/C][C]NA[/C][C]NA[/C][C]NA[/C][/ROW]
[ROW][C](p-val)[/C][C](NA )[/C][C](NA )[/C][C](NA )[/C][C](NA )[/C][C](NA )[/C][C](NA )[/C][C](NA )[/C][/ROW]
[/TABLE]
Source: https://freestatistics.org/blog/index.php?pk=302860&T=1

Globally Unique Identifier (entire table): ba.freestatistics.org/blog/index.php?pk=302860&T=1

As an alternative you can also use a QR Code:  

The GUIDs for individual cells are displayed in the table below:

ARIMA Parameter Estimation and Backward Selection
Iterationar1ar2ar3ma1sar1sar2sma1
Estimates ( 1 )-0.4378-0.18840.1148-0.0355-0.4922-0.2161-0.2948
(p-val)(0.3826 )(0.4823 )(0.4822 )(0.9433 )(0.1133 )(0.3316 )(0.357 )
Estimates ( 2 )-0.4728-0.2060.10560-0.4909-0.2148-0.2969
(p-val)(0 )(0.0635 )(0.3209 )(NA )(0.1132 )(0.333 )(0.3504 )
Estimates ( 3 )-0.4759-0.19870.11240-0.7478-0.35970
(p-val)(0 )(0.0722 )(0.2905 )(NA )(0 )(0.002 )(NA )
Estimates ( 4 )-0.5041-0.252400-0.7168-0.36670
(p-val)(0 )(0.0112 )(NA )(NA )(0 )(0.0017 )(NA )
Estimates ( 5 )NANANANANANANA
(p-val)(NA )(NA )(NA )(NA )(NA )(NA )(NA )
Estimates ( 6 )NANANANANANANA
(p-val)(NA )(NA )(NA )(NA )(NA )(NA )(NA )
Estimates ( 7 )NANANANANANANA
(p-val)(NA )(NA )(NA )(NA )(NA )(NA )(NA )
Estimates ( 8 )NANANANANANANA
(p-val)(NA )(NA )(NA )(NA )(NA )(NA )(NA )
Estimates ( 9 )NANANANANANANA
(p-val)(NA )(NA )(NA )(NA )(NA )(NA )(NA )
Estimates ( 10 )NANANANANANANA
(p-val)(NA )(NA )(NA )(NA )(NA )(NA )(NA )
Estimates ( 11 )NANANANANANANA
(p-val)(NA )(NA )(NA )(NA )(NA )(NA )(NA )
Estimates ( 12 )NANANANANANANA
(p-val)(NA )(NA )(NA )(NA )(NA )(NA )(NA )
Estimates ( 13 )NANANANANANANA
(p-val)(NA )(NA )(NA )(NA )(NA )(NA )(NA )


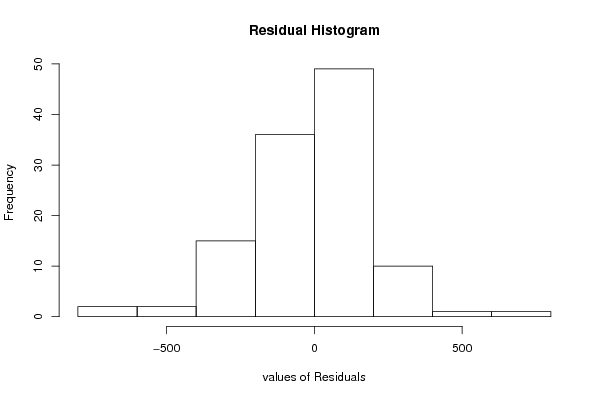
Estimated ARIMA Residuals
Value
-12.4108109889854
280.201522554373
229.522049682473
-341.06795988318
-165.689091622387
-374.576211211887
12.1200996521077
-35.8007232012724
-178.04233648898
-334.220394578995
87.8185709914246
19.7020143764633
-77.6675144775447
-73.1810485665097
-136.379386977407
-127.899587661373
-0.31127836073513
173.645269085456
-199.758969742773
41.491633619068
100.669065308558
-165.580848280218
-355.074489954595
177.136641923639
-79.3531065808779
69.9843302284907
-171.91462723681
-106.932000607124
-243.203510028877
-37.6003073767359
-46.1271540138012
-133.785568512663
313.176223141036
-109.902438023838
-35.0880886022409
81.5624931060276
-435.876145567132
119.632108070389
120.909771411178
394.765525671761
44.2608329325668
102.731165402866
-0.580801623951629
-178.029137832449
119.564469504081
152.361878781325
144.81156938
-71.4520697479929
-153.441333171078
124.229681565874
48.7982443581914
86.5063302848466
68.3968939476408
142.3740729908
-193.280851897949
170.108773472452
44.9244110539594
109.265666034049
1.40663481921638
318.314528352339
-105.236088268272
-236.740794854968
-142.244278418821
66.3979336868779
-215.231994002757
-16.4892352027373
-348.303700148335
82.7418494771227
59.0840323517686
-143.064669573273
246.251818371013
-64.4424592483101
-470.605465612091
-221.34945143892
430.617634931426
-111.762475757495
229.372000537262
-213.857337703517
-43.8531350772864
-20.5688863371606
-23.4225016522496
143.062437673119
-721.535663890894
-354.742163719673
-229.655965351158
52.0037584368092
-386.003928823046
167.566868031843
334.512840112587
-33.0804395233299
605.818709531455
53.9441196226553
-263.819962604639
-85.9312541039745
46.0893627008081
-623.998836063393
145.142582890958
92.6989034795197
315.114125258911
183.816921256478
43.6666991255834
208.167989587818
-385.297769959615
37.9934717928454

\begin{tabular}{lllllllll}
\hline
Estimated ARIMA Residuals \tabularnewline
Value \tabularnewline
-12.4108109889854 \tabularnewline
280.201522554373 \tabularnewline
229.522049682473 \tabularnewline
-341.06795988318 \tabularnewline
-165.689091622387 \tabularnewline
-374.576211211887 \tabularnewline
12.1200996521077 \tabularnewline
-35.8007232012724 \tabularnewline
-178.04233648898 \tabularnewline
-334.220394578995 \tabularnewline
87.8185709914246 \tabularnewline
19.7020143764633 \tabularnewline
-77.6675144775447 \tabularnewline
-73.1810485665097 \tabularnewline
-136.379386977407 \tabularnewline
-127.899587661373 \tabularnewline
-0.31127836073513 \tabularnewline
173.645269085456 \tabularnewline
-199.758969742773 \tabularnewline
41.491633619068 \tabularnewline
100.669065308558 \tabularnewline
-165.580848280218 \tabularnewline
-355.074489954595 \tabularnewline
177.136641923639 \tabularnewline
-79.3531065808779 \tabularnewline
69.9843302284907 \tabularnewline
-171.91462723681 \tabularnewline
-106.932000607124 \tabularnewline
-243.203510028877 \tabularnewline
-37.6003073767359 \tabularnewline
-46.1271540138012 \tabularnewline
-133.785568512663 \tabularnewline
313.176223141036 \tabularnewline
-109.902438023838 \tabularnewline
-35.0880886022409 \tabularnewline
81.5624931060276 \tabularnewline
-435.876145567132 \tabularnewline
119.632108070389 \tabularnewline
120.909771411178 \tabularnewline
394.765525671761 \tabularnewline
44.2608329325668 \tabularnewline
102.731165402866 \tabularnewline
-0.580801623951629 \tabularnewline
-178.029137832449 \tabularnewline
119.564469504081 \tabularnewline
152.361878781325 \tabularnewline
144.81156938 \tabularnewline
-71.4520697479929 \tabularnewline
-153.441333171078 \tabularnewline
124.229681565874 \tabularnewline
48.7982443581914 \tabularnewline
86.5063302848466 \tabularnewline
68.3968939476408 \tabularnewline
142.3740729908 \tabularnewline
-193.280851897949 \tabularnewline
170.108773472452 \tabularnewline
44.9244110539594 \tabularnewline
109.265666034049 \tabularnewline
1.40663481921638 \tabularnewline
318.314528352339 \tabularnewline
-105.236088268272 \tabularnewline
-236.740794854968 \tabularnewline
-142.244278418821 \tabularnewline
66.3979336868779 \tabularnewline
-215.231994002757 \tabularnewline
-16.4892352027373 \tabularnewline
-348.303700148335 \tabularnewline
82.7418494771227 \tabularnewline
59.0840323517686 \tabularnewline
-143.064669573273 \tabularnewline
246.251818371013 \tabularnewline
-64.4424592483101 \tabularnewline
-470.605465612091 \tabularnewline
-221.34945143892 \tabularnewline
430.617634931426 \tabularnewline
-111.762475757495 \tabularnewline
229.372000537262 \tabularnewline
-213.857337703517 \tabularnewline
-43.8531350772864 \tabularnewline
-20.5688863371606 \tabularnewline
-23.4225016522496 \tabularnewline
143.062437673119 \tabularnewline
-721.535663890894 \tabularnewline
-354.742163719673 \tabularnewline
-229.655965351158 \tabularnewline
52.0037584368092 \tabularnewline
-386.003928823046 \tabularnewline
167.566868031843 \tabularnewline
334.512840112587 \tabularnewline
-33.0804395233299 \tabularnewline
605.818709531455 \tabularnewline
53.9441196226553 \tabularnewline
-263.819962604639 \tabularnewline
-85.9312541039745 \tabularnewline
46.0893627008081 \tabularnewline
-623.998836063393 \tabularnewline
145.142582890958 \tabularnewline
92.6989034795197 \tabularnewline
315.114125258911 \tabularnewline
183.816921256478 \tabularnewline
43.6666991255834 \tabularnewline
208.167989587818 \tabularnewline
-385.297769959615 \tabularnewline
37.9934717928454 \tabularnewline
\hline
\end{tabular}
%Source: https://freestatistics.org/blog/index.php?pk=302860&T=2

[TABLE]
[ROW][C]Estimated ARIMA Residuals[/C][/ROW]
[ROW][C]Value[/C][/ROW]
[ROW][C]-12.4108109889854[/C][/ROW]
[ROW][C]280.201522554373[/C][/ROW]
[ROW][C]229.522049682473[/C][/ROW]
[ROW][C]-341.06795988318[/C][/ROW]
[ROW][C]-165.689091622387[/C][/ROW]
[ROW][C]-374.576211211887[/C][/ROW]
[ROW][C]12.1200996521077[/C][/ROW]
[ROW][C]-35.8007232012724[/C][/ROW]
[ROW][C]-178.04233648898[/C][/ROW]
[ROW][C]-334.220394578995[/C][/ROW]
[ROW][C]87.8185709914246[/C][/ROW]
[ROW][C]19.7020143764633[/C][/ROW]
[ROW][C]-77.6675144775447[/C][/ROW]
[ROW][C]-73.1810485665097[/C][/ROW]
[ROW][C]-136.379386977407[/C][/ROW]
[ROW][C]-127.899587661373[/C][/ROW]
[ROW][C]-0.31127836073513[/C][/ROW]
[ROW][C]173.645269085456[/C][/ROW]
[ROW][C]-199.758969742773[/C][/ROW]
[ROW][C]41.491633619068[/C][/ROW]
[ROW][C]100.669065308558[/C][/ROW]
[ROW][C]-165.580848280218[/C][/ROW]
[ROW][C]-355.074489954595[/C][/ROW]
[ROW][C]177.136641923639[/C][/ROW]
[ROW][C]-79.3531065808779[/C][/ROW]
[ROW][C]69.9843302284907[/C][/ROW]
[ROW][C]-171.91462723681[/C][/ROW]
[ROW][C]-106.932000607124[/C][/ROW]
[ROW][C]-243.203510028877[/C][/ROW]
[ROW][C]-37.6003073767359[/C][/ROW]
[ROW][C]-46.1271540138012[/C][/ROW]
[ROW][C]-133.785568512663[/C][/ROW]
[ROW][C]313.176223141036[/C][/ROW]
[ROW][C]-109.902438023838[/C][/ROW]
[ROW][C]-35.0880886022409[/C][/ROW]
[ROW][C]81.5624931060276[/C][/ROW]
[ROW][C]-435.876145567132[/C][/ROW]
[ROW][C]119.632108070389[/C][/ROW]
[ROW][C]120.909771411178[/C][/ROW]
[ROW][C]394.765525671761[/C][/ROW]
[ROW][C]44.2608329325668[/C][/ROW]
[ROW][C]102.731165402866[/C][/ROW]
[ROW][C]-0.580801623951629[/C][/ROW]
[ROW][C]-178.029137832449[/C][/ROW]
[ROW][C]119.564469504081[/C][/ROW]
[ROW][C]152.361878781325[/C][/ROW]
[ROW][C]144.81156938[/C][/ROW]
[ROW][C]-71.4520697479929[/C][/ROW]
[ROW][C]-153.441333171078[/C][/ROW]
[ROW][C]124.229681565874[/C][/ROW]
[ROW][C]48.7982443581914[/C][/ROW]
[ROW][C]86.5063302848466[/C][/ROW]
[ROW][C]68.3968939476408[/C][/ROW]
[ROW][C]142.3740729908[/C][/ROW]
[ROW][C]-193.280851897949[/C][/ROW]
[ROW][C]170.108773472452[/C][/ROW]
[ROW][C]44.9244110539594[/C][/ROW]
[ROW][C]109.265666034049[/C][/ROW]
[ROW][C]1.40663481921638[/C][/ROW]
[ROW][C]318.314528352339[/C][/ROW]
[ROW][C]-105.236088268272[/C][/ROW]
[ROW][C]-236.740794854968[/C][/ROW]
[ROW][C]-142.244278418821[/C][/ROW]
[ROW][C]66.3979336868779[/C][/ROW]
[ROW][C]-215.231994002757[/C][/ROW]
[ROW][C]-16.4892352027373[/C][/ROW]
[ROW][C]-348.303700148335[/C][/ROW]
[ROW][C]82.7418494771227[/C][/ROW]
[ROW][C]59.0840323517686[/C][/ROW]
[ROW][C]-143.064669573273[/C][/ROW]
[ROW][C]246.251818371013[/C][/ROW]
[ROW][C]-64.4424592483101[/C][/ROW]
[ROW][C]-470.605465612091[/C][/ROW]
[ROW][C]-221.34945143892[/C][/ROW]
[ROW][C]430.617634931426[/C][/ROW]
[ROW][C]-111.762475757495[/C][/ROW]
[ROW][C]229.372000537262[/C][/ROW]
[ROW][C]-213.857337703517[/C][/ROW]
[ROW][C]-43.8531350772864[/C][/ROW]
[ROW][C]-20.5688863371606[/C][/ROW]
[ROW][C]-23.4225016522496[/C][/ROW]
[ROW][C]143.062437673119[/C][/ROW]
[ROW][C]-721.535663890894[/C][/ROW]
[ROW][C]-354.742163719673[/C][/ROW]
[ROW][C]-229.655965351158[/C][/ROW]
[ROW][C]52.0037584368092[/C][/ROW]
[ROW][C]-386.003928823046[/C][/ROW]
[ROW][C]167.566868031843[/C][/ROW]
[ROW][C]334.512840112587[/C][/ROW]
[ROW][C]-33.0804395233299[/C][/ROW]
[ROW][C]605.818709531455[/C][/ROW]
[ROW][C]53.9441196226553[/C][/ROW]
[ROW][C]-263.819962604639[/C][/ROW]
[ROW][C]-85.9312541039745[/C][/ROW]
[ROW][C]46.0893627008081[/C][/ROW]
[ROW][C]-623.998836063393[/C][/ROW]
[ROW][C]145.142582890958[/C][/ROW]
[ROW][C]92.6989034795197[/C][/ROW]
[ROW][C]315.114125258911[/C][/ROW]
[ROW][C]183.816921256478[/C][/ROW]
[ROW][C]43.6666991255834[/C][/ROW]
[ROW][C]208.167989587818[/C][/ROW]
[ROW][C]-385.297769959615[/C][/ROW]
[ROW][C]37.9934717928454[/C][/ROW]
[/TABLE]
Source: https://freestatistics.org/blog/index.php?pk=302860&T=2

Globally Unique Identifier (entire table): ba.freestatistics.org/blog/index.php?pk=302860&T=2

As an alternative you can also use a QR Code:  

The GUIDs for individual cells are displayed in the table below:

Estimated ARIMA Residuals
Value
-12.4108109889854
280.201522554373
229.522049682473
-341.06795988318
-165.689091622387
-374.576211211887
12.1200996521077
-35.8007232012724
-178.04233648898
-334.220394578995
87.8185709914246
19.7020143764633
-77.6675144775447
-73.1810485665097
-136.379386977407
-127.899587661373
-0.31127836073513
173.645269085456
-199.758969742773
41.491633619068
100.669065308558
-165.580848280218
-355.074489954595
177.136641923639
-79.3531065808779
69.9843302284907
-171.91462723681
-106.932000607124
-243.203510028877
-37.6003073767359
-46.1271540138012
-133.785568512663
313.176223141036
-109.902438023838
-35.0880886022409
81.5624931060276
-435.876145567132
119.632108070389
120.909771411178
394.765525671761
44.2608329325668
102.731165402866
-0.580801623951629
-178.029137832449
119.564469504081
152.361878781325
144.81156938
-71.4520697479929
-153.441333171078
124.229681565874
48.7982443581914
86.5063302848466
68.3968939476408
142.3740729908
-193.280851897949
170.108773472452
44.9244110539594
109.265666034049
1.40663481921638
318.314528352339
-105.236088268272
-236.740794854968
-142.244278418821
66.3979336868779
-215.231994002757
-16.4892352027373
-348.303700148335
82.7418494771227
59.0840323517686
-143.064669573273
246.251818371013
-64.4424592483101
-470.605465612091
-221.34945143892
430.617634931426
-111.762475757495
229.372000537262
-213.857337703517
-43.8531350772864
-20.5688863371606
-23.4225016522496
143.062437673119
-721.535663890894
-354.742163719673
-229.655965351158
52.0037584368092
-386.003928823046
167.566868031843
334.512840112587
-33.0804395233299
605.818709531455
53.9441196226553
-263.819962604639
-85.9312541039745
46.0893627008081
-623.998836063393
145.142582890958
92.6989034795197
315.114125258911
183.816921256478
43.6666991255834
208.167989587818
-385.297769959615
37.9934717928454


Parameters (Session):
par1 = 18 ; par2 = 1 ; par3 = 1 ; par4 = 1 ; par5 = 12 ; par6 = 1 ; par7 = 1 ; par8 = 1 ; par9 = 1 ; par10 = TRUE ;
Parameters (R input):
par1 = FALSE ; par2 = 1 ; par3 = 1 ; par4 = 1 ; par5 = 12 ; par6 = 3 ; par7 = 1 ; par8 = 2 ; par9 = 1 ;
R code (references can be found in the software module):
par9 <- '1'
par8 <- '2'
par7 <- '1'
par6 <- '3'
par5 <- '12'
par4 <- '1'
par3 <- '1'
par2 <- '1'
par1 <- 'FALSE'
library(lattice)
if (par1 == 'TRUE') par1 <- TRUE
if (par1 == 'FALSE') par1 <- FALSE
par2 <- as.numeric(par2) #Box-Cox lambda transformation parameter
par3 <- as.numeric(par3) #degree of non-seasonal differencing
par4 <- as.numeric(par4) #degree of seasonal differencing
par5 <- as.numeric(par5) #seasonal period
par6 <- as.numeric(par6) #degree (p) of the non-seasonal AR(p) polynomial
par7 <- as.numeric(par7) #degree (q) of the non-seasonal MA(q) polynomial
par8 <- as.numeric(par8) #degree (P) of the seasonal AR(P) polynomial
par9 <- as.numeric(par9) #degree (Q) of the seasonal MA(Q) polynomial
armaGR <- function(arima.out, names, n){
try1 <- arima.out$coef
try2 <- sqrt(diag(arima.out$var.coef))
try.data.frame <- data.frame(matrix(NA,ncol=4,nrow=length(names)))
dimnames(try.data.frame) <- list(names,c('coef','std','tstat','pv'))
try.data.frame[,1] <- try1
for(i in 1:length(try2)) try.data.frame[which(rownames(try.data.frame)==names(try2)[i]),2] <- try2[i]
try.data.frame[,3] <- try.data.frame[,1] / try.data.frame[,2]
try.data.frame[,4] <- round((1-pt(abs(try.data.frame[,3]),df=n-(length(try2)+1)))*2,5)
vector <- rep(NA,length(names))
vector[is.na(try.data.frame[,4])] <- 0
maxi <- which.max(try.data.frame[,4])
continue <- max(try.data.frame[,4],na.rm=TRUE) > .05
vector[maxi] <- 0
list(summary=try.data.frame,next.vector=vector,continue=continue)
}
arimaSelect <- function(series, order=c(13,0,0), seasonal=list(order=c(2,0,0),period=12), include.mean=F){
nrc <- order[1]+order[3]+seasonal$order[1]+seasonal$order[3]
coeff <- matrix(NA, nrow=nrc*2, ncol=nrc)
pval <- matrix(NA, nrow=nrc*2, ncol=nrc)
mylist <- rep(list(NULL), nrc)
names <- NULL
if(order[1] > 0) names <- paste('ar',1:order[1],sep='')
if(order[3] > 0) names <- c( names , paste('ma',1:order[3],sep='') )
if(seasonal$order[1] > 0) names <- c(names, paste('sar',1:seasonal$order[1],sep=''))
if(seasonal$order[3] > 0) names <- c(names, paste('sma',1:seasonal$order[3],sep=''))
arima.out <- arima(series, order=order, seasonal=seasonal, include.mean=include.mean, method='ML')
mylist[[1]] <- arima.out
last.arma <- armaGR(arima.out, names, length(series))
mystop <- FALSE
i <- 1
coeff[i,] <- last.arma[[1]][,1]
pval [i,] <- last.arma[[1]][,4]
i <- 2
aic <- arima.out$aic
while(!mystop){
mylist[[i]] <- arima.out
arima.out <- arima(series, order=order, seasonal=seasonal, include.mean=include.mean, method='ML', fixed=last.arma$next.vector)
aic <- c(aic, arima.out$aic)
last.arma <- armaGR(arima.out, names, length(series))
mystop <- !last.arma$continue
coeff[i,] <- last.arma[[1]][,1]
pval [i,] <- last.arma[[1]][,4]
i <- i+1
}
list(coeff, pval, mylist, aic=aic)
}
arimaSelectplot <- function(arimaSelect.out,noms,choix){
noms <- names(arimaSelect.out[[3]][[1]]$coef)
coeff <- arimaSelect.out[[1]]
k <- min(which(is.na(coeff[,1])))-1
coeff <- coeff[1:k,]
pval <- arimaSelect.out[[2]][1:k,]
aic <- arimaSelect.out$aic[1:k]
coeff[coeff==0] <- NA
n <- ncol(coeff)
if(missing(choix)) choix <- k
layout(matrix(c(1,1,1,2,
3,3,3,2,
3,3,3,4,
5,6,7,7),nr=4),
widths=c(10,35,45,15),
heights=c(30,30,15,15))
couleurs <- rainbow(75)[1:50]#(50)
ticks <- pretty(coeff)
par(mar=c(1,1,3,1))
plot(aic,k:1-.5,type='o',pch=21,bg='blue',cex=2,axes=F,lty=2,xpd=NA)
points(aic[choix],k-choix+.5,pch=21,cex=4,bg=2,xpd=NA)
title('aic',line=2)
par(mar=c(3,0,0,0))
plot(0,axes=F,xlab='',ylab='',xlim=range(ticks),ylim=c(.1,1))
rect(xleft = min(ticks) + (0:49)/50*(max(ticks)-min(ticks)),
xright = min(ticks) + (1:50)/50*(max(ticks)-min(ticks)),
ytop = rep(1,50),
ybottom= rep(0,50),col=couleurs,border=NA)
axis(1,ticks)
rect(xleft=min(ticks),xright=max(ticks),ytop=1,ybottom=0)
text(mean(coeff,na.rm=T),.5,'coefficients',cex=2,font=2)
par(mar=c(1,1,3,1))
image(1:n,1:k,t(coeff[k:1,]),axes=F,col=couleurs,zlim=range(ticks))
for(i in 1:n) for(j in 1:k) if(!is.na(coeff[j,i])) {
if(pval[j,i]<.01) symb = 'green'
else if( (pval[j,i]<.05) & (pval[j,i]>=.01)) symb = 'orange'
else if( (pval[j,i]<.1) & (pval[j,i]>=.05)) symb = 'red'
else symb = 'black'
polygon(c(i+.5 ,i+.2 ,i+.5 ,i+.5),
c(k-j+0.5,k-j+0.5,k-j+0.8,k-j+0.5),
col=symb)
if(j==choix) {
rect(xleft=i-.5,
xright=i+.5,
ybottom=k-j+1.5,
ytop=k-j+.5,
lwd=4)
text(i,
k-j+1,
round(coeff[j,i],2),
cex=1.2,
font=2)
}
else{
rect(xleft=i-.5,xright=i+.5,ybottom=k-j+1.5,ytop=k-j+.5)
text(i,k-j+1,round(coeff[j,i],2),cex=1.2,font=1)
}
}
axis(3,1:n,noms)
par(mar=c(0.5,0,0,0.5))
plot(0,axes=F,xlab='',ylab='',type='n',xlim=c(0,8),ylim=c(-.2,.8))
cols <- c('green','orange','red','black')
niv <- c('0','0.01','0.05','0.1')
for(i in 0:3){
polygon(c(1+2*i ,1+2*i ,1+2*i-.5 ,1+2*i),
c(.4 ,.7 , .4 , .4),
col=cols[i+1])
text(2*i,0.5,niv[i+1],cex=1.5)
}
text(8,.5,1,cex=1.5)
text(4,0,'p-value',cex=2)
box()
residus <- arimaSelect.out[[3]][[choix]]$res
par(mar=c(1,2,4,1))
acf(residus,main='')
title('acf',line=.5)
par(mar=c(1,2,4,1))
pacf(residus,main='')
title('pacf',line=.5)
par(mar=c(2,2,4,1))
qqnorm(residus,main='')
title('qq-norm',line=.5)
qqline(residus)
residus
}
if (par2 == 0) x <- log(x)
if (par2 != 0) x <- x^par2
(selection <- arimaSelect(x, order=c(par6,par3,par7), seasonal=list(order=c(par8,par4,par9), period=par5)))
bitmap(file='test1.png')
resid <- arimaSelectplot(selection)
dev.off()
resid
bitmap(file='test2.png')
acf(resid,length(resid)/2, main='Residual Autocorrelation Function')
dev.off()
bitmap(file='test3.png')
pacf(resid,length(resid)/2, main='Residual Partial Autocorrelation Function')
dev.off()
bitmap(file='test4.png')
cpgram(resid, main='Residual Cumulative Periodogram')
dev.off()
bitmap(file='test5.png')
hist(resid, main='Residual Histogram', xlab='values of Residuals')
dev.off()
bitmap(file='test6.png')
densityplot(~resid,col='black',main='Residual Density Plot', xlab='values of Residuals')
dev.off()
bitmap(file='test7.png')
qqnorm(resid, main='Residual Normal Q-Q Plot')
qqline(resid)
dev.off()
ncols <- length(selection[[1]][1,])
nrows <- length(selection[[2]][,1])-1
load(file='createtable')
a<-table.start()
a<-table.row.start(a)
a<-table.element(a,'ARIMA Parameter Estimation and Backward Selection', ncols+1,TRUE)
a<-table.row.end(a)
a<-table.row.start(a)
a<-table.element(a,'Iteration', header=TRUE)
for (i in 1:ncols) {
a<-table.element(a,names(selection[[3]][[1]]$coef)[i],header=TRUE)
}
a<-table.row.end(a)
for (j in 1:nrows) {
a<-table.row.start(a)
mydum <- 'Estimates ('
mydum <- paste(mydum,j)
mydum <- paste(mydum,')')
a<-table.element(a,mydum, header=TRUE)
for (i in 1:ncols) {
a<-table.element(a,round(selection[[1]][j,i],4))
}
a<-table.row.end(a)
a<-table.row.start(a)
a<-table.element(a,'(p-val)', header=TRUE)
for (i in 1:ncols) {
mydum <- '('
mydum <- paste(mydum,round(selection[[2]][j,i],4),sep='')
mydum <- paste(mydum,')')
a<-table.element(a,mydum)
}
a<-table.row.end(a)
}
a<-table.end(a)
table.save(a,file='mytable.tab')
a<-table.start()
a<-table.row.start(a)
a<-table.element(a,'Estimated ARIMA Residuals', 1,TRUE)
a<-table.row.end(a)
a<-table.row.start(a)
a<-table.element(a,'Value', 1,TRUE)
a<-table.row.end(a)
for (i in (par4*par5+par3):length(resid)) {
a<-table.row.start(a)
a<-table.element(a,resid[i])
a<-table.row.end(a)
}
a<-table.end(a)
table.save(a,file='mytable1.tab')