Free Statistics

of Irreproducible Research!

Author's title

Author*The author of this computation has been verified*
R Software Modulerwasp_autocorrelation.wasp
Title produced by software(Partial) Autocorrelation Function
Date of computationFri, 23 Dec 2016 12:47:57 +0100
Cite this page as followsStatistical Computations at FreeStatistics.org, Office for Research Development and Education, URL https://freestatistics.org/blog/index.php?v=date/2016/Dec/23/t1482493692wmh2wqh3zpgaus4.htm/, Retrieved Tue, 07 May 2024 17:22:10 +0000
Statistical Computations at FreeStatistics.org, Office for Research Development and Education, URL https://freestatistics.org/blog/index.php?pk=302877, Retrieved Tue, 07 May 2024 17:22:10 +0000
QR Codes:

Original text written by user:
IsPrivate?No (this computation is public)
User-defined keywords
Estimated Impact67
Family? (F = Feedback message, R = changed R code, M = changed R Module, P = changed Parameters, D = changed Data)
-       [(Partial) Autocorrelation Function] [N2797] [2016-12-23 11:47:57] [8e56909c70ba580a071e942d9a393c42] [Current]
Feedback Forum

Post a new message
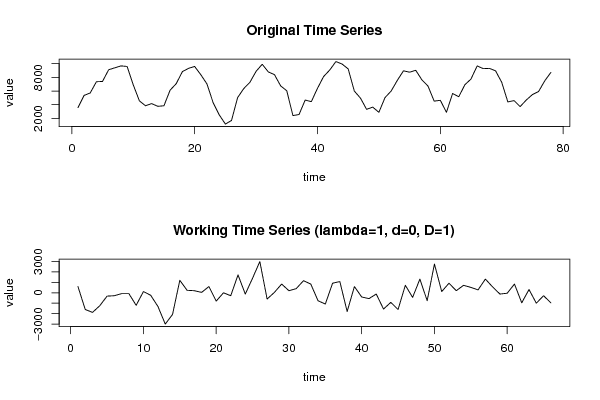
Dataseries X:
3560
5360
5720
7360
7400
9120
9400
9680
9600
6920
4560
3840
4160
3760
3840
6120
7080
8840
9320
9600
8400
7040
4320
2520
1160
1680
5040
6360
7280
8880
9920
8800
8400
6760
6040
2400
2560
4680
4440
6400
8120
9080
10320
9960
9240
6000
4960
3320
3640
2880
5040
6000
7560
8960
8760
9040
7640
6720
4520
4640
2880
5640
5160
6920
7760
9680
9280
9320
8960
7280
4400
4600
3720
4680
5480
5920
7480
8720


Summary of computational transaction
Raw Input view raw input (R code)
Raw Outputview raw output of R engine
Computing time1 seconds
R ServerBig Analytics Cloud Computing Center

\begin{tabular}{lllllllll}
\hline
Summary of computational transaction \tabularnewline
Raw Input view raw input (R code)  \tabularnewline
Raw Outputview raw output of R engine  \tabularnewline
Computing time1 seconds \tabularnewline
R ServerBig Analytics Cloud Computing Center \tabularnewline
\hline
\end{tabular}
%Source: https://freestatistics.org/blog/index.php?pk=302877&T=0

[TABLE]
[ROW]
Summary of computational transaction[/C][/ROW] [ROW]Raw Input[/C] view raw input (R code) [/C][/ROW] [ROW]Raw Output[/C]view raw output of R engine [/C][/ROW] [ROW]Computing time[/C]1 seconds[/C][/ROW] [ROW]R Server[/C]Big Analytics Cloud Computing Center[/C][/ROW] [/TABLE] Source: https://freestatistics.org/blog/index.php?pk=302877&T=0

Globally Unique Identifier (entire table): ba.freestatistics.org/blog/index.php?pk=302877&T=0

As an alternative you can also use a QR Code:  

The GUIDs for individual cells are displayed in the table below:

Summary of computational transaction
Raw Input view raw input (R code)
Raw Outputview raw output of R engine
Computing time1 seconds
R ServerBig Analytics Cloud Computing Center


Autocorrelation Function
Time lag kACF(k)T-STATP-value
10.1627851.32250.095287
20.1845291.49910.069305
30.0840050.68250.248668
40.1919271.55920.061863
5-0.028374-0.23050.409204
60.0521960.4240.336456
70.1335881.08530.140874
80.019080.1550.438645
9-0.017969-0.1460.44219
100.0364680.29630.383977
110.1443831.1730.122512
12-0.46136-3.74810.000189
13-0.16613-1.34960.09087
14-0.125441-1.01910.155941
15-0.106346-0.8640.19537
16-0.163332-1.32690.094555
17-0.098063-0.79670.214251
18-0.047544-0.38620.350278

\begin{tabular}{lllllllll}
\hline
Autocorrelation Function \tabularnewline
Time lag k & ACF(k) & T-STAT & P-value \tabularnewline
1 & 0.162785 & 1.3225 & 0.095287 \tabularnewline
2 & 0.184529 & 1.4991 & 0.069305 \tabularnewline
3 & 0.084005 & 0.6825 & 0.248668 \tabularnewline
4 & 0.191927 & 1.5592 & 0.061863 \tabularnewline
5 & -0.028374 & -0.2305 & 0.409204 \tabularnewline
6 & 0.052196 & 0.424 & 0.336456 \tabularnewline
7 & 0.133588 & 1.0853 & 0.140874 \tabularnewline
8 & 0.01908 & 0.155 & 0.438645 \tabularnewline
9 & -0.017969 & -0.146 & 0.44219 \tabularnewline
10 & 0.036468 & 0.2963 & 0.383977 \tabularnewline
11 & 0.144383 & 1.173 & 0.122512 \tabularnewline
12 & -0.46136 & -3.7481 & 0.000189 \tabularnewline
13 & -0.16613 & -1.3496 & 0.09087 \tabularnewline
14 & -0.125441 & -1.0191 & 0.155941 \tabularnewline
15 & -0.106346 & -0.864 & 0.19537 \tabularnewline
16 & -0.163332 & -1.3269 & 0.094555 \tabularnewline
17 & -0.098063 & -0.7967 & 0.214251 \tabularnewline
18 & -0.047544 & -0.3862 & 0.350278 \tabularnewline
\hline
\end{tabular}
%Source: https://freestatistics.org/blog/index.php?pk=302877&T=1

[TABLE]
[ROW][C]Autocorrelation Function[/C][/ROW]
[ROW][C]Time lag k[/C][C]ACF(k)[/C][C]T-STAT[/C][C]P-value[/C][/ROW]
[ROW][C]1[/C][C]0.162785[/C][C]1.3225[/C][C]0.095287[/C][/ROW]
[ROW][C]2[/C][C]0.184529[/C][C]1.4991[/C][C]0.069305[/C][/ROW]
[ROW][C]3[/C][C]0.084005[/C][C]0.6825[/C][C]0.248668[/C][/ROW]
[ROW][C]4[/C][C]0.191927[/C][C]1.5592[/C][C]0.061863[/C][/ROW]
[ROW][C]5[/C][C]-0.028374[/C][C]-0.2305[/C][C]0.409204[/C][/ROW]
[ROW][C]6[/C][C]0.052196[/C][C]0.424[/C][C]0.336456[/C][/ROW]
[ROW][C]7[/C][C]0.133588[/C][C]1.0853[/C][C]0.140874[/C][/ROW]
[ROW][C]8[/C][C]0.01908[/C][C]0.155[/C][C]0.438645[/C][/ROW]
[ROW][C]9[/C][C]-0.017969[/C][C]-0.146[/C][C]0.44219[/C][/ROW]
[ROW][C]10[/C][C]0.036468[/C][C]0.2963[/C][C]0.383977[/C][/ROW]
[ROW][C]11[/C][C]0.144383[/C][C]1.173[/C][C]0.122512[/C][/ROW]
[ROW][C]12[/C][C]-0.46136[/C][C]-3.7481[/C][C]0.000189[/C][/ROW]
[ROW][C]13[/C][C]-0.16613[/C][C]-1.3496[/C][C]0.09087[/C][/ROW]
[ROW][C]14[/C][C]-0.125441[/C][C]-1.0191[/C][C]0.155941[/C][/ROW]
[ROW][C]15[/C][C]-0.106346[/C][C]-0.864[/C][C]0.19537[/C][/ROW]
[ROW][C]16[/C][C]-0.163332[/C][C]-1.3269[/C][C]0.094555[/C][/ROW]
[ROW][C]17[/C][C]-0.098063[/C][C]-0.7967[/C][C]0.214251[/C][/ROW]
[ROW][C]18[/C][C]-0.047544[/C][C]-0.3862[/C][C]0.350278[/C][/ROW]
[/TABLE]
Source: https://freestatistics.org/blog/index.php?pk=302877&T=1

Globally Unique Identifier (entire table): ba.freestatistics.org/blog/index.php?pk=302877&T=1

As an alternative you can also use a QR Code:  

The GUIDs for individual cells are displayed in the table below:

Autocorrelation Function
Time lag kACF(k)T-STATP-value
10.1627851.32250.095287
20.1845291.49910.069305
30.0840050.68250.248668
40.1919271.55920.061863
5-0.028374-0.23050.409204
60.0521960.4240.336456
70.1335881.08530.140874
80.019080.1550.438645
9-0.017969-0.1460.44219
100.0364680.29630.383977
110.1443831.1730.122512
12-0.46136-3.74810.000189
13-0.16613-1.34960.09087
14-0.125441-1.01910.155941
15-0.106346-0.8640.19537
16-0.163332-1.32690.094555
17-0.098063-0.79670.214251
18-0.047544-0.38620.350278


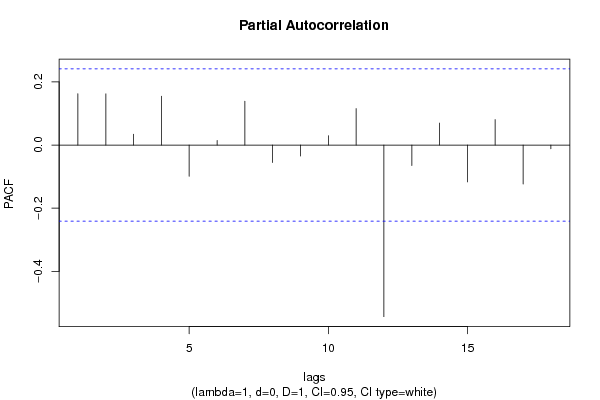
Partial Autocorrelation Function
Time lag kPACF(k)T-STATP-value
10.1627851.32250.095287
20.1623321.31880.095899
30.0342010.27790.390998
40.1545061.25520.106914
5-0.098899-0.80350.212296
60.0145950.11860.452989
70.1390011.12930.13144
8-0.055471-0.45060.32686
9-0.03439-0.27940.39041
100.0294180.2390.405925
110.1156230.93930.175495
12-0.543685-4.41691.9e-05
13-0.064994-0.5280.299629
140.069680.56610.28663
15-0.116697-0.9480.173281
160.0806640.65530.25727
17-0.123282-1.00160.160109
18-0.011414-0.09270.463201

\begin{tabular}{lllllllll}
\hline
Partial Autocorrelation Function \tabularnewline
Time lag k & PACF(k) & T-STAT & P-value \tabularnewline
1 & 0.162785 & 1.3225 & 0.095287 \tabularnewline
2 & 0.162332 & 1.3188 & 0.095899 \tabularnewline
3 & 0.034201 & 0.2779 & 0.390998 \tabularnewline
4 & 0.154506 & 1.2552 & 0.106914 \tabularnewline
5 & -0.098899 & -0.8035 & 0.212296 \tabularnewline
6 & 0.014595 & 0.1186 & 0.452989 \tabularnewline
7 & 0.139001 & 1.1293 & 0.13144 \tabularnewline
8 & -0.055471 & -0.4506 & 0.32686 \tabularnewline
9 & -0.03439 & -0.2794 & 0.39041 \tabularnewline
10 & 0.029418 & 0.239 & 0.405925 \tabularnewline
11 & 0.115623 & 0.9393 & 0.175495 \tabularnewline
12 & -0.543685 & -4.4169 & 1.9e-05 \tabularnewline
13 & -0.064994 & -0.528 & 0.299629 \tabularnewline
14 & 0.06968 & 0.5661 & 0.28663 \tabularnewline
15 & -0.116697 & -0.948 & 0.173281 \tabularnewline
16 & 0.080664 & 0.6553 & 0.25727 \tabularnewline
17 & -0.123282 & -1.0016 & 0.160109 \tabularnewline
18 & -0.011414 & -0.0927 & 0.463201 \tabularnewline
\hline
\end{tabular}
%Source: https://freestatistics.org/blog/index.php?pk=302877&T=2

[TABLE]
[ROW][C]Partial Autocorrelation Function[/C][/ROW]
[ROW][C]Time lag k[/C][C]PACF(k)[/C][C]T-STAT[/C][C]P-value[/C][/ROW]
[ROW][C]1[/C][C]0.162785[/C][C]1.3225[/C][C]0.095287[/C][/ROW]
[ROW][C]2[/C][C]0.162332[/C][C]1.3188[/C][C]0.095899[/C][/ROW]
[ROW][C]3[/C][C]0.034201[/C][C]0.2779[/C][C]0.390998[/C][/ROW]
[ROW][C]4[/C][C]0.154506[/C][C]1.2552[/C][C]0.106914[/C][/ROW]
[ROW][C]5[/C][C]-0.098899[/C][C]-0.8035[/C][C]0.212296[/C][/ROW]
[ROW][C]6[/C][C]0.014595[/C][C]0.1186[/C][C]0.452989[/C][/ROW]
[ROW][C]7[/C][C]0.139001[/C][C]1.1293[/C][C]0.13144[/C][/ROW]
[ROW][C]8[/C][C]-0.055471[/C][C]-0.4506[/C][C]0.32686[/C][/ROW]
[ROW][C]9[/C][C]-0.03439[/C][C]-0.2794[/C][C]0.39041[/C][/ROW]
[ROW][C]10[/C][C]0.029418[/C][C]0.239[/C][C]0.405925[/C][/ROW]
[ROW][C]11[/C][C]0.115623[/C][C]0.9393[/C][C]0.175495[/C][/ROW]
[ROW][C]12[/C][C]-0.543685[/C][C]-4.4169[/C][C]1.9e-05[/C][/ROW]
[ROW][C]13[/C][C]-0.064994[/C][C]-0.528[/C][C]0.299629[/C][/ROW]
[ROW][C]14[/C][C]0.06968[/C][C]0.5661[/C][C]0.28663[/C][/ROW]
[ROW][C]15[/C][C]-0.116697[/C][C]-0.948[/C][C]0.173281[/C][/ROW]
[ROW][C]16[/C][C]0.080664[/C][C]0.6553[/C][C]0.25727[/C][/ROW]
[ROW][C]17[/C][C]-0.123282[/C][C]-1.0016[/C][C]0.160109[/C][/ROW]
[ROW][C]18[/C][C]-0.011414[/C][C]-0.0927[/C][C]0.463201[/C][/ROW]
[/TABLE]
Source: https://freestatistics.org/blog/index.php?pk=302877&T=2

Globally Unique Identifier (entire table): ba.freestatistics.org/blog/index.php?pk=302877&T=2

As an alternative you can also use a QR Code:  

The GUIDs for individual cells are displayed in the table below:

Partial Autocorrelation Function
Time lag kPACF(k)T-STATP-value
10.1627851.32250.095287
20.1623321.31880.095899
30.0342010.27790.390998
40.1545061.25520.106914
5-0.098899-0.80350.212296
60.0145950.11860.452989
70.1390011.12930.13144
8-0.055471-0.45060.32686
9-0.03439-0.27940.39041
100.0294180.2390.405925
110.1156230.93930.175495
12-0.543685-4.41691.9e-05
13-0.064994-0.5280.299629
140.069680.56610.28663
15-0.116697-0.9480.173281
160.0806640.65530.25727
17-0.123282-1.00160.160109
18-0.011414-0.09270.463201


Parameters (Session):
par1 = additive ; par2 = 12 ;
Parameters (R input):
par1 = Default ; par2 = 1 ; par3 = 0 ; par4 = 1 ; par5 = 12 ; par6 = White Noise ; par7 = 0.95 ; par8 = ;
R code (references can be found in the software module):
if (par1 == 'Default') {
par1 = 10*log10(length(x))
} else {
par1 <- as.numeric(par1)
}
par2 <- as.numeric(par2)
par3 <- as.numeric(par3)
par4 <- as.numeric(par4)
par5 <- as.numeric(par5)
if (par6 == 'White Noise') par6 <- 'white' else par6 <- 'ma'
par7 <- as.numeric(par7)
if (par8 != '') par8 <- as.numeric(par8)
x <- na.omit(x)
ox <- x
if (par8 == '') {
if (par2 == 0) {
x <- log(x)
} else {
x <- (x ^ par2 - 1) / par2
}
} else {
x <- log(x,base=par8)
}
if (par3 > 0) x <- diff(x,lag=1,difference=par3)
if (par4 > 0) x <- diff(x,lag=par5,difference=par4)
bitmap(file='picts.png')
op <- par(mfrow=c(2,1))
plot(ox,type='l',main='Original Time Series',xlab='time',ylab='value')
if (par8=='') {
mytitle <- paste('Working Time Series (lambda=',par2,', d=',par3,', D=',par4,')',sep='')
mysub <- paste('(lambda=',par2,', d=',par3,', D=',par4,', CI=', par7, ', CI type=',par6,')',sep='')
} else {
mytitle <- paste('Working Time Series (base=',par8,', d=',par3,', D=',par4,')',sep='')
mysub <- paste('(base=',par8,', d=',par3,', D=',par4,', CI=', par7, ', CI type=',par6,')',sep='')
}
plot(x,type='l', main=mytitle,xlab='time',ylab='value')
par(op)
dev.off()
bitmap(file='pic1.png')
racf <- acf(x, par1, main='Autocorrelation', xlab='time lag', ylab='ACF', ci.type=par6, ci=par7, sub=mysub)
dev.off()
bitmap(file='pic2.png')
rpacf <- pacf(x,par1,main='Partial Autocorrelation',xlab='lags',ylab='PACF',sub=mysub)
dev.off()
(myacf <- c(racf$acf))
(mypacf <- c(rpacf$acf))
lengthx <- length(x)
sqrtn <- sqrt(lengthx)
load(file='createtable')
a<-table.start()
a<-table.row.start(a)
a<-table.element(a,'Autocorrelation Function',4,TRUE)
a<-table.row.end(a)
a<-table.row.start(a)
a<-table.element(a,'Time lag k',header=TRUE)
a<-table.element(a,'ACF(k)',header=TRUE)
a<-table.element(a,'T-STAT',header=TRUE)
a<-table.element(a,'P-value',header=TRUE)
a<-table.row.end(a)
for (i in 2:(par1+1)) {
a<-table.row.start(a)
a<-table.element(a,i-1,header=TRUE)
a<-table.element(a,round(myacf[i],6))
mytstat <- myacf[i]*sqrtn
a<-table.element(a,round(mytstat,4))
a<-table.element(a,round(1-pt(abs(mytstat),lengthx),6))
a<-table.row.end(a)
}
a<-table.end(a)
table.save(a,file='mytable.tab')
a<-table.start()
a<-table.row.start(a)
a<-table.element(a,'Partial Autocorrelation Function',4,TRUE)
a<-table.row.end(a)
a<-table.row.start(a)
a<-table.element(a,'Time lag k',header=TRUE)
a<-table.element(a,'PACF(k)',header=TRUE)
a<-table.element(a,'T-STAT',header=TRUE)
a<-table.element(a,'P-value',header=TRUE)
a<-table.row.end(a)
for (i in 1:par1) {
a<-table.row.start(a)
a<-table.element(a,i,header=TRUE)
a<-table.element(a,round(mypacf[i],6))
mytstat <- mypacf[i]*sqrtn
a<-table.element(a,round(mytstat,4))
a<-table.element(a,round(1-pt(abs(mytstat),lengthx),6))
a<-table.row.end(a)
}
a<-table.end(a)
table.save(a,file='mytable1.tab')