Free Statistics

of Irreproducible Research!

Author's title

Author*The author of this computation has been verified*
R Software Modulerwasp_arimabackwardselection.wasp
Title produced by softwareARIMA Backward Selection
Date of computationFri, 23 Dec 2016 13:21:31 +0100
Cite this page as followsStatistical Computations at FreeStatistics.org, Office for Research Development and Education, URL https://freestatistics.org/blog/index.php?v=date/2016/Dec/23/t1482496528nl1nohjowkk1d3e.htm/, Retrieved Wed, 08 May 2024 00:25:32 +0000
Statistical Computations at FreeStatistics.org, Office for Research Development and Education, URL https://freestatistics.org/blog/index.php?pk=302899, Retrieved Wed, 08 May 2024 00:25:32 +0000
QR Codes:

Original text written by user:
IsPrivate?No (this computation is public)
User-defined keywords
Estimated Impact73
Family? (F = Feedback message, R = changed R code, M = changed R Module, P = changed Parameters, D = changed Data)
-     [(Partial) Autocorrelation Function] [ACF1] [2016-12-22 17:08:50] [267314984f6394bb93cd815224aa34ba]
- RM D    [ARIMA Backward Selection] [ARIMA2] [2016-12-23 12:21:31] [636d0f72197ac5e1dae4a755427db02a] [Current]
Feedback Forum

Post a new message
Dataseries X:
3120
3360
3540
2700
2580
3480
3240
4440
3000
3720
1620
3360
3180
2100
3000
2520
2160
1980
4020
3480
2750
2640
3420
2640
2520
2040
2820
1860
3780
2520
2580
2880
2100
3060
2100
3720
2940
2820
4980
2400
2940
2640
2340
1680
4140
2640
3600
3240
3120
2460
2940


Summary of computational transaction
Raw Input view raw input (R code)
Raw Outputview raw output of R engine
Computing time3 seconds
R ServerBig Analytics Cloud Computing Center
R Framework error message
Warning: there are blank lines in the 'Data' field.
Please, use NA for missing data - blank lines are simply
 deleted and are NOT treated as missing values.

\begin{tabular}{lllllllll}
\hline
Summary of computational transaction \tabularnewline
Raw Input view raw input (R code)  \tabularnewline
Raw Outputview raw output of R engine  \tabularnewline
Computing time3 seconds \tabularnewline
R ServerBig Analytics Cloud Computing Center \tabularnewline
R Framework error message & 
Warning: there are blank lines in the 'Data' field.
Please, use NA for missing data - blank lines are simply
 deleted and are NOT treated as missing values.
\tabularnewline \hline \end{tabular} %Source: https://freestatistics.org/blog/index.php?pk=302899&T=0

[TABLE]
[ROW]
Summary of computational transaction[/C][/ROW] [ROW]Raw Input[/C] view raw input (R code) [/C][/ROW] [ROW]Raw Output[/C]view raw output of R engine [/C][/ROW] [ROW]Computing time[/C]3 seconds[/C][/ROW] [ROW]R Server[/C]Big Analytics Cloud Computing Center[/C][/ROW] [ROW]R Framework error message[/C][C]
Warning: there are blank lines in the 'Data' field.
Please, use NA for missing data - blank lines are simply
 deleted and are NOT treated as missing values.
[/C][/ROW] [/TABLE] Source: https://freestatistics.org/blog/index.php?pk=302899&T=0

Globally Unique Identifier (entire table): ba.freestatistics.org/blog/index.php?pk=302899&T=0

As an alternative you can also use a QR Code:  

The GUIDs for individual cells are displayed in the table below:

Summary of computational transaction
Raw Input view raw input (R code)
Raw Outputview raw output of R engine
Computing time3 seconds
R ServerBig Analytics Cloud Computing Center
R Framework error message
Warning: there are blank lines in the 'Data' field.
Please, use NA for missing data - blank lines are simply
 deleted and are NOT treated as missing values.


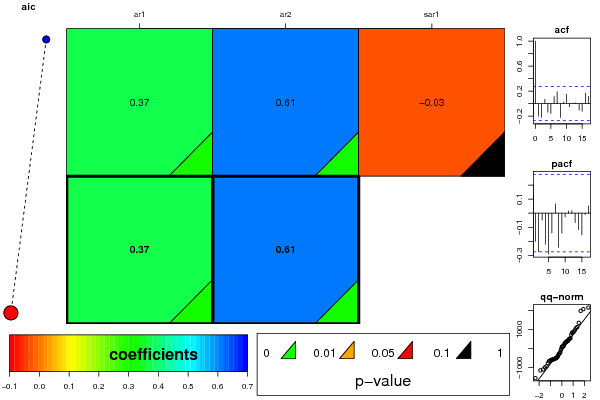
ARIMA Parameter Estimation and Backward Selection
Iterationar1ar2sar1
Estimates ( 1 )0.36690.6108-0.0305
(p-val)(0.0013 )(0 )(0.855 )
Estimates ( 2 )0.36670.60950
(p-val)(0.0013 )(0 )(NA )
Estimates ( 3 )NANANA
(p-val)(NA )(NA )(NA )
Estimates ( 4 )NANANA
(p-val)(NA )(NA )(NA )
Estimates ( 5 )NANANA
(p-val)(NA )(NA )(NA )

\begin{tabular}{lllllllll}
\hline
ARIMA Parameter Estimation and Backward Selection \tabularnewline
Iteration & ar1 & ar2 & sar1 \tabularnewline
Estimates ( 1 ) & 0.3669 & 0.6108 & -0.0305 \tabularnewline
(p-val) & (0.0013 ) & (0 ) & (0.855 ) \tabularnewline
Estimates ( 2 ) & 0.3667 & 0.6095 & 0 \tabularnewline
(p-val) & (0.0013 ) & (0 ) & (NA ) \tabularnewline
Estimates ( 3 ) & NA & NA & NA \tabularnewline
(p-val) & (NA ) & (NA ) & (NA ) \tabularnewline
Estimates ( 4 ) & NA & NA & NA \tabularnewline
(p-val) & (NA ) & (NA ) & (NA ) \tabularnewline
Estimates ( 5 ) & NA & NA & NA \tabularnewline
(p-val) & (NA ) & (NA ) & (NA ) \tabularnewline
\hline
\end{tabular}
%Source: https://freestatistics.org/blog/index.php?pk=302899&T=1

[TABLE]
[ROW][C]ARIMA Parameter Estimation and Backward Selection[/C][/ROW]
[ROW][C]Iteration[/C][C]ar1[/C][C]ar2[/C][C]sar1[/C][/ROW]
[ROW][C]Estimates ( 1 )[/C][C]0.3669[/C][C]0.6108[/C][C]-0.0305[/C][/ROW]
[ROW][C](p-val)[/C][C](0.0013 )[/C][C](0 )[/C][C](0.855 )[/C][/ROW]
[ROW][C]Estimates ( 2 )[/C][C]0.3667[/C][C]0.6095[/C][C]0[/C][/ROW]
[ROW][C](p-val)[/C][C](0.0013 )[/C][C](0 )[/C][C](NA )[/C][/ROW]
[ROW][C]Estimates ( 3 )[/C][C]NA[/C][C]NA[/C][C]NA[/C][/ROW]
[ROW][C](p-val)[/C][C](NA )[/C][C](NA )[/C][C](NA )[/C][/ROW]
[ROW][C]Estimates ( 4 )[/C][C]NA[/C][C]NA[/C][C]NA[/C][/ROW]
[ROW][C](p-val)[/C][C](NA )[/C][C](NA )[/C][C](NA )[/C][/ROW]
[ROW][C]Estimates ( 5 )[/C][C]NA[/C][C]NA[/C][C]NA[/C][/ROW]
[ROW][C](p-val)[/C][C](NA )[/C][C](NA )[/C][C](NA )[/C][/ROW]
[/TABLE]
Source: https://freestatistics.org/blog/index.php?pk=302899&T=1

Globally Unique Identifier (entire table): ba.freestatistics.org/blog/index.php?pk=302899&T=1

As an alternative you can also use a QR Code:  

The GUIDs for individual cells are displayed in the table below:

ARIMA Parameter Estimation and Backward Selection
Iterationar1ar2sar1
Estimates ( 1 )0.36690.6108-0.0305
(p-val)(0.0013 )(0 )(0.855 )
Estimates ( 2 )0.36670.60950
(p-val)(0.0013 )(0 )(NA )
Estimates ( 3 )NANANA
(p-val)(NA )(NA )(NA )
Estimates ( 4 )NANANA
(p-val)(NA )(NA )(NA )
Estimates ( 5 )NANANA
(p-val)(NA )(NA )(NA )


Estimated ARIMA Residuals
Value
845.037182405862
339.064782631832
405.208863681568
-646.833579789997
-568.674072500391
887.936679865802
391.139442143336
1129.52358991272
-603.803556244954
-87.7855105459866
-1573.08330915684
499.071091192509
959.382789758263
-1110.65097172759
299.435110574387
116.81869565757
-614.421087654094
-324.725352092538
1986.05121576351
830.080372386897
-1000.71813850605
-497.347134134397
723.628329601259
-212.205528721327
-508.311693533731
-531.184690754901
541.092669250473
-416.474165026425
1356.9277552888
-13.6232338781774
-593.181678882183
418.486692002178
-562.440547135329
515.352167757686
-281.808252644655
1073.55686893565
276.129108653779
-545.980624502543
2165.86442580624
-1162.3539700523
-940.39409000954
95.3538738075872
-444.254392756702
-779.003714275319
2078.11895267634
111.145197818761
93.3898646540174
339.65719110154
-258.669826366367
-679.860551211201
197.312176610973

\begin{tabular}{lllllllll}
\hline
Estimated ARIMA Residuals \tabularnewline
Value \tabularnewline
 \tabularnewline
845.037182405862 \tabularnewline
339.064782631832 \tabularnewline
405.208863681568 \tabularnewline
-646.833579789997 \tabularnewline
-568.674072500391 \tabularnewline
887.936679865802 \tabularnewline
391.139442143336 \tabularnewline
1129.52358991272 \tabularnewline
-603.803556244954 \tabularnewline
-87.7855105459866 \tabularnewline
-1573.08330915684 \tabularnewline
499.071091192509 \tabularnewline
959.382789758263 \tabularnewline
-1110.65097172759 \tabularnewline
299.435110574387 \tabularnewline
116.81869565757 \tabularnewline
-614.421087654094 \tabularnewline
-324.725352092538 \tabularnewline
1986.05121576351 \tabularnewline
830.080372386897 \tabularnewline
-1000.71813850605 \tabularnewline
-497.347134134397 \tabularnewline
723.628329601259 \tabularnewline
-212.205528721327 \tabularnewline
-508.311693533731 \tabularnewline
-531.184690754901 \tabularnewline
541.092669250473 \tabularnewline
-416.474165026425 \tabularnewline
1356.9277552888 \tabularnewline
-13.6232338781774 \tabularnewline
-593.181678882183 \tabularnewline
418.486692002178 \tabularnewline
-562.440547135329 \tabularnewline
515.352167757686 \tabularnewline
-281.808252644655 \tabularnewline
1073.55686893565 \tabularnewline
276.129108653779 \tabularnewline
-545.980624502543 \tabularnewline
2165.86442580624 \tabularnewline
-1162.3539700523 \tabularnewline
-940.39409000954 \tabularnewline
95.3538738075872 \tabularnewline
-444.254392756702 \tabularnewline
-779.003714275319 \tabularnewline
2078.11895267634 \tabularnewline
111.145197818761 \tabularnewline
93.3898646540174 \tabularnewline
339.65719110154 \tabularnewline
-258.669826366367 \tabularnewline
-679.860551211201 \tabularnewline
197.312176610973 \tabularnewline
\hline
\end{tabular}
%Source: https://freestatistics.org/blog/index.php?pk=302899&T=2

[TABLE]
[ROW][C]Estimated ARIMA Residuals[/C][/ROW]
[ROW][C]Value[/C][/ROW]
[ROW][C][/C][/ROW]
[ROW][C]845.037182405862[/C][/ROW]
[ROW][C]339.064782631832[/C][/ROW]
[ROW][C]405.208863681568[/C][/ROW]
[ROW][C]-646.833579789997[/C][/ROW]
[ROW][C]-568.674072500391[/C][/ROW]
[ROW][C]887.936679865802[/C][/ROW]
[ROW][C]391.139442143336[/C][/ROW]
[ROW][C]1129.52358991272[/C][/ROW]
[ROW][C]-603.803556244954[/C][/ROW]
[ROW][C]-87.7855105459866[/C][/ROW]
[ROW][C]-1573.08330915684[/C][/ROW]
[ROW][C]499.071091192509[/C][/ROW]
[ROW][C]959.382789758263[/C][/ROW]
[ROW][C]-1110.65097172759[/C][/ROW]
[ROW][C]299.435110574387[/C][/ROW]
[ROW][C]116.81869565757[/C][/ROW]
[ROW][C]-614.421087654094[/C][/ROW]
[ROW][C]-324.725352092538[/C][/ROW]
[ROW][C]1986.05121576351[/C][/ROW]
[ROW][C]830.080372386897[/C][/ROW]
[ROW][C]-1000.71813850605[/C][/ROW]
[ROW][C]-497.347134134397[/C][/ROW]
[ROW][C]723.628329601259[/C][/ROW]
[ROW][C]-212.205528721327[/C][/ROW]
[ROW][C]-508.311693533731[/C][/ROW]
[ROW][C]-531.184690754901[/C][/ROW]
[ROW][C]541.092669250473[/C][/ROW]
[ROW][C]-416.474165026425[/C][/ROW]
[ROW][C]1356.9277552888[/C][/ROW]
[ROW][C]-13.6232338781774[/C][/ROW]
[ROW][C]-593.181678882183[/C][/ROW]
[ROW][C]418.486692002178[/C][/ROW]
[ROW][C]-562.440547135329[/C][/ROW]
[ROW][C]515.352167757686[/C][/ROW]
[ROW][C]-281.808252644655[/C][/ROW]
[ROW][C]1073.55686893565[/C][/ROW]
[ROW][C]276.129108653779[/C][/ROW]
[ROW][C]-545.980624502543[/C][/ROW]
[ROW][C]2165.86442580624[/C][/ROW]
[ROW][C]-1162.3539700523[/C][/ROW]
[ROW][C]-940.39409000954[/C][/ROW]
[ROW][C]95.3538738075872[/C][/ROW]
[ROW][C]-444.254392756702[/C][/ROW]
[ROW][C]-779.003714275319[/C][/ROW]
[ROW][C]2078.11895267634[/C][/ROW]
[ROW][C]111.145197818761[/C][/ROW]
[ROW][C]93.3898646540174[/C][/ROW]
[ROW][C]339.65719110154[/C][/ROW]
[ROW][C]-258.669826366367[/C][/ROW]
[ROW][C]-679.860551211201[/C][/ROW]
[ROW][C]197.312176610973[/C][/ROW]
[/TABLE]
Source: https://freestatistics.org/blog/index.php?pk=302899&T=2

Globally Unique Identifier (entire table): ba.freestatistics.org/blog/index.php?pk=302899&T=2

As an alternative you can also use a QR Code:  

The GUIDs for individual cells are displayed in the table below:

Estimated ARIMA Residuals
Value
845.037182405862
339.064782631832
405.208863681568
-646.833579789997
-568.674072500391
887.936679865802
391.139442143336
1129.52358991272
-603.803556244954
-87.7855105459866
-1573.08330915684
499.071091192509
959.382789758263
-1110.65097172759
299.435110574387
116.81869565757
-614.421087654094
-324.725352092538
1986.05121576351
830.080372386897
-1000.71813850605
-497.347134134397
723.628329601259
-212.205528721327
-508.311693533731
-531.184690754901
541.092669250473
-416.474165026425
1356.9277552888
-13.6232338781774
-593.181678882183
418.486692002178
-562.440547135329
515.352167757686
-281.808252644655
1073.55686893565
276.129108653779
-545.980624502543
2165.86442580624
-1162.3539700523
-940.39409000954
95.3538738075872
-444.254392756702
-779.003714275319
2078.11895267634
111.145197818761
93.3898646540174
339.65719110154
-258.669826366367
-679.860551211201
197.312176610973


Parameters (Session):
par1 = 12 ; par2 = -0.3 ; par3 = 0 ; par4 = 1 ; par5 = 12 ; par6 = 3 ; par7 = 1 ; par8 = 2 ; par9 = 0 ; par10 = FALSE ;
Parameters (R input):
par1 = FALSE ; par2 = 1 ; par3 = 0 ; par4 = 0 ; par5 = 12 ; par6 = 2 ; par7 = 0 ; par8 = 1 ; par9 = 0 ;
R code (references can be found in the software module):
library(lattice)
if (par1 == 'TRUE') par1 <- TRUE
if (par1 == 'FALSE') par1 <- FALSE
par2 <- as.numeric(par2) #Box-Cox lambda transformation parameter
par3 <- as.numeric(par3) #degree of non-seasonal differencing
par4 <- as.numeric(par4) #degree of seasonal differencing
par5 <- as.numeric(par5) #seasonal period
par6 <- as.numeric(par6) #degree (p) of the non-seasonal AR(p) polynomial
par7 <- as.numeric(par7) #degree (q) of the non-seasonal MA(q) polynomial
par8 <- as.numeric(par8) #degree (P) of the seasonal AR(P) polynomial
par9 <- as.numeric(par9) #degree (Q) of the seasonal MA(Q) polynomial
armaGR <- function(arima.out, names, n){
try1 <- arima.out$coef
try2 <- sqrt(diag(arima.out$var.coef))
try.data.frame <- data.frame(matrix(NA,ncol=4,nrow=length(names)))
dimnames(try.data.frame) <- list(names,c('coef','std','tstat','pv'))
try.data.frame[,1] <- try1
for(i in 1:length(try2)) try.data.frame[which(rownames(try.data.frame)==names(try2)[i]),2] <- try2[i]
try.data.frame[,3] <- try.data.frame[,1] / try.data.frame[,2]
try.data.frame[,4] <- round((1-pt(abs(try.data.frame[,3]),df=n-(length(try2)+1)))*2,5)
vector <- rep(NA,length(names))
vector[is.na(try.data.frame[,4])] <- 0
maxi <- which.max(try.data.frame[,4])
continue <- max(try.data.frame[,4],na.rm=TRUE) > .05
vector[maxi] <- 0
list(summary=try.data.frame,next.vector=vector,continue=continue)
}
arimaSelect <- function(series, order=c(13,0,0), seasonal=list(order=c(2,0,0),period=12), include.mean=F){
nrc <- order[1]+order[3]+seasonal$order[1]+seasonal$order[3]
coeff <- matrix(NA, nrow=nrc*2, ncol=nrc)
pval <- matrix(NA, nrow=nrc*2, ncol=nrc)
mylist <- rep(list(NULL), nrc)
names <- NULL
if(order[1] > 0) names <- paste('ar',1:order[1],sep='')
if(order[3] > 0) names <- c( names , paste('ma',1:order[3],sep='') )
if(seasonal$order[1] > 0) names <- c(names, paste('sar',1:seasonal$order[1],sep=''))
if(seasonal$order[3] > 0) names <- c(names, paste('sma',1:seasonal$order[3],sep=''))
arima.out <- arima(series, order=order, seasonal=seasonal, include.mean=include.mean, method='ML')
mylist[[1]] <- arima.out
last.arma <- armaGR(arima.out, names, length(series))
mystop <- FALSE
i <- 1
coeff[i,] <- last.arma[[1]][,1]
pval [i,] <- last.arma[[1]][,4]
i <- 2
aic <- arima.out$aic
while(!mystop){
mylist[[i]] <- arima.out
arima.out <- arima(series, order=order, seasonal=seasonal, include.mean=include.mean, method='ML', fixed=last.arma$next.vector)
aic <- c(aic, arima.out$aic)
last.arma <- armaGR(arima.out, names, length(series))
mystop <- !last.arma$continue
coeff[i,] <- last.arma[[1]][,1]
pval [i,] <- last.arma[[1]][,4]
i <- i+1
}
list(coeff, pval, mylist, aic=aic)
}
arimaSelectplot <- function(arimaSelect.out,noms,choix){
noms <- names(arimaSelect.out[[3]][[1]]$coef)
coeff <- arimaSelect.out[[1]]
k <- min(which(is.na(coeff[,1])))-1
coeff <- coeff[1:k,]
pval <- arimaSelect.out[[2]][1:k,]
aic <- arimaSelect.out$aic[1:k]
coeff[coeff==0] <- NA
n <- ncol(coeff)
if(missing(choix)) choix <- k
layout(matrix(c(1,1,1,2,
3,3,3,2,
3,3,3,4,
5,6,7,7),nr=4),
widths=c(10,35,45,15),
heights=c(30,30,15,15))
couleurs <- rainbow(75)[1:50]#(50)
ticks <- pretty(coeff)
par(mar=c(1,1,3,1))
plot(aic,k:1-.5,type='o',pch=21,bg='blue',cex=2,axes=F,lty=2,xpd=NA)
points(aic[choix],k-choix+.5,pch=21,cex=4,bg=2,xpd=NA)
title('aic',line=2)
par(mar=c(3,0,0,0))
plot(0,axes=F,xlab='',ylab='',xlim=range(ticks),ylim=c(.1,1))
rect(xleft = min(ticks) + (0:49)/50*(max(ticks)-min(ticks)),
xright = min(ticks) + (1:50)/50*(max(ticks)-min(ticks)),
ytop = rep(1,50),
ybottom= rep(0,50),col=couleurs,border=NA)
axis(1,ticks)
rect(xleft=min(ticks),xright=max(ticks),ytop=1,ybottom=0)
text(mean(coeff,na.rm=T),.5,'coefficients',cex=2,font=2)
par(mar=c(1,1,3,1))
image(1:n,1:k,t(coeff[k:1,]),axes=F,col=couleurs,zlim=range(ticks))
for(i in 1:n) for(j in 1:k) if(!is.na(coeff[j,i])) {
if(pval[j,i]<.01) symb = 'green'
else if( (pval[j,i]<.05) & (pval[j,i]>=.01)) symb = 'orange'
else if( (pval[j,i]<.1) & (pval[j,i]>=.05)) symb = 'red'
else symb = 'black'
polygon(c(i+.5 ,i+.2 ,i+.5 ,i+.5),
c(k-j+0.5,k-j+0.5,k-j+0.8,k-j+0.5),
col=symb)
if(j==choix) {
rect(xleft=i-.5,
xright=i+.5,
ybottom=k-j+1.5,
ytop=k-j+.5,
lwd=4)
text(i,
k-j+1,
round(coeff[j,i],2),
cex=1.2,
font=2)
}
else{
rect(xleft=i-.5,xright=i+.5,ybottom=k-j+1.5,ytop=k-j+.5)
text(i,k-j+1,round(coeff[j,i],2),cex=1.2,font=1)
}
}
axis(3,1:n,noms)
par(mar=c(0.5,0,0,0.5))
plot(0,axes=F,xlab='',ylab='',type='n',xlim=c(0,8),ylim=c(-.2,.8))
cols <- c('green','orange','red','black')
niv <- c('0','0.01','0.05','0.1')
for(i in 0:3){
polygon(c(1+2*i ,1+2*i ,1+2*i-.5 ,1+2*i),
c(.4 ,.7 , .4 , .4),
col=cols[i+1])
text(2*i,0.5,niv[i+1],cex=1.5)
}
text(8,.5,1,cex=1.5)
text(4,0,'p-value',cex=2)
box()
residus <- arimaSelect.out[[3]][[choix]]$res
par(mar=c(1,2,4,1))
acf(residus,main='')
title('acf',line=.5)
par(mar=c(1,2,4,1))
pacf(residus,main='')
title('pacf',line=.5)
par(mar=c(2,2,4,1))
qqnorm(residus,main='')
title('qq-norm',line=.5)
qqline(residus)
residus
}
if (par2 == 0) x <- log(x)
if (par2 != 0) x <- x^par2
(selection <- arimaSelect(x, order=c(par6,par3,par7), seasonal=list(order=c(par8,par4,par9), period=par5)))
bitmap(file='test1.png')
resid <- arimaSelectplot(selection)
dev.off()
resid
bitmap(file='test2.png')
acf(resid,length(resid)/2, main='Residual Autocorrelation Function')
dev.off()
bitmap(file='test3.png')
pacf(resid,length(resid)/2, main='Residual Partial Autocorrelation Function')
dev.off()
bitmap(file='test4.png')
cpgram(resid, main='Residual Cumulative Periodogram')
dev.off()
bitmap(file='test5.png')
hist(resid, main='Residual Histogram', xlab='values of Residuals')
dev.off()
bitmap(file='test6.png')
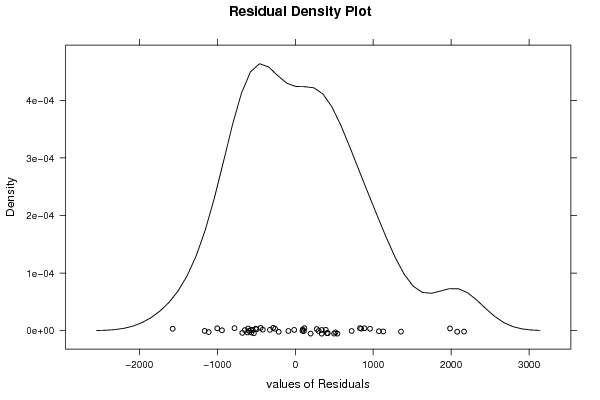
densityplot(~resid,col='black',main='Residual Density Plot', xlab='values of Residuals')
dev.off()
bitmap(file='test7.png')
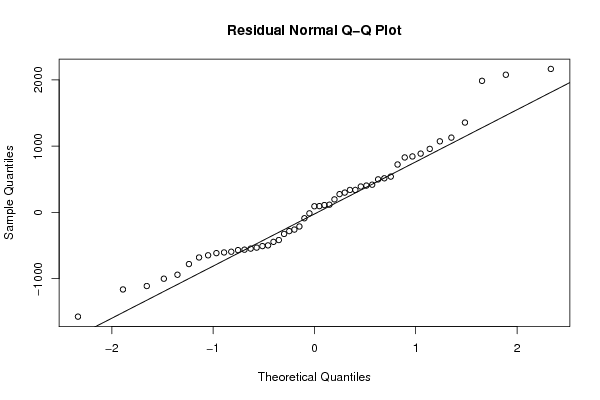
qqnorm(resid, main='Residual Normal Q-Q Plot')
qqline(resid)
dev.off()
ncols <- length(selection[[1]][1,])
nrows <- length(selection[[2]][,1])-1
load(file='createtable')
a<-table.start()
a<-table.row.start(a)
a<-table.element(a,'ARIMA Parameter Estimation and Backward Selection', ncols+1,TRUE)
a<-table.row.end(a)
a<-table.row.start(a)
a<-table.element(a,'Iteration', header=TRUE)
for (i in 1:ncols) {
a<-table.element(a,names(selection[[3]][[1]]$coef)[i],header=TRUE)
}
a<-table.row.end(a)
for (j in 1:nrows) {
a<-table.row.start(a)
mydum <- 'Estimates ('
mydum <- paste(mydum,j)
mydum <- paste(mydum,')')
a<-table.element(a,mydum, header=TRUE)
for (i in 1:ncols) {
a<-table.element(a,round(selection[[1]][j,i],4))
}
a<-table.row.end(a)
a<-table.row.start(a)
a<-table.element(a,'(p-val)', header=TRUE)
for (i in 1:ncols) {
mydum <- '('
mydum <- paste(mydum,round(selection[[2]][j,i],4),sep='')
mydum <- paste(mydum,')')
a<-table.element(a,mydum)
}
a<-table.row.end(a)
}
a<-table.end(a)
table.save(a,file='mytable.tab')
a<-table.start()
a<-table.row.start(a)
a<-table.element(a,'Estimated ARIMA Residuals', 1,TRUE)
a<-table.row.end(a)
a<-table.row.start(a)
a<-table.element(a,'Value', 1,TRUE)
a<-table.row.end(a)
for (i in (par4*par5+par3):length(resid)) {
a<-table.row.start(a)
a<-table.element(a,resid[i])
a<-table.row.end(a)
}
a<-table.end(a)
table.save(a,file='mytable1.tab')