Free Statistics

of Irreproducible Research!

Author's title

Author*The author of this computation has been verified*
R Software Modulerwasp_arimabackwardselection.wasp
Title produced by softwareARIMA Backward Selection
Date of computationFri, 23 Dec 2016 13:56:50 +0100
Cite this page as followsStatistical Computations at FreeStatistics.org, Office for Research Development and Education, URL https://freestatistics.org/blog/index.php?v=date/2016/Dec/23/t1482497932pt731n6m9agu99q.htm/, Retrieved Tue, 07 May 2024 21:05:31 +0000
Statistical Computations at FreeStatistics.org, Office for Research Development and Education, URL https://freestatistics.org/blog/index.php?pk=302919, Retrieved Tue, 07 May 2024 21:05:31 +0000
QR Codes:

Original text written by user:
IsPrivate?No (this computation is public)
User-defined keywords
Estimated Impact78
Family? (F = Feedback message, R = changed R code, M = changed R Module, P = changed Parameters, D = changed Data)
-       [ARIMA Backward Selection] [] [2016-12-23 12:56:50] [c6ea875f0603e0876d03f43aca979571] [Current]
Feedback Forum

Post a new message
Dataseries X:
1565
1460
1780
1990
2460
2155
2290
2685
2880
3680
3110
3735
3420
2620
3485
2920
3530
3600
3580
3580
4440
5030
4965
4765
4290
2990
5600
4135
5280
4275
3640
4190
4260
5020
6380
4355
5435
4520
4350
4395
5255
4515
4460
5230
6155
6320
5645
5940
6530
4250
4155
4625
4075
5135
4375
4845
6470
6670
6110
5805
4790
4750
3805
3890
3485
3945
3730
3850
5155
5615
6120
5805
5010
4520
4180
3825
4145
3720
3525
4375
5020
4790
5180
4700
4110
3380
3820
3220
2605
2930
2360
2935
3380
4495
3960
3440
3400
2825
2555
2355
2545
2715
2535
2740
3050
3695
4270
3480
3490
3400
3445
3090
3250
3140
3100
3680


Summary of computational transaction
Raw Input view raw input (R code)
Raw Outputview raw output of R engine
Computing time5 seconds
R ServerBig Analytics Cloud Computing Center

\begin{tabular}{lllllllll}
\hline
Summary of computational transaction \tabularnewline
Raw Input view raw input (R code)  \tabularnewline
Raw Outputview raw output of R engine  \tabularnewline
Computing time5 seconds \tabularnewline
R ServerBig Analytics Cloud Computing Center \tabularnewline
\hline
\end{tabular}
%Source: https://freestatistics.org/blog/index.php?pk=302919&T=0

[TABLE]
[ROW]
Summary of computational transaction[/C][/ROW] [ROW]Raw Input[/C] view raw input (R code) [/C][/ROW] [ROW]Raw Output[/C]view raw output of R engine [/C][/ROW] [ROW]Computing time[/C]5 seconds[/C][/ROW] [ROW]R Server[/C]Big Analytics Cloud Computing Center[/C][/ROW] [/TABLE] Source: https://freestatistics.org/blog/index.php?pk=302919&T=0

Globally Unique Identifier (entire table): ba.freestatistics.org/blog/index.php?pk=302919&T=0

As an alternative you can also use a QR Code:  

The GUIDs for individual cells are displayed in the table below:

Summary of computational transaction
Raw Input view raw input (R code)
Raw Outputview raw output of R engine
Computing time5 seconds
R ServerBig Analytics Cloud Computing Center


ARIMA Parameter Estimation and Backward Selection
Iterationar1ar2ma1sar1sar2sma1
Estimates ( 1 )-0.6346-0.3189-0.96420.1953-0.08-0.9321
(p-val)(0 )(0.0018 )(0 )(0.1748 )(0.4955 )(0.0051 )
Estimates ( 2 )-0.6439-0.3209-0.96770.20990-1.021
(p-val)(0 )(0.0015 )(0 )(0.0783 )(NA )(0 )
Estimates ( 3 )-0.6455-0.2844-1.044100-0.8145
(p-val)(0 )(0.0052 )(0 )(NA )(NA )(0 )
Estimates ( 4 )NANANANANANA
(p-val)(NA )(NA )(NA )(NA )(NA )(NA )
Estimates ( 5 )NANANANANANA
(p-val)(NA )(NA )(NA )(NA )(NA )(NA )
Estimates ( 6 )NANANANANANA
(p-val)(NA )(NA )(NA )(NA )(NA )(NA )
Estimates ( 7 )NANANANANANA
(p-val)(NA )(NA )(NA )(NA )(NA )(NA )
Estimates ( 8 )NANANANANANA
(p-val)(NA )(NA )(NA )(NA )(NA )(NA )
Estimates ( 9 )NANANANANANA
(p-val)(NA )(NA )(NA )(NA )(NA )(NA )
Estimates ( 10 )NANANANANANA
(p-val)(NA )(NA )(NA )(NA )(NA )(NA )
Estimates ( 11 )NANANANANANA
(p-val)(NA )(NA )(NA )(NA )(NA )(NA )

\begin{tabular}{lllllllll}
\hline
ARIMA Parameter Estimation and Backward Selection \tabularnewline
Iteration & ar1 & ar2 & ma1 & sar1 & sar2 & sma1 \tabularnewline
Estimates ( 1 ) & -0.6346 & -0.3189 & -0.9642 & 0.1953 & -0.08 & -0.9321 \tabularnewline
(p-val) & (0 ) & (0.0018 ) & (0 ) & (0.1748 ) & (0.4955 ) & (0.0051 ) \tabularnewline
Estimates ( 2 ) & -0.6439 & -0.3209 & -0.9677 & 0.2099 & 0 & -1.021 \tabularnewline
(p-val) & (0 ) & (0.0015 ) & (0 ) & (0.0783 ) & (NA ) & (0 ) \tabularnewline
Estimates ( 3 ) & -0.6455 & -0.2844 & -1.0441 & 0 & 0 & -0.8145 \tabularnewline
(p-val) & (0 ) & (0.0052 ) & (0 ) & (NA ) & (NA ) & (0 ) \tabularnewline
Estimates ( 4 ) & NA & NA & NA & NA & NA & NA \tabularnewline
(p-val) & (NA ) & (NA ) & (NA ) & (NA ) & (NA ) & (NA ) \tabularnewline
Estimates ( 5 ) & NA & NA & NA & NA & NA & NA \tabularnewline
(p-val) & (NA ) & (NA ) & (NA ) & (NA ) & (NA ) & (NA ) \tabularnewline
Estimates ( 6 ) & NA & NA & NA & NA & NA & NA \tabularnewline
(p-val) & (NA ) & (NA ) & (NA ) & (NA ) & (NA ) & (NA ) \tabularnewline
Estimates ( 7 ) & NA & NA & NA & NA & NA & NA \tabularnewline
(p-val) & (NA ) & (NA ) & (NA ) & (NA ) & (NA ) & (NA ) \tabularnewline
Estimates ( 8 ) & NA & NA & NA & NA & NA & NA \tabularnewline
(p-val) & (NA ) & (NA ) & (NA ) & (NA ) & (NA ) & (NA ) \tabularnewline
Estimates ( 9 ) & NA & NA & NA & NA & NA & NA \tabularnewline
(p-val) & (NA ) & (NA ) & (NA ) & (NA ) & (NA ) & (NA ) \tabularnewline
Estimates ( 10 ) & NA & NA & NA & NA & NA & NA \tabularnewline
(p-val) & (NA ) & (NA ) & (NA ) & (NA ) & (NA ) & (NA ) \tabularnewline
Estimates ( 11 ) & NA & NA & NA & NA & NA & NA \tabularnewline
(p-val) & (NA ) & (NA ) & (NA ) & (NA ) & (NA ) & (NA ) \tabularnewline
\hline
\end{tabular}
%Source: https://freestatistics.org/blog/index.php?pk=302919&T=1

[TABLE]
[ROW][C]ARIMA Parameter Estimation and Backward Selection[/C][/ROW]
[ROW][C]Iteration[/C][C]ar1[/C][C]ar2[/C][C]ma1[/C][C]sar1[/C][C]sar2[/C][C]sma1[/C][/ROW]
[ROW][C]Estimates ( 1 )[/C][C]-0.6346[/C][C]-0.3189[/C][C]-0.9642[/C][C]0.1953[/C][C]-0.08[/C][C]-0.9321[/C][/ROW]
[ROW][C](p-val)[/C][C](0 )[/C][C](0.0018 )[/C][C](0 )[/C][C](0.1748 )[/C][C](0.4955 )[/C][C](0.0051 )[/C][/ROW]
[ROW][C]Estimates ( 2 )[/C][C]-0.6439[/C][C]-0.3209[/C][C]-0.9677[/C][C]0.2099[/C][C]0[/C][C]-1.021[/C][/ROW]
[ROW][C](p-val)[/C][C](0 )[/C][C](0.0015 )[/C][C](0 )[/C][C](0.0783 )[/C][C](NA )[/C][C](0 )[/C][/ROW]
[ROW][C]Estimates ( 3 )[/C][C]-0.6455[/C][C]-0.2844[/C][C]-1.0441[/C][C]0[/C][C]0[/C][C]-0.8145[/C][/ROW]
[ROW][C](p-val)[/C][C](0 )[/C][C](0.0052 )[/C][C](0 )[/C][C](NA )[/C][C](NA )[/C][C](0 )[/C][/ROW]
[ROW][C]Estimates ( 4 )[/C][C]NA[/C][C]NA[/C][C]NA[/C][C]NA[/C][C]NA[/C][C]NA[/C][/ROW]
[ROW][C](p-val)[/C][C](NA )[/C][C](NA )[/C][C](NA )[/C][C](NA )[/C][C](NA )[/C][C](NA )[/C][/ROW]
[ROW][C]Estimates ( 5 )[/C][C]NA[/C][C]NA[/C][C]NA[/C][C]NA[/C][C]NA[/C][C]NA[/C][/ROW]
[ROW][C](p-val)[/C][C](NA )[/C][C](NA )[/C][C](NA )[/C][C](NA )[/C][C](NA )[/C][C](NA )[/C][/ROW]
[ROW][C]Estimates ( 6 )[/C][C]NA[/C][C]NA[/C][C]NA[/C][C]NA[/C][C]NA[/C][C]NA[/C][/ROW]
[ROW][C](p-val)[/C][C](NA )[/C][C](NA )[/C][C](NA )[/C][C](NA )[/C][C](NA )[/C][C](NA )[/C][/ROW]
[ROW][C]Estimates ( 7 )[/C][C]NA[/C][C]NA[/C][C]NA[/C][C]NA[/C][C]NA[/C][C]NA[/C][/ROW]
[ROW][C](p-val)[/C][C](NA )[/C][C](NA )[/C][C](NA )[/C][C](NA )[/C][C](NA )[/C][C](NA )[/C][/ROW]
[ROW][C]Estimates ( 8 )[/C][C]NA[/C][C]NA[/C][C]NA[/C][C]NA[/C][C]NA[/C][C]NA[/C][/ROW]
[ROW][C](p-val)[/C][C](NA )[/C][C](NA )[/C][C](NA )[/C][C](NA )[/C][C](NA )[/C][C](NA )[/C][/ROW]
[ROW][C]Estimates ( 9 )[/C][C]NA[/C][C]NA[/C][C]NA[/C][C]NA[/C][C]NA[/C][C]NA[/C][/ROW]
[ROW][C](p-val)[/C][C](NA )[/C][C](NA )[/C][C](NA )[/C][C](NA )[/C][C](NA )[/C][C](NA )[/C][/ROW]
[ROW][C]Estimates ( 10 )[/C][C]NA[/C][C]NA[/C][C]NA[/C][C]NA[/C][C]NA[/C][C]NA[/C][/ROW]
[ROW][C](p-val)[/C][C](NA )[/C][C](NA )[/C][C](NA )[/C][C](NA )[/C][C](NA )[/C][C](NA )[/C][/ROW]
[ROW][C]Estimates ( 11 )[/C][C]NA[/C][C]NA[/C][C]NA[/C][C]NA[/C][C]NA[/C][C]NA[/C][/ROW]
[ROW][C](p-val)[/C][C](NA )[/C][C](NA )[/C][C](NA )[/C][C](NA )[/C][C](NA )[/C][C](NA )[/C][/ROW]
[/TABLE]
Source: https://freestatistics.org/blog/index.php?pk=302919&T=1

Globally Unique Identifier (entire table): ba.freestatistics.org/blog/index.php?pk=302919&T=1

As an alternative you can also use a QR Code:  

The GUIDs for individual cells are displayed in the table below:

ARIMA Parameter Estimation and Backward Selection
Iterationar1ar2ma1sar1sar2sma1
Estimates ( 1 )-0.6346-0.3189-0.96420.1953-0.08-0.9321
(p-val)(0 )(0.0018 )(0 )(0.1748 )(0.4955 )(0.0051 )
Estimates ( 2 )-0.6439-0.3209-0.96770.20990-1.021
(p-val)(0 )(0.0015 )(0 )(0.0783 )(NA )(0 )
Estimates ( 3 )-0.6455-0.2844-1.044100-0.8145
(p-val)(0 )(0.0052 )(0 )(NA )(NA )(0 )
Estimates ( 4 )NANANANANANA
(p-val)(NA )(NA )(NA )(NA )(NA )(NA )
Estimates ( 5 )NANANANANANA
(p-val)(NA )(NA )(NA )(NA )(NA )(NA )
Estimates ( 6 )NANANANANANA
(p-val)(NA )(NA )(NA )(NA )(NA )(NA )
Estimates ( 7 )NANANANANANA
(p-val)(NA )(NA )(NA )(NA )(NA )(NA )
Estimates ( 8 )NANANANANANA
(p-val)(NA )(NA )(NA )(NA )(NA )(NA )
Estimates ( 9 )NANANANANANA
(p-val)(NA )(NA )(NA )(NA )(NA )(NA )
Estimates ( 10 )NANANANANANA
(p-val)(NA )(NA )(NA )(NA )(NA )(NA )
Estimates ( 11 )NANANANANANA
(p-val)(NA )(NA )(NA )(NA )(NA )(NA )


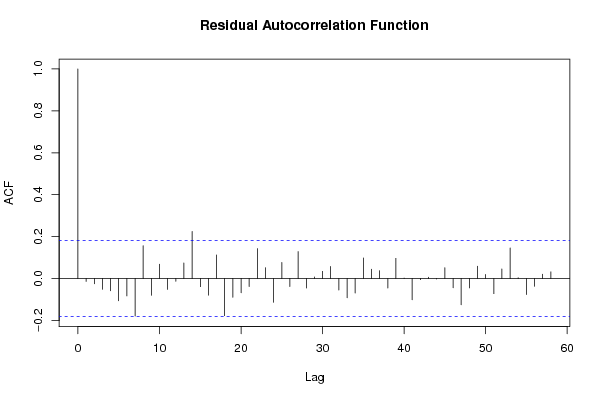
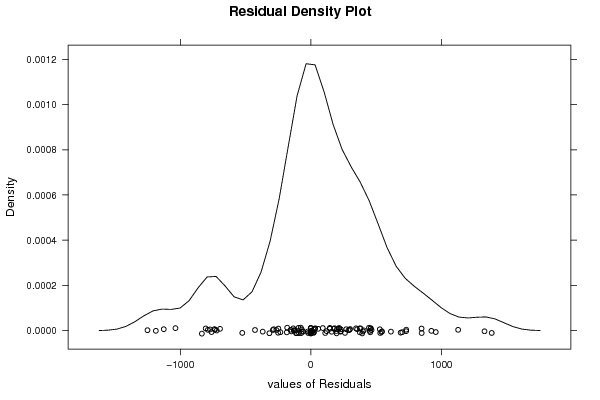
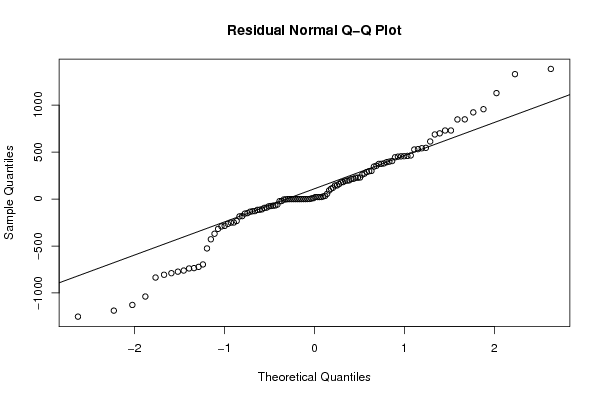
Estimated ARIMA Residuals
Value
-22.7048287061202
464.483135124717
-249.826913652209
159.559323912159
375.484123826376
227.74756617363
-181.574352268814
379.932726627564
145.079168237463
451.478840318914
-428.377190562264
-291.360308358259
-739.030727654281
1330.30277606465
-149.654675363676
374.268246530699
-773.272173349775
-806.281723941248
-129.840620637073
-233.588803531983
91.0482303930397
1385.54673127593
-789.479926294726
699.979752603568
296.364057459346
-1037.87112185379
-73.7698930108751
196.919862054712
271.078919636478
261.168227634049
541.019690630911
923.15603091556
21.5103513561496
-1127.57005593486
299.795327412405
687.903408520923
-761.341106072999
-1252.23125040842
55.6668680333877
-735.130085495577
1128.2119310182
145.066424416307
214.850092428351
847.792074101816
444.63273549229
-128.189136336385
-369.309447093256
-1188.22203204032
613.135849789834
-722.103744158198
-115.394782211096
-696.315510723091
227.51434635832
398.264630378528
120.320934232334
405.101976381929
345.613856353623
956.760955038583
531.605814852413
-109.12562351356
21.5089214418469
-285.245124772106
-264.60571828094
33.064945746888
-251.251531774698
-20.9127727075811
545.299825164628
216.042688890248
-525.747936356621
-91.47463954342
-58.6767662639235
-68.0957065817635
9.68924235419252
392.852406265881
21.0752038110135
-835.577599653205
28.2656766721871
-70.3625894971644
199.619157468958
-154.995437094267
848.791843547028
-5.06061645631321
-113.700390584734
177.858464542863
527.883906749576
-184.672319014005
7.09424688391868
229.380137563233
456.349950508723
454.701638519121
21.7310311001151
-317.894826281057
-135.179361608828
730.237898797556
180.69426699434
288.069994881685
730.097002172646
459.428662470232
109.801970123946
-77.462170411533
-93.9967753983005
194.556252872499
354.102051108922

\begin{tabular}{lllllllll}
\hline
Estimated ARIMA Residuals \tabularnewline
Value \tabularnewline
-22.7048287061202 \tabularnewline
464.483135124717 \tabularnewline
-249.826913652209 \tabularnewline
159.559323912159 \tabularnewline
375.484123826376 \tabularnewline
227.74756617363 \tabularnewline
-181.574352268814 \tabularnewline
379.932726627564 \tabularnewline
145.079168237463 \tabularnewline
451.478840318914 \tabularnewline
-428.377190562264 \tabularnewline
-291.360308358259 \tabularnewline
-739.030727654281 \tabularnewline
1330.30277606465 \tabularnewline
-149.654675363676 \tabularnewline
374.268246530699 \tabularnewline
-773.272173349775 \tabularnewline
-806.281723941248 \tabularnewline
-129.840620637073 \tabularnewline
-233.588803531983 \tabularnewline
91.0482303930397 \tabularnewline
1385.54673127593 \tabularnewline
-789.479926294726 \tabularnewline
699.979752603568 \tabularnewline
296.364057459346 \tabularnewline
-1037.87112185379 \tabularnewline
-73.7698930108751 \tabularnewline
196.919862054712 \tabularnewline
271.078919636478 \tabularnewline
261.168227634049 \tabularnewline
541.019690630911 \tabularnewline
923.15603091556 \tabularnewline
21.5103513561496 \tabularnewline
-1127.57005593486 \tabularnewline
299.795327412405 \tabularnewline
687.903408520923 \tabularnewline
-761.341106072999 \tabularnewline
-1252.23125040842 \tabularnewline
55.6668680333877 \tabularnewline
-735.130085495577 \tabularnewline
1128.2119310182 \tabularnewline
145.066424416307 \tabularnewline
214.850092428351 \tabularnewline
847.792074101816 \tabularnewline
444.63273549229 \tabularnewline
-128.189136336385 \tabularnewline
-369.309447093256 \tabularnewline
-1188.22203204032 \tabularnewline
613.135849789834 \tabularnewline
-722.103744158198 \tabularnewline
-115.394782211096 \tabularnewline
-696.315510723091 \tabularnewline
227.51434635832 \tabularnewline
398.264630378528 \tabularnewline
120.320934232334 \tabularnewline
405.101976381929 \tabularnewline
345.613856353623 \tabularnewline
956.760955038583 \tabularnewline
531.605814852413 \tabularnewline
-109.12562351356 \tabularnewline
21.5089214418469 \tabularnewline
-285.245124772106 \tabularnewline
-264.60571828094 \tabularnewline
33.064945746888 \tabularnewline
-251.251531774698 \tabularnewline
-20.9127727075811 \tabularnewline
545.299825164628 \tabularnewline
216.042688890248 \tabularnewline
-525.747936356621 \tabularnewline
-91.47463954342 \tabularnewline
-58.6767662639235 \tabularnewline
-68.0957065817635 \tabularnewline
9.68924235419252 \tabularnewline
392.852406265881 \tabularnewline
21.0752038110135 \tabularnewline
-835.577599653205 \tabularnewline
28.2656766721871 \tabularnewline
-70.3625894971644 \tabularnewline
199.619157468958 \tabularnewline
-154.995437094267 \tabularnewline
848.791843547028 \tabularnewline
-5.06061645631321 \tabularnewline
-113.700390584734 \tabularnewline
177.858464542863 \tabularnewline
527.883906749576 \tabularnewline
-184.672319014005 \tabularnewline
7.09424688391868 \tabularnewline
229.380137563233 \tabularnewline
456.349950508723 \tabularnewline
454.701638519121 \tabularnewline
21.7310311001151 \tabularnewline
-317.894826281057 \tabularnewline
-135.179361608828 \tabularnewline
730.237898797556 \tabularnewline
180.69426699434 \tabularnewline
288.069994881685 \tabularnewline
730.097002172646 \tabularnewline
459.428662470232 \tabularnewline
109.801970123946 \tabularnewline
-77.462170411533 \tabularnewline
-93.9967753983005 \tabularnewline
194.556252872499 \tabularnewline
354.102051108922 \tabularnewline
\hline
\end{tabular}
%Source: https://freestatistics.org/blog/index.php?pk=302919&T=2

[TABLE]
[ROW][C]Estimated ARIMA Residuals[/C][/ROW]
[ROW][C]Value[/C][/ROW]
[ROW][C]-22.7048287061202[/C][/ROW]
[ROW][C]464.483135124717[/C][/ROW]
[ROW][C]-249.826913652209[/C][/ROW]
[ROW][C]159.559323912159[/C][/ROW]
[ROW][C]375.484123826376[/C][/ROW]
[ROW][C]227.74756617363[/C][/ROW]
[ROW][C]-181.574352268814[/C][/ROW]
[ROW][C]379.932726627564[/C][/ROW]
[ROW][C]145.079168237463[/C][/ROW]
[ROW][C]451.478840318914[/C][/ROW]
[ROW][C]-428.377190562264[/C][/ROW]
[ROW][C]-291.360308358259[/C][/ROW]
[ROW][C]-739.030727654281[/C][/ROW]
[ROW][C]1330.30277606465[/C][/ROW]
[ROW][C]-149.654675363676[/C][/ROW]
[ROW][C]374.268246530699[/C][/ROW]
[ROW][C]-773.272173349775[/C][/ROW]
[ROW][C]-806.281723941248[/C][/ROW]
[ROW][C]-129.840620637073[/C][/ROW]
[ROW][C]-233.588803531983[/C][/ROW]
[ROW][C]91.0482303930397[/C][/ROW]
[ROW][C]1385.54673127593[/C][/ROW]
[ROW][C]-789.479926294726[/C][/ROW]
[ROW][C]699.979752603568[/C][/ROW]
[ROW][C]296.364057459346[/C][/ROW]
[ROW][C]-1037.87112185379[/C][/ROW]
[ROW][C]-73.7698930108751[/C][/ROW]
[ROW][C]196.919862054712[/C][/ROW]
[ROW][C]271.078919636478[/C][/ROW]
[ROW][C]261.168227634049[/C][/ROW]
[ROW][C]541.019690630911[/C][/ROW]
[ROW][C]923.15603091556[/C][/ROW]
[ROW][C]21.5103513561496[/C][/ROW]
[ROW][C]-1127.57005593486[/C][/ROW]
[ROW][C]299.795327412405[/C][/ROW]
[ROW][C]687.903408520923[/C][/ROW]
[ROW][C]-761.341106072999[/C][/ROW]
[ROW][C]-1252.23125040842[/C][/ROW]
[ROW][C]55.6668680333877[/C][/ROW]
[ROW][C]-735.130085495577[/C][/ROW]
[ROW][C]1128.2119310182[/C][/ROW]
[ROW][C]145.066424416307[/C][/ROW]
[ROW][C]214.850092428351[/C][/ROW]
[ROW][C]847.792074101816[/C][/ROW]
[ROW][C]444.63273549229[/C][/ROW]
[ROW][C]-128.189136336385[/C][/ROW]
[ROW][C]-369.309447093256[/C][/ROW]
[ROW][C]-1188.22203204032[/C][/ROW]
[ROW][C]613.135849789834[/C][/ROW]
[ROW][C]-722.103744158198[/C][/ROW]
[ROW][C]-115.394782211096[/C][/ROW]
[ROW][C]-696.315510723091[/C][/ROW]
[ROW][C]227.51434635832[/C][/ROW]
[ROW][C]398.264630378528[/C][/ROW]
[ROW][C]120.320934232334[/C][/ROW]
[ROW][C]405.101976381929[/C][/ROW]
[ROW][C]345.613856353623[/C][/ROW]
[ROW][C]956.760955038583[/C][/ROW]
[ROW][C]531.605814852413[/C][/ROW]
[ROW][C]-109.12562351356[/C][/ROW]
[ROW][C]21.5089214418469[/C][/ROW]
[ROW][C]-285.245124772106[/C][/ROW]
[ROW][C]-264.60571828094[/C][/ROW]
[ROW][C]33.064945746888[/C][/ROW]
[ROW][C]-251.251531774698[/C][/ROW]
[ROW][C]-20.9127727075811[/C][/ROW]
[ROW][C]545.299825164628[/C][/ROW]
[ROW][C]216.042688890248[/C][/ROW]
[ROW][C]-525.747936356621[/C][/ROW]
[ROW][C]-91.47463954342[/C][/ROW]
[ROW][C]-58.6767662639235[/C][/ROW]
[ROW][C]-68.0957065817635[/C][/ROW]
[ROW][C]9.68924235419252[/C][/ROW]
[ROW][C]392.852406265881[/C][/ROW]
[ROW][C]21.0752038110135[/C][/ROW]
[ROW][C]-835.577599653205[/C][/ROW]
[ROW][C]28.2656766721871[/C][/ROW]
[ROW][C]-70.3625894971644[/C][/ROW]
[ROW][C]199.619157468958[/C][/ROW]
[ROW][C]-154.995437094267[/C][/ROW]
[ROW][C]848.791843547028[/C][/ROW]
[ROW][C]-5.06061645631321[/C][/ROW]
[ROW][C]-113.700390584734[/C][/ROW]
[ROW][C]177.858464542863[/C][/ROW]
[ROW][C]527.883906749576[/C][/ROW]
[ROW][C]-184.672319014005[/C][/ROW]
[ROW][C]7.09424688391868[/C][/ROW]
[ROW][C]229.380137563233[/C][/ROW]
[ROW][C]456.349950508723[/C][/ROW]
[ROW][C]454.701638519121[/C][/ROW]
[ROW][C]21.7310311001151[/C][/ROW]
[ROW][C]-317.894826281057[/C][/ROW]
[ROW][C]-135.179361608828[/C][/ROW]
[ROW][C]730.237898797556[/C][/ROW]
[ROW][C]180.69426699434[/C][/ROW]
[ROW][C]288.069994881685[/C][/ROW]
[ROW][C]730.097002172646[/C][/ROW]
[ROW][C]459.428662470232[/C][/ROW]
[ROW][C]109.801970123946[/C][/ROW]
[ROW][C]-77.462170411533[/C][/ROW]
[ROW][C]-93.9967753983005[/C][/ROW]
[ROW][C]194.556252872499[/C][/ROW]
[ROW][C]354.102051108922[/C][/ROW]
[/TABLE]
Source: https://freestatistics.org/blog/index.php?pk=302919&T=2

Globally Unique Identifier (entire table): ba.freestatistics.org/blog/index.php?pk=302919&T=2

As an alternative you can also use a QR Code:  

The GUIDs for individual cells are displayed in the table below:

Estimated ARIMA Residuals
Value
-22.7048287061202
464.483135124717
-249.826913652209
159.559323912159
375.484123826376
227.74756617363
-181.574352268814
379.932726627564
145.079168237463
451.478840318914
-428.377190562264
-291.360308358259
-739.030727654281
1330.30277606465
-149.654675363676
374.268246530699
-773.272173349775
-806.281723941248
-129.840620637073
-233.588803531983
91.0482303930397
1385.54673127593
-789.479926294726
699.979752603568
296.364057459346
-1037.87112185379
-73.7698930108751
196.919862054712
271.078919636478
261.168227634049
541.019690630911
923.15603091556
21.5103513561496
-1127.57005593486
299.795327412405
687.903408520923
-761.341106072999
-1252.23125040842
55.6668680333877
-735.130085495577
1128.2119310182
145.066424416307
214.850092428351
847.792074101816
444.63273549229
-128.189136336385
-369.309447093256
-1188.22203204032
613.135849789834
-722.103744158198
-115.394782211096
-696.315510723091
227.51434635832
398.264630378528
120.320934232334
405.101976381929
345.613856353623
956.760955038583
531.605814852413
-109.12562351356
21.5089214418469
-285.245124772106
-264.60571828094
33.064945746888
-251.251531774698
-20.9127727075811
545.299825164628
216.042688890248
-525.747936356621
-91.47463954342
-58.6767662639235
-68.0957065817635
9.68924235419252
392.852406265881
21.0752038110135
-835.577599653205
28.2656766721871
-70.3625894971644
199.619157468958
-154.995437094267
848.791843547028
-5.06061645631321
-113.700390584734
177.858464542863
527.883906749576
-184.672319014005
7.09424688391868
229.380137563233
456.349950508723
454.701638519121
21.7310311001151
-317.894826281057
-135.179361608828
730.237898797556
180.69426699434
288.069994881685
730.097002172646
459.428662470232
109.801970123946
-77.462170411533
-93.9967753983005
194.556252872499
354.102051108922


Parameters (Session):
par2 = grey ; par3 = FALSE ; par4 = 5-point Likert ;
Parameters (R input):
par1 = FALSE ; par2 = 1 ; par3 = 2 ; par4 = 1 ; par5 = 12 ; par6 = 2 ; par7 = 1 ; par8 = 2 ; par9 = 1 ;
R code (references can be found in the software module):
par9 <- '1'
par8 <- '2'
par7 <- '1'
par6 <- '3'
par5 <- '12'
par4 <- '1'
par3 <- '2'
par2 <- '1'
par1 <- 'FALSE'
library(lattice)
if (par1 == 'TRUE') par1 <- TRUE
if (par1 == 'FALSE') par1 <- FALSE
par2 <- as.numeric(par2) #Box-Cox lambda transformation parameter
par3 <- as.numeric(par3) #degree of non-seasonal differencing
par4 <- as.numeric(par4) #degree of seasonal differencing
par5 <- as.numeric(par5) #seasonal period
par6 <- as.numeric(par6) #degree (p) of the non-seasonal AR(p) polynomial
par7 <- as.numeric(par7) #degree (q) of the non-seasonal MA(q) polynomial
par8 <- as.numeric(par8) #degree (P) of the seasonal AR(P) polynomial
par9 <- as.numeric(par9) #degree (Q) of the seasonal MA(Q) polynomial
armaGR <- function(arima.out, names, n){
try1 <- arima.out$coef
try2 <- sqrt(diag(arima.out$var.coef))
try.data.frame <- data.frame(matrix(NA,ncol=4,nrow=length(names)))
dimnames(try.data.frame) <- list(names,c('coef','std','tstat','pv'))
try.data.frame[,1] <- try1
for(i in 1:length(try2)) try.data.frame[which(rownames(try.data.frame)==names(try2)[i]),2] <- try2[i]
try.data.frame[,3] <- try.data.frame[,1] / try.data.frame[,2]
try.data.frame[,4] <- round((1-pt(abs(try.data.frame[,3]),df=n-(length(try2)+1)))*2,5)
vector <- rep(NA,length(names))
vector[is.na(try.data.frame[,4])] <- 0
maxi <- which.max(try.data.frame[,4])
continue <- max(try.data.frame[,4],na.rm=TRUE) > .05
vector[maxi] <- 0
list(summary=try.data.frame,next.vector=vector,continue=continue)
}
arimaSelect <- function(series, order=c(13,0,0), seasonal=list(order=c(2,0,0),period=12), include.mean=F){
nrc <- order[1]+order[3]+seasonal$order[1]+seasonal$order[3]
coeff <- matrix(NA, nrow=nrc*2, ncol=nrc)
pval <- matrix(NA, nrow=nrc*2, ncol=nrc)
mylist <- rep(list(NULL), nrc)
names <- NULL
if(order[1] > 0) names <- paste('ar',1:order[1],sep='')
if(order[3] > 0) names <- c( names , paste('ma',1:order[3],sep='') )
if(seasonal$order[1] > 0) names <- c(names, paste('sar',1:seasonal$order[1],sep=''))
if(seasonal$order[3] > 0) names <- c(names, paste('sma',1:seasonal$order[3],sep=''))
arima.out <- arima(series, order=order, seasonal=seasonal, include.mean=include.mean, method='ML')
mylist[[1]] <- arima.out
last.arma <- armaGR(arima.out, names, length(series))
mystop <- FALSE
i <- 1
coeff[i,] <- last.arma[[1]][,1]
pval [i,] <- last.arma[[1]][,4]
i <- 2
aic <- arima.out$aic
while(!mystop){
mylist[[i]] <- arima.out
arima.out <- arima(series, order=order, seasonal=seasonal, include.mean=include.mean, method='ML', fixed=last.arma$next.vector)
aic <- c(aic, arima.out$aic)
last.arma <- armaGR(arima.out, names, length(series))
mystop <- !last.arma$continue
coeff[i,] <- last.arma[[1]][,1]
pval [i,] <- last.arma[[1]][,4]
i <- i+1
}
list(coeff, pval, mylist, aic=aic)
}
arimaSelectplot <- function(arimaSelect.out,noms,choix){
noms <- names(arimaSelect.out[[3]][[1]]$coef)
coeff <- arimaSelect.out[[1]]
k <- min(which(is.na(coeff[,1])))-1
coeff <- coeff[1:k,]
pval <- arimaSelect.out[[2]][1:k,]
aic <- arimaSelect.out$aic[1:k]
coeff[coeff==0] <- NA
n <- ncol(coeff)
if(missing(choix)) choix <- k
layout(matrix(c(1,1,1,2,
3,3,3,2,
3,3,3,4,
5,6,7,7),nr=4),
widths=c(10,35,45,15),
heights=c(30,30,15,15))
couleurs <- rainbow(75)[1:50]#(50)
ticks <- pretty(coeff)
par(mar=c(1,1,3,1))
plot(aic,k:1-.5,type='o',pch=21,bg='blue',cex=2,axes=F,lty=2,xpd=NA)
points(aic[choix],k-choix+.5,pch=21,cex=4,bg=2,xpd=NA)
title('aic',line=2)
par(mar=c(3,0,0,0))
plot(0,axes=F,xlab='',ylab='',xlim=range(ticks),ylim=c(.1,1))
rect(xleft = min(ticks) + (0:49)/50*(max(ticks)-min(ticks)),
xright = min(ticks) + (1:50)/50*(max(ticks)-min(ticks)),
ytop = rep(1,50),
ybottom= rep(0,50),col=couleurs,border=NA)
axis(1,ticks)
rect(xleft=min(ticks),xright=max(ticks),ytop=1,ybottom=0)
text(mean(coeff,na.rm=T),.5,'coefficients',cex=2,font=2)
par(mar=c(1,1,3,1))
image(1:n,1:k,t(coeff[k:1,]),axes=F,col=couleurs,zlim=range(ticks))
for(i in 1:n) for(j in 1:k) if(!is.na(coeff[j,i])) {
if(pval[j,i]<.01) symb = 'green'
else if( (pval[j,i]<.05) & (pval[j,i]>=.01)) symb = 'orange'
else if( (pval[j,i]<.1) & (pval[j,i]>=.05)) symb = 'red'
else symb = 'black'
polygon(c(i+.5 ,i+.2 ,i+.5 ,i+.5),
c(k-j+0.5,k-j+0.5,k-j+0.8,k-j+0.5),
col=symb)
if(j==choix) {
rect(xleft=i-.5,
xright=i+.5,
ybottom=k-j+1.5,
ytop=k-j+.5,
lwd=4)
text(i,
k-j+1,
round(coeff[j,i],2),
cex=1.2,
font=2)
}
else{
rect(xleft=i-.5,xright=i+.5,ybottom=k-j+1.5,ytop=k-j+.5)
text(i,k-j+1,round(coeff[j,i],2),cex=1.2,font=1)
}
}
axis(3,1:n,noms)
par(mar=c(0.5,0,0,0.5))
plot(0,axes=F,xlab='',ylab='',type='n',xlim=c(0,8),ylim=c(-.2,.8))
cols <- c('green','orange','red','black')
niv <- c('0','0.01','0.05','0.1')
for(i in 0:3){
polygon(c(1+2*i ,1+2*i ,1+2*i-.5 ,1+2*i),
c(.4 ,.7 , .4 , .4),
col=cols[i+1])
text(2*i,0.5,niv[i+1],cex=1.5)
}
text(8,.5,1,cex=1.5)
text(4,0,'p-value',cex=2)
box()
residus <- arimaSelect.out[[3]][[choix]]$res
par(mar=c(1,2,4,1))
acf(residus,main='')
title('acf',line=.5)
par(mar=c(1,2,4,1))
pacf(residus,main='')
title('pacf',line=.5)
par(mar=c(2,2,4,1))
qqnorm(residus,main='')
title('qq-norm',line=.5)
qqline(residus)
residus
}
if (par2 == 0) x <- log(x)
if (par2 != 0) x <- x^par2
(selection <- arimaSelect(x, order=c(par6,par3,par7), seasonal=list(order=c(par8,par4,par9), period=par5)))
bitmap(file='test1.png')
resid <- arimaSelectplot(selection)
dev.off()
resid
bitmap(file='test2.png')
acf(resid,length(resid)/2, main='Residual Autocorrelation Function')
dev.off()
bitmap(file='test3.png')
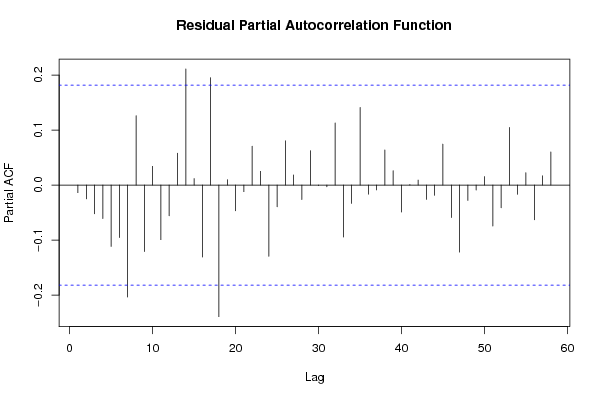
pacf(resid,length(resid)/2, main='Residual Partial Autocorrelation Function')
dev.off()
bitmap(file='test4.png')
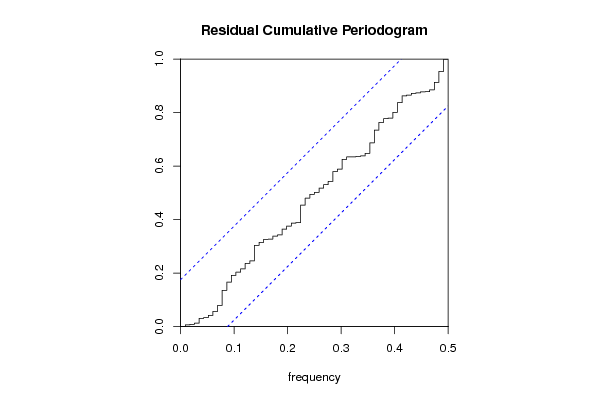
cpgram(resid, main='Residual Cumulative Periodogram')
dev.off()
bitmap(file='test5.png')
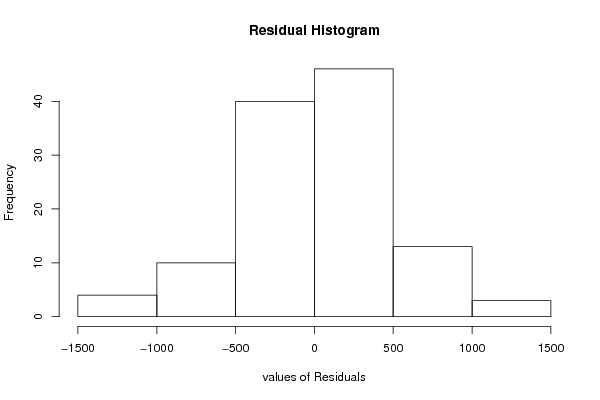
hist(resid, main='Residual Histogram', xlab='values of Residuals')
dev.off()
bitmap(file='test6.png')
densityplot(~resid,col='black',main='Residual Density Plot', xlab='values of Residuals')
dev.off()
bitmap(file='test7.png')
qqnorm(resid, main='Residual Normal Q-Q Plot')
qqline(resid)
dev.off()
ncols <- length(selection[[1]][1,])
nrows <- length(selection[[2]][,1])-1
load(file='createtable')
a<-table.start()
a<-table.row.start(a)
a<-table.element(a,'ARIMA Parameter Estimation and Backward Selection', ncols+1,TRUE)
a<-table.row.end(a)
a<-table.row.start(a)
a<-table.element(a,'Iteration', header=TRUE)
for (i in 1:ncols) {
a<-table.element(a,names(selection[[3]][[1]]$coef)[i],header=TRUE)
}
a<-table.row.end(a)
for (j in 1:nrows) {
a<-table.row.start(a)
mydum <- 'Estimates ('
mydum <- paste(mydum,j)
mydum <- paste(mydum,')')
a<-table.element(a,mydum, header=TRUE)
for (i in 1:ncols) {
a<-table.element(a,round(selection[[1]][j,i],4))
}
a<-table.row.end(a)
a<-table.row.start(a)
a<-table.element(a,'(p-val)', header=TRUE)
for (i in 1:ncols) {
mydum <- '('
mydum <- paste(mydum,round(selection[[2]][j,i],4),sep='')
mydum <- paste(mydum,')')
a<-table.element(a,mydum)
}
a<-table.row.end(a)
}
a<-table.end(a)
table.save(a,file='mytable.tab')
a<-table.start()
a<-table.row.start(a)
a<-table.element(a,'Estimated ARIMA Residuals', 1,TRUE)
a<-table.row.end(a)
a<-table.row.start(a)
a<-table.element(a,'Value', 1,TRUE)
a<-table.row.end(a)
for (i in (par4*par5+par3):length(resid)) {
a<-table.row.start(a)
a<-table.element(a,resid[i])
a<-table.row.end(a)
}
a<-table.end(a)
table.save(a,file='mytable1.tab')