Free Statistics

of Irreproducible Research!

Author's title

Author*The author of this computation has been verified*
R Software Modulerwasp_exponentialsmoothing.wasp
Title produced by softwareExponential Smoothing
Date of computationFri, 23 Dec 2016 14:10:10 +0100
Cite this page as followsStatistical Computations at FreeStatistics.org, Office for Research Development and Education, URL https://freestatistics.org/blog/index.php?v=date/2016/Dec/23/t1482498631ggg37igm6kuwucd.htm/, Retrieved Tue, 07 May 2024 15:37:41 +0000
Statistical Computations at FreeStatistics.org, Office for Research Development and Education, URL https://freestatistics.org/blog/index.php?pk=302928, Retrieved Tue, 07 May 2024 15:37:41 +0000
QR Codes:

Original text written by user:
IsPrivate?No (this computation is public)
User-defined keywords
Estimated Impact57
Family? (F = Feedback message, R = changed R code, M = changed R Module, P = changed Parameters, D = changed Data)
-       [Exponential Smoothing] [niet flippen stom...] [2016-12-23 13:10:10] [d92250bd36540c2281a4ec15b45df1dd] [Current]
Feedback Forum

Post a new message
Dataseries X:
4511.15
4497.61
4497.61
4524.68
4569.79
4596.85
4614.9
4632.94
4660.02
4714.15
4772.79
4817.9
4872.04
4926.17
4971.28
5020.9
5066.02
5088.57
5084.06
5066.02


Summary of computational transaction
Raw Input view raw input (R code)
Raw Outputview raw output of R engine
Computing time1 seconds
R ServerBig Analytics Cloud Computing Center

\begin{tabular}{lllllllll}
\hline
Summary of computational transaction \tabularnewline
Raw Input view raw input (R code)  \tabularnewline
Raw Outputview raw output of R engine  \tabularnewline
Computing time1 seconds \tabularnewline
R ServerBig Analytics Cloud Computing Center \tabularnewline
\hline
\end{tabular}
%Source: https://freestatistics.org/blog/index.php?pk=302928&T=0

[TABLE]
[ROW]
Summary of computational transaction[/C][/ROW] [ROW]Raw Input[/C] view raw input (R code) [/C][/ROW] [ROW]Raw Output[/C]view raw output of R engine [/C][/ROW] [ROW]Computing time[/C]1 seconds[/C][/ROW] [ROW]R Server[/C]Big Analytics Cloud Computing Center[/C][/ROW] [/TABLE] Source: https://freestatistics.org/blog/index.php?pk=302928&T=0

Globally Unique Identifier (entire table): ba.freestatistics.org/blog/index.php?pk=302928&T=0

As an alternative you can also use a QR Code:  

The GUIDs for individual cells are displayed in the table below:

Summary of computational transaction
Raw Input view raw input (R code)
Raw Outputview raw output of R engine
Computing time1 seconds
R ServerBig Analytics Cloud Computing Center


Estimated Parameters of Exponential Smoothing
ParameterValue
alpha1
beta0.467657063306984
gamma0.023757986713303

\begin{tabular}{lllllllll}
\hline
Estimated Parameters of Exponential Smoothing \tabularnewline
Parameter & Value \tabularnewline
alpha & 1 \tabularnewline
beta & 0.467657063306984 \tabularnewline
gamma & 0.023757986713303 \tabularnewline
\hline
\end{tabular}
%Source: https://freestatistics.org/blog/index.php?pk=302928&T=1

[TABLE]
[ROW][C]Estimated Parameters of Exponential Smoothing[/C][/ROW]
[ROW][C]Parameter[/C][C]Value[/C][/ROW]
[ROW][C]alpha[/C][C]1[/C][/ROW]
[ROW][C]beta[/C][C]0.467657063306984[/C][/ROW]
[ROW][C]gamma[/C][C]0.023757986713303[/C][/ROW]
[/TABLE]
Source: https://freestatistics.org/blog/index.php?pk=302928&T=1

Globally Unique Identifier (entire table): ba.freestatistics.org/blog/index.php?pk=302928&T=1

As an alternative you can also use a QR Code:  

The GUIDs for individual cells are displayed in the table below:

Estimated Parameters of Exponential Smoothing
ParameterValue
alpha1
beta0.467657063306984
gamma0.023757986713303


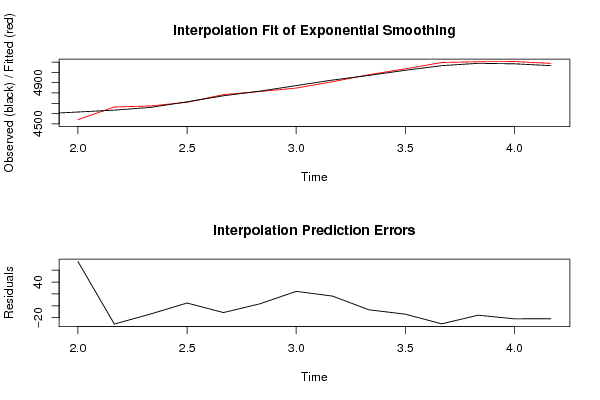
Interpolation Forecasts of Exponential Smoothing
tObservedFittedResiduals
74614.94540.3127976190574.5872023809497
84632.944663.69694631147-30.7569463114723
94660.024673.76157645649-13.7415764564921
104714.154709.434397832314.71560216769376
114772.794784.19468249377-11.4046824937741
124817.94814.562868837453.33713116254512
134872.044847.7118351301324.3281648698667
144926.174909.8365732688216.3334267311766
154971.284978.013348981-6.73334898100074
165020.95034.99361743699-14.093617436989
175066.025096.44763769504-30.4276376950347
185088.575104.39960467387-15.8296046738751
195084.065106.02511157211-21.9651115721108
205066.025087.85047199909-21.8304719990883

\begin{tabular}{lllllllll}
\hline
Interpolation Forecasts of Exponential Smoothing \tabularnewline
t & Observed & Fitted & Residuals \tabularnewline
7 & 4614.9 & 4540.31279761905 & 74.5872023809497 \tabularnewline
8 & 4632.94 & 4663.69694631147 & -30.7569463114723 \tabularnewline
9 & 4660.02 & 4673.76157645649 & -13.7415764564921 \tabularnewline
10 & 4714.15 & 4709.43439783231 & 4.71560216769376 \tabularnewline
11 & 4772.79 & 4784.19468249377 & -11.4046824937741 \tabularnewline
12 & 4817.9 & 4814.56286883745 & 3.33713116254512 \tabularnewline
13 & 4872.04 & 4847.71183513013 & 24.3281648698667 \tabularnewline
14 & 4926.17 & 4909.83657326882 & 16.3334267311766 \tabularnewline
15 & 4971.28 & 4978.013348981 & -6.73334898100074 \tabularnewline
16 & 5020.9 & 5034.99361743699 & -14.093617436989 \tabularnewline
17 & 5066.02 & 5096.44763769504 & -30.4276376950347 \tabularnewline
18 & 5088.57 & 5104.39960467387 & -15.8296046738751 \tabularnewline
19 & 5084.06 & 5106.02511157211 & -21.9651115721108 \tabularnewline
20 & 5066.02 & 5087.85047199909 & -21.8304719990883 \tabularnewline
\hline
\end{tabular}
%Source: https://freestatistics.org/blog/index.php?pk=302928&T=2

[TABLE]
[ROW][C]Interpolation Forecasts of Exponential Smoothing[/C][/ROW]
[ROW][C]t[/C][C]Observed[/C][C]Fitted[/C][C]Residuals[/C][/ROW]
[ROW][C]7[/C][C]4614.9[/C][C]4540.31279761905[/C][C]74.5872023809497[/C][/ROW]
[ROW][C]8[/C][C]4632.94[/C][C]4663.69694631147[/C][C]-30.7569463114723[/C][/ROW]
[ROW][C]9[/C][C]4660.02[/C][C]4673.76157645649[/C][C]-13.7415764564921[/C][/ROW]
[ROW][C]10[/C][C]4714.15[/C][C]4709.43439783231[/C][C]4.71560216769376[/C][/ROW]
[ROW][C]11[/C][C]4772.79[/C][C]4784.19468249377[/C][C]-11.4046824937741[/C][/ROW]
[ROW][C]12[/C][C]4817.9[/C][C]4814.56286883745[/C][C]3.33713116254512[/C][/ROW]
[ROW][C]13[/C][C]4872.04[/C][C]4847.71183513013[/C][C]24.3281648698667[/C][/ROW]
[ROW][C]14[/C][C]4926.17[/C][C]4909.83657326882[/C][C]16.3334267311766[/C][/ROW]
[ROW][C]15[/C][C]4971.28[/C][C]4978.013348981[/C][C]-6.73334898100074[/C][/ROW]
[ROW][C]16[/C][C]5020.9[/C][C]5034.99361743699[/C][C]-14.093617436989[/C][/ROW]
[ROW][C]17[/C][C]5066.02[/C][C]5096.44763769504[/C][C]-30.4276376950347[/C][/ROW]
[ROW][C]18[/C][C]5088.57[/C][C]5104.39960467387[/C][C]-15.8296046738751[/C][/ROW]
[ROW][C]19[/C][C]5084.06[/C][C]5106.02511157211[/C][C]-21.9651115721108[/C][/ROW]
[ROW][C]20[/C][C]5066.02[/C][C]5087.85047199909[/C][C]-21.8304719990883[/C][/ROW]
[/TABLE]
Source: https://freestatistics.org/blog/index.php?pk=302928&T=2

Globally Unique Identifier (entire table): ba.freestatistics.org/blog/index.php?pk=302928&T=2

As an alternative you can also use a QR Code:  

The GUIDs for individual cells are displayed in the table below:

Interpolation Forecasts of Exponential Smoothing
tObservedFittedResiduals
74614.94540.3127976190574.5872023809497
84632.944663.69694631147-30.7569463114723
94660.024673.76157645649-13.7415764564921
104714.154709.434397832314.71560216769376
114772.794784.19468249377-11.4046824937741
124817.94814.562868837453.33713116254512
134872.044847.7118351301324.3281648698667
144926.174909.8365732688216.3334267311766
154971.284978.013348981-6.73334898100074
165020.95034.99361743699-14.093617436989
175066.025096.44763769504-30.4276376950347
185088.575104.39960467387-15.8296046738751
195084.065106.02511157211-21.9651115721108
205066.025087.85047199909-21.8304719990883


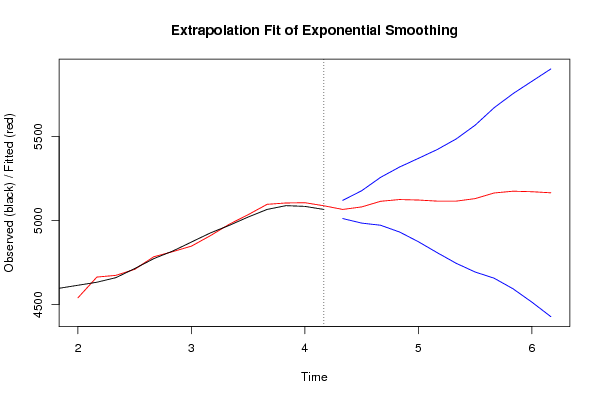
Extrapolation Forecasts of Exponential Smoothing
tForecast95% Lower Bound95% Upper Bound
215066.009630906725011.746509529255120.27275228419
225081.018428480114984.649550049375177.38730691085
235114.45222605354971.920265017675256.98418708934
245124.947690293564931.76999837915318.12538220802
255121.921487866954873.764925004655370.07805072925
265115.502785440344808.264321404625422.74124947605
275115.492416347064745.293902466765485.69093022736
285130.501213920454693.667133139535567.33529470137
295163.935011493844656.968904251735670.90111873594
305174.43047573394593.993798987595754.8671524802
315171.404273307284514.298302901035828.51024371354
325164.985570880674428.136106921055901.8350348403

\begin{tabular}{lllllllll}
\hline
Extrapolation Forecasts of Exponential Smoothing \tabularnewline
t & Forecast & 95% Lower Bound & 95% Upper Bound \tabularnewline
21 & 5066.00963090672 & 5011.74650952925 & 5120.27275228419 \tabularnewline
22 & 5081.01842848011 & 4984.64955004937 & 5177.38730691085 \tabularnewline
23 & 5114.4522260535 & 4971.92026501767 & 5256.98418708934 \tabularnewline
24 & 5124.94769029356 & 4931.7699983791 & 5318.12538220802 \tabularnewline
25 & 5121.92148786695 & 4873.76492500465 & 5370.07805072925 \tabularnewline
26 & 5115.50278544034 & 4808.26432140462 & 5422.74124947605 \tabularnewline
27 & 5115.49241634706 & 4745.29390246676 & 5485.69093022736 \tabularnewline
28 & 5130.50121392045 & 4693.66713313953 & 5567.33529470137 \tabularnewline
29 & 5163.93501149384 & 4656.96890425173 & 5670.90111873594 \tabularnewline
30 & 5174.4304757339 & 4593.99379898759 & 5754.8671524802 \tabularnewline
31 & 5171.40427330728 & 4514.29830290103 & 5828.51024371354 \tabularnewline
32 & 5164.98557088067 & 4428.13610692105 & 5901.8350348403 \tabularnewline
\hline
\end{tabular}
%Source: https://freestatistics.org/blog/index.php?pk=302928&T=3

[TABLE]
[ROW][C]Extrapolation Forecasts of Exponential Smoothing[/C][/ROW]
[ROW][C]t[/C][C]Forecast[/C][C]95% Lower Bound[/C][C]95% Upper Bound[/C][/ROW]
[ROW][C]21[/C][C]5066.00963090672[/C][C]5011.74650952925[/C][C]5120.27275228419[/C][/ROW]
[ROW][C]22[/C][C]5081.01842848011[/C][C]4984.64955004937[/C][C]5177.38730691085[/C][/ROW]
[ROW][C]23[/C][C]5114.4522260535[/C][C]4971.92026501767[/C][C]5256.98418708934[/C][/ROW]
[ROW][C]24[/C][C]5124.94769029356[/C][C]4931.7699983791[/C][C]5318.12538220802[/C][/ROW]
[ROW][C]25[/C][C]5121.92148786695[/C][C]4873.76492500465[/C][C]5370.07805072925[/C][/ROW]
[ROW][C]26[/C][C]5115.50278544034[/C][C]4808.26432140462[/C][C]5422.74124947605[/C][/ROW]
[ROW][C]27[/C][C]5115.49241634706[/C][C]4745.29390246676[/C][C]5485.69093022736[/C][/ROW]
[ROW][C]28[/C][C]5130.50121392045[/C][C]4693.66713313953[/C][C]5567.33529470137[/C][/ROW]
[ROW][C]29[/C][C]5163.93501149384[/C][C]4656.96890425173[/C][C]5670.90111873594[/C][/ROW]
[ROW][C]30[/C][C]5174.4304757339[/C][C]4593.99379898759[/C][C]5754.8671524802[/C][/ROW]
[ROW][C]31[/C][C]5171.40427330728[/C][C]4514.29830290103[/C][C]5828.51024371354[/C][/ROW]
[ROW][C]32[/C][C]5164.98557088067[/C][C]4428.13610692105[/C][C]5901.8350348403[/C][/ROW]
[/TABLE]
Source: https://freestatistics.org/blog/index.php?pk=302928&T=3

Globally Unique Identifier (entire table): ba.freestatistics.org/blog/index.php?pk=302928&T=3

As an alternative you can also use a QR Code:  

The GUIDs for individual cells are displayed in the table below:

Extrapolation Forecasts of Exponential Smoothing
tForecast95% Lower Bound95% Upper Bound
215066.009630906725011.746509529255120.27275228419
225081.018428480114984.649550049375177.38730691085
235114.45222605354971.920265017675256.98418708934
245124.947690293564931.76999837915318.12538220802
255121.921487866954873.764925004655370.07805072925
265115.502785440344808.264321404625422.74124947605
275115.492416347064745.293902466765485.69093022736
285130.501213920454693.667133139535567.33529470137
295163.935011493844656.968904251735670.90111873594
305174.43047573394593.993798987595754.8671524802
315171.404273307284514.298302901035828.51024371354
325164.985570880674428.136106921055901.8350348403


Parameters (Session):
par1 = FALSE ; par2 = 1 ; par3 = 2 ; par4 = 1 ; par5 = 6 ; par6 = 2 ; par7 = 1 ; par8 = 2 ; par9 = 1 ;
Parameters (R input):
par1 = 6 ; par2 = Triple ; par3 = additive ; par4 = 12 ;
R code (references can be found in the software module):
par1 <- as.numeric(par1)
par4 <- as.numeric(par4)
if (par2 == 'Single') K <- 1
if (par2 == 'Double') K <- 2
if (par2 == 'Triple') K <- par1
nx <- length(x)
nxmK <- nx - K
x <- ts(x, frequency = par1)
if (par2 == 'Single') fit <- HoltWinters(x, gamma=F, beta=F)
if (par2 == 'Double') fit <- HoltWinters(x, gamma=F)
if (par2 == 'Triple') fit <- HoltWinters(x, seasonal=par3)
fit
myresid <- x - fit$fitted[,'xhat']
bitmap(file='test1.png')
op <- par(mfrow=c(2,1))
plot(fit,ylab='Observed (black) / Fitted (red)',main='Interpolation Fit of Exponential Smoothing')
plot(myresid,ylab='Residuals',main='Interpolation Prediction Errors')
par(op)
dev.off()
bitmap(file='test2.png')
p <- predict(fit, par4, prediction.interval=TRUE)
np <- length(p[,1])
plot(fit,p,ylab='Observed (black) / Fitted (red)',main='Extrapolation Fit of Exponential Smoothing')
dev.off()
bitmap(file='test3.png')
op <- par(mfrow = c(2,2))
acf(as.numeric(myresid),lag.max = nx/2,main='Residual ACF')
spectrum(myresid,main='Residals Periodogram')
cpgram(myresid,main='Residal Cumulative Periodogram')
qqnorm(myresid,main='Residual Normal QQ Plot')
qqline(myresid)
par(op)
dev.off()
load(file='createtable')
a<-table.start()
a<-table.row.start(a)
a<-table.element(a,'Estimated Parameters of Exponential Smoothing',2,TRUE)
a<-table.row.end(a)
a<-table.row.start(a)
a<-table.element(a,'Parameter',header=TRUE)
a<-table.element(a,'Value',header=TRUE)
a<-table.row.end(a)
a<-table.row.start(a)
a<-table.element(a,'alpha',header=TRUE)
a<-table.element(a,fit$alpha)
a<-table.row.end(a)
a<-table.row.start(a)
a<-table.element(a,'beta',header=TRUE)
a<-table.element(a,fit$beta)
a<-table.row.end(a)
a<-table.row.start(a)
a<-table.element(a,'gamma',header=TRUE)
a<-table.element(a,fit$gamma)
a<-table.row.end(a)
a<-table.end(a)
table.save(a,file='mytable.tab')
a<-table.start()
a<-table.row.start(a)
a<-table.element(a,'Interpolation Forecasts of Exponential Smoothing',4,TRUE)
a<-table.row.end(a)
a<-table.row.start(a)
a<-table.element(a,'t',header=TRUE)
a<-table.element(a,'Observed',header=TRUE)
a<-table.element(a,'Fitted',header=TRUE)
a<-table.element(a,'Residuals',header=TRUE)
a<-table.row.end(a)
for (i in 1:nxmK) {
a<-table.row.start(a)
a<-table.element(a,i+K,header=TRUE)
a<-table.element(a,x[i+K])
a<-table.element(a,fit$fitted[i,'xhat'])
a<-table.element(a,myresid[i])
a<-table.row.end(a)
}
a<-table.end(a)
table.save(a,file='mytable1.tab')
a<-table.start()
a<-table.row.start(a)
a<-table.element(a,'Extrapolation Forecasts of Exponential Smoothing',4,TRUE)
a<-table.row.end(a)
a<-table.row.start(a)
a<-table.element(a,'t',header=TRUE)
a<-table.element(a,'Forecast',header=TRUE)
a<-table.element(a,'95% Lower Bound',header=TRUE)
a<-table.element(a,'95% Upper Bound',header=TRUE)
a<-table.row.end(a)
for (i in 1:np) {
a<-table.row.start(a)
a<-table.element(a,nx+i,header=TRUE)
a<-table.element(a,p[i,'fit'])
a<-table.element(a,p[i,'lwr'])
a<-table.element(a,p[i,'upr'])
a<-table.row.end(a)
}
a<-table.end(a)
table.save(a,file='mytable2.tab')