Free Statistics

of Irreproducible Research!

Author's title

Author*The author of this computation has been verified*
R Software Modulerwasp_autocorrelation.wasp
Title produced by software(Partial) Autocorrelation Function
Date of computationFri, 23 Dec 2016 14:45:42 +0100
Cite this page as followsStatistical Computations at FreeStatistics.org, Office for Research Development and Education, URL https://freestatistics.org/blog/index.php?v=date/2016/Dec/23/t1482501089h6hg3tyob0cs9hm.htm/, Retrieved Tue, 07 May 2024 12:37:36 +0000
Statistical Computations at FreeStatistics.org, Office for Research Development and Education, URL https://freestatistics.org/blog/index.php?pk=302947, Retrieved Tue, 07 May 2024 12:37:36 +0000
QR Codes:

Original text written by user:
IsPrivate?No (this computation is public)
User-defined keywords
Estimated Impact75
Family? (F = Feedback message, R = changed R code, M = changed R Module, P = changed Parameters, D = changed Data)
-       [(Partial) Autocorrelation Function] [] [2016-12-23 13:45:42] [c4ef4c70482680cab119953cba46aca4] [Current]
Feedback Forum

Post a new message
Dataseries X:
4998
4480
4824
4814
4602
4499
4594
4600
4507
4606
4503
4801
4564
4142
4818
4408
4496
4587
4656
4799
4652
4638
4650
5185
5208
4477
4976
4670
4842
4713
4804
4996
4574
4841
4688
4766
4994
4514
4766
4642
4806
4645
4784
4979
4530
4942
4651
5150
4987
4532
5046
4783
4958
4815
5055
5152
4773
5147
4866
5311
5172
4734
5011
4957
4968
5049
5305
5067
5001
5252
4903
5408
5395
5150
5460
4968
5021
5118
5175
5420
5121
5450
5286
5693
5353
5017
5577
4987
5129
5249
5100
5382
5039
5364
5193
5846
5259
4809
5297
5034
5243
5150
5296
5596
4954
5250
5009
5113
5237
4575
5026
4842
5019
5063
5261
5327
5054
5269
5019
5315
5274
4899
5216
5029
5110
5093


Summary of computational transaction
Raw Input view raw input (R code)
Raw Outputview raw output of R engine
Computing time1 seconds
R ServerBig Analytics Cloud Computing Center

\begin{tabular}{lllllllll}
\hline
Summary of computational transaction \tabularnewline
Raw Input view raw input (R code)  \tabularnewline
Raw Outputview raw output of R engine  \tabularnewline
Computing time1 seconds \tabularnewline
R ServerBig Analytics Cloud Computing Center \tabularnewline
\hline
\end{tabular}
%Source: https://freestatistics.org/blog/index.php?pk=302947&T=0

[TABLE]
[ROW]
Summary of computational transaction[/C][/ROW] [ROW]Raw Input[/C] view raw input (R code) [/C][/ROW] [ROW]Raw Output[/C]view raw output of R engine [/C][/ROW] [ROW]Computing time[/C]1 seconds[/C][/ROW] [ROW]R Server[/C]Big Analytics Cloud Computing Center[/C][/ROW] [/TABLE] Source: https://freestatistics.org/blog/index.php?pk=302947&T=0

Globally Unique Identifier (entire table): ba.freestatistics.org/blog/index.php?pk=302947&T=0

As an alternative you can also use a QR Code:  

The GUIDs for individual cells are displayed in the table below:

Summary of computational transaction
Raw Input view raw input (R code)
Raw Outputview raw output of R engine
Computing time1 seconds
R ServerBig Analytics Cloud Computing Center


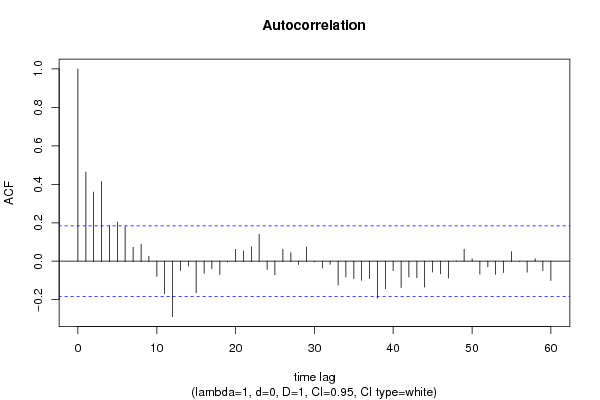
Autocorrelation Function
Time lag kACF(k)T-STATP-value
10.4644994.95951e-06
20.3595683.83910.000102
30.4138554.41881.1e-05
40.1850841.97620.025276
50.204422.18260.015558
60.180541.92760.028194
70.0725570.77470.220061
80.0879060.93860.174967
90.0252230.26930.394091
10-0.078841-0.84180.200833
11-0.168486-1.79890.037338
12-0.288332-3.07850.001303
13-0.048682-0.51980.302113
14-0.024355-0.260.397652
15-0.164473-1.75610.040879
16-0.062731-0.66980.252175
17-0.038913-0.41550.339286
18-0.069116-0.7380.231029
19-0.003417-0.03650.485481
200.0617920.65980.255371
210.0530780.56670.286011
220.0756680.80790.210412
230.140331.49830.068408
24-0.042432-0.4530.325687
25-0.069942-0.74680.228368
260.062550.66780.25279
270.0446330.47650.317298
28-0.017199-0.18360.427313
290.0743170.79350.214571
30-0.002582-0.02760.489028
31-0.034976-0.37340.354757
32-0.01546-0.16510.434592
33-0.123421-1.31780.09511
34-0.081363-0.86870.193413
35-0.089813-0.95890.169808
36-0.099117-1.05830.146082
37-0.090435-0.96560.16815
38-0.193026-2.0610.020791
39-0.142918-1.52590.064896
40-0.048808-0.52110.301646
41-0.136766-1.46030.073484
42-0.082038-0.87590.191455
43-0.086226-0.92060.179592
44-0.134029-1.4310.077577
45-0.056182-0.59990.274894
46-0.065635-0.70080.24243
47-0.086958-0.92850.177566
480.0005590.0060.497626
490.0625850.66820.25267
500.012150.12970.448508
51-0.066702-0.71220.238903
52-0.02872-0.30660.379837
53-0.068223-0.72840.233925
54-0.058998-0.62990.265001
550.0495730.52930.298816
56-0.001715-0.01830.492713
57-0.056737-0.60580.272931
580.0130710.13960.444628
59-0.048509-0.51790.302754
60-0.100444-1.07250.142891

\begin{tabular}{lllllllll}
\hline
Autocorrelation Function \tabularnewline
Time lag k & ACF(k) & T-STAT & P-value \tabularnewline
1 & 0.464499 & 4.9595 & 1e-06 \tabularnewline
2 & 0.359568 & 3.8391 & 0.000102 \tabularnewline
3 & 0.413855 & 4.4188 & 1.1e-05 \tabularnewline
4 & 0.185084 & 1.9762 & 0.025276 \tabularnewline
5 & 0.20442 & 2.1826 & 0.015558 \tabularnewline
6 & 0.18054 & 1.9276 & 0.028194 \tabularnewline
7 & 0.072557 & 0.7747 & 0.220061 \tabularnewline
8 & 0.087906 & 0.9386 & 0.174967 \tabularnewline
9 & 0.025223 & 0.2693 & 0.394091 \tabularnewline
10 & -0.078841 & -0.8418 & 0.200833 \tabularnewline
11 & -0.168486 & -1.7989 & 0.037338 \tabularnewline
12 & -0.288332 & -3.0785 & 0.001303 \tabularnewline
13 & -0.048682 & -0.5198 & 0.302113 \tabularnewline
14 & -0.024355 & -0.26 & 0.397652 \tabularnewline
15 & -0.164473 & -1.7561 & 0.040879 \tabularnewline
16 & -0.062731 & -0.6698 & 0.252175 \tabularnewline
17 & -0.038913 & -0.4155 & 0.339286 \tabularnewline
18 & -0.069116 & -0.738 & 0.231029 \tabularnewline
19 & -0.003417 & -0.0365 & 0.485481 \tabularnewline
20 & 0.061792 & 0.6598 & 0.255371 \tabularnewline
21 & 0.053078 & 0.5667 & 0.286011 \tabularnewline
22 & 0.075668 & 0.8079 & 0.210412 \tabularnewline
23 & 0.14033 & 1.4983 & 0.068408 \tabularnewline
24 & -0.042432 & -0.453 & 0.325687 \tabularnewline
25 & -0.069942 & -0.7468 & 0.228368 \tabularnewline
26 & 0.06255 & 0.6678 & 0.25279 \tabularnewline
27 & 0.044633 & 0.4765 & 0.317298 \tabularnewline
28 & -0.017199 & -0.1836 & 0.427313 \tabularnewline
29 & 0.074317 & 0.7935 & 0.214571 \tabularnewline
30 & -0.002582 & -0.0276 & 0.489028 \tabularnewline
31 & -0.034976 & -0.3734 & 0.354757 \tabularnewline
32 & -0.01546 & -0.1651 & 0.434592 \tabularnewline
33 & -0.123421 & -1.3178 & 0.09511 \tabularnewline
34 & -0.081363 & -0.8687 & 0.193413 \tabularnewline
35 & -0.089813 & -0.9589 & 0.169808 \tabularnewline
36 & -0.099117 & -1.0583 & 0.146082 \tabularnewline
37 & -0.090435 & -0.9656 & 0.16815 \tabularnewline
38 & -0.193026 & -2.061 & 0.020791 \tabularnewline
39 & -0.142918 & -1.5259 & 0.064896 \tabularnewline
40 & -0.048808 & -0.5211 & 0.301646 \tabularnewline
41 & -0.136766 & -1.4603 & 0.073484 \tabularnewline
42 & -0.082038 & -0.8759 & 0.191455 \tabularnewline
43 & -0.086226 & -0.9206 & 0.179592 \tabularnewline
44 & -0.134029 & -1.431 & 0.077577 \tabularnewline
45 & -0.056182 & -0.5999 & 0.274894 \tabularnewline
46 & -0.065635 & -0.7008 & 0.24243 \tabularnewline
47 & -0.086958 & -0.9285 & 0.177566 \tabularnewline
48 & 0.000559 & 0.006 & 0.497626 \tabularnewline
49 & 0.062585 & 0.6682 & 0.25267 \tabularnewline
50 & 0.01215 & 0.1297 & 0.448508 \tabularnewline
51 & -0.066702 & -0.7122 & 0.238903 \tabularnewline
52 & -0.02872 & -0.3066 & 0.379837 \tabularnewline
53 & -0.068223 & -0.7284 & 0.233925 \tabularnewline
54 & -0.058998 & -0.6299 & 0.265001 \tabularnewline
55 & 0.049573 & 0.5293 & 0.298816 \tabularnewline
56 & -0.001715 & -0.0183 & 0.492713 \tabularnewline
57 & -0.056737 & -0.6058 & 0.272931 \tabularnewline
58 & 0.013071 & 0.1396 & 0.444628 \tabularnewline
59 & -0.048509 & -0.5179 & 0.302754 \tabularnewline
60 & -0.100444 & -1.0725 & 0.142891 \tabularnewline
\hline
\end{tabular}
%Source: https://freestatistics.org/blog/index.php?pk=302947&T=1

[TABLE]
[ROW][C]Autocorrelation Function[/C][/ROW]
[ROW][C]Time lag k[/C][C]ACF(k)[/C][C]T-STAT[/C][C]P-value[/C][/ROW]
[ROW][C]1[/C][C]0.464499[/C][C]4.9595[/C][C]1e-06[/C][/ROW]
[ROW][C]2[/C][C]0.359568[/C][C]3.8391[/C][C]0.000102[/C][/ROW]
[ROW][C]3[/C][C]0.413855[/C][C]4.4188[/C][C]1.1e-05[/C][/ROW]
[ROW][C]4[/C][C]0.185084[/C][C]1.9762[/C][C]0.025276[/C][/ROW]
[ROW][C]5[/C][C]0.20442[/C][C]2.1826[/C][C]0.015558[/C][/ROW]
[ROW][C]6[/C][C]0.18054[/C][C]1.9276[/C][C]0.028194[/C][/ROW]
[ROW][C]7[/C][C]0.072557[/C][C]0.7747[/C][C]0.220061[/C][/ROW]
[ROW][C]8[/C][C]0.087906[/C][C]0.9386[/C][C]0.174967[/C][/ROW]
[ROW][C]9[/C][C]0.025223[/C][C]0.2693[/C][C]0.394091[/C][/ROW]
[ROW][C]10[/C][C]-0.078841[/C][C]-0.8418[/C][C]0.200833[/C][/ROW]
[ROW][C]11[/C][C]-0.168486[/C][C]-1.7989[/C][C]0.037338[/C][/ROW]
[ROW][C]12[/C][C]-0.288332[/C][C]-3.0785[/C][C]0.001303[/C][/ROW]
[ROW][C]13[/C][C]-0.048682[/C][C]-0.5198[/C][C]0.302113[/C][/ROW]
[ROW][C]14[/C][C]-0.024355[/C][C]-0.26[/C][C]0.397652[/C][/ROW]
[ROW][C]15[/C][C]-0.164473[/C][C]-1.7561[/C][C]0.040879[/C][/ROW]
[ROW][C]16[/C][C]-0.062731[/C][C]-0.6698[/C][C]0.252175[/C][/ROW]
[ROW][C]17[/C][C]-0.038913[/C][C]-0.4155[/C][C]0.339286[/C][/ROW]
[ROW][C]18[/C][C]-0.069116[/C][C]-0.738[/C][C]0.231029[/C][/ROW]
[ROW][C]19[/C][C]-0.003417[/C][C]-0.0365[/C][C]0.485481[/C][/ROW]
[ROW][C]20[/C][C]0.061792[/C][C]0.6598[/C][C]0.255371[/C][/ROW]
[ROW][C]21[/C][C]0.053078[/C][C]0.5667[/C][C]0.286011[/C][/ROW]
[ROW][C]22[/C][C]0.075668[/C][C]0.8079[/C][C]0.210412[/C][/ROW]
[ROW][C]23[/C][C]0.14033[/C][C]1.4983[/C][C]0.068408[/C][/ROW]
[ROW][C]24[/C][C]-0.042432[/C][C]-0.453[/C][C]0.325687[/C][/ROW]
[ROW][C]25[/C][C]-0.069942[/C][C]-0.7468[/C][C]0.228368[/C][/ROW]
[ROW][C]26[/C][C]0.06255[/C][C]0.6678[/C][C]0.25279[/C][/ROW]
[ROW][C]27[/C][C]0.044633[/C][C]0.4765[/C][C]0.317298[/C][/ROW]
[ROW][C]28[/C][C]-0.017199[/C][C]-0.1836[/C][C]0.427313[/C][/ROW]
[ROW][C]29[/C][C]0.074317[/C][C]0.7935[/C][C]0.214571[/C][/ROW]
[ROW][C]30[/C][C]-0.002582[/C][C]-0.0276[/C][C]0.489028[/C][/ROW]
[ROW][C]31[/C][C]-0.034976[/C][C]-0.3734[/C][C]0.354757[/C][/ROW]
[ROW][C]32[/C][C]-0.01546[/C][C]-0.1651[/C][C]0.434592[/C][/ROW]
[ROW][C]33[/C][C]-0.123421[/C][C]-1.3178[/C][C]0.09511[/C][/ROW]
[ROW][C]34[/C][C]-0.081363[/C][C]-0.8687[/C][C]0.193413[/C][/ROW]
[ROW][C]35[/C][C]-0.089813[/C][C]-0.9589[/C][C]0.169808[/C][/ROW]
[ROW][C]36[/C][C]-0.099117[/C][C]-1.0583[/C][C]0.146082[/C][/ROW]
[ROW][C]37[/C][C]-0.090435[/C][C]-0.9656[/C][C]0.16815[/C][/ROW]
[ROW][C]38[/C][C]-0.193026[/C][C]-2.061[/C][C]0.020791[/C][/ROW]
[ROW][C]39[/C][C]-0.142918[/C][C]-1.5259[/C][C]0.064896[/C][/ROW]
[ROW][C]40[/C][C]-0.048808[/C][C]-0.5211[/C][C]0.301646[/C][/ROW]
[ROW][C]41[/C][C]-0.136766[/C][C]-1.4603[/C][C]0.073484[/C][/ROW]
[ROW][C]42[/C][C]-0.082038[/C][C]-0.8759[/C][C]0.191455[/C][/ROW]
[ROW][C]43[/C][C]-0.086226[/C][C]-0.9206[/C][C]0.179592[/C][/ROW]
[ROW][C]44[/C][C]-0.134029[/C][C]-1.431[/C][C]0.077577[/C][/ROW]
[ROW][C]45[/C][C]-0.056182[/C][C]-0.5999[/C][C]0.274894[/C][/ROW]
[ROW][C]46[/C][C]-0.065635[/C][C]-0.7008[/C][C]0.24243[/C][/ROW]
[ROW][C]47[/C][C]-0.086958[/C][C]-0.9285[/C][C]0.177566[/C][/ROW]
[ROW][C]48[/C][C]0.000559[/C][C]0.006[/C][C]0.497626[/C][/ROW]
[ROW][C]49[/C][C]0.062585[/C][C]0.6682[/C][C]0.25267[/C][/ROW]
[ROW][C]50[/C][C]0.01215[/C][C]0.1297[/C][C]0.448508[/C][/ROW]
[ROW][C]51[/C][C]-0.066702[/C][C]-0.7122[/C][C]0.238903[/C][/ROW]
[ROW][C]52[/C][C]-0.02872[/C][C]-0.3066[/C][C]0.379837[/C][/ROW]
[ROW][C]53[/C][C]-0.068223[/C][C]-0.7284[/C][C]0.233925[/C][/ROW]
[ROW][C]54[/C][C]-0.058998[/C][C]-0.6299[/C][C]0.265001[/C][/ROW]
[ROW][C]55[/C][C]0.049573[/C][C]0.5293[/C][C]0.298816[/C][/ROW]
[ROW][C]56[/C][C]-0.001715[/C][C]-0.0183[/C][C]0.492713[/C][/ROW]
[ROW][C]57[/C][C]-0.056737[/C][C]-0.6058[/C][C]0.272931[/C][/ROW]
[ROW][C]58[/C][C]0.013071[/C][C]0.1396[/C][C]0.444628[/C][/ROW]
[ROW][C]59[/C][C]-0.048509[/C][C]-0.5179[/C][C]0.302754[/C][/ROW]
[ROW][C]60[/C][C]-0.100444[/C][C]-1.0725[/C][C]0.142891[/C][/ROW]
[/TABLE]
Source: https://freestatistics.org/blog/index.php?pk=302947&T=1

Globally Unique Identifier (entire table): ba.freestatistics.org/blog/index.php?pk=302947&T=1

As an alternative you can also use a QR Code:  

The GUIDs for individual cells are displayed in the table below:

Autocorrelation Function
Time lag kACF(k)T-STATP-value
10.4644994.95951e-06
20.3595683.83910.000102
30.4138554.41881.1e-05
40.1850841.97620.025276
50.204422.18260.015558
60.180541.92760.028194
70.0725570.77470.220061
80.0879060.93860.174967
90.0252230.26930.394091
10-0.078841-0.84180.200833
11-0.168486-1.79890.037338
12-0.288332-3.07850.001303
13-0.048682-0.51980.302113
14-0.024355-0.260.397652
15-0.164473-1.75610.040879
16-0.062731-0.66980.252175
17-0.038913-0.41550.339286
18-0.069116-0.7380.231029
19-0.003417-0.03650.485481
200.0617920.65980.255371
210.0530780.56670.286011
220.0756680.80790.210412
230.140331.49830.068408
24-0.042432-0.4530.325687
25-0.069942-0.74680.228368
260.062550.66780.25279
270.0446330.47650.317298
28-0.017199-0.18360.427313
290.0743170.79350.214571
30-0.002582-0.02760.489028
31-0.034976-0.37340.354757
32-0.01546-0.16510.434592
33-0.123421-1.31780.09511
34-0.081363-0.86870.193413
35-0.089813-0.95890.169808
36-0.099117-1.05830.146082
37-0.090435-0.96560.16815
38-0.193026-2.0610.020791
39-0.142918-1.52590.064896
40-0.048808-0.52110.301646
41-0.136766-1.46030.073484
42-0.082038-0.87590.191455
43-0.086226-0.92060.179592
44-0.134029-1.4310.077577
45-0.056182-0.59990.274894
46-0.065635-0.70080.24243
47-0.086958-0.92850.177566
480.0005590.0060.497626
490.0625850.66820.25267
500.012150.12970.448508
51-0.066702-0.71220.238903
52-0.02872-0.30660.379837
53-0.068223-0.72840.233925
54-0.058998-0.62990.265001
550.0495730.52930.298816
56-0.001715-0.01830.492713
57-0.056737-0.60580.272931
580.0130710.13960.444628
59-0.048509-0.51790.302754
60-0.100444-1.07250.142891


Partial Autocorrelation Function
Time lag kPACF(k)T-STATP-value
10.4644994.95951e-06
20.1833731.95790.026343
30.2537192.7090.003895
4-0.143604-1.53330.063989
50.076510.81690.207843
6-0.009748-0.10410.458645
7-0.028912-0.30870.379059
8-0.006301-0.06730.473239
9-0.053681-0.57320.283835
10-0.11216-1.19750.11679
11-0.184544-1.97040.025609
12-0.207089-2.21110.014512
130.3165953.38030.000496
140.131311.4020.081815
15-0.122484-1.30780.096791
16-0.089067-0.9510.171814
170.0971211.0370.150972
180.0677540.72340.235453
19-0.001702-0.01820.492768
200.1263371.34890.09002
210.0109410.11680.453604
22-0.149474-1.59590.056635
23-0.011407-0.12180.451638
24-0.196337-2.09630.019133
250.083230.88870.188029
260.1371221.46410.072965
270.0028620.03060.487839
28-0.141122-1.50680.067318
290.1282821.36970.086739
30-0.032856-0.35080.363189
31-0.003798-0.04060.483861
320.0558920.59680.275923
33-0.086134-0.91970.179845
34-0.095892-1.02380.154037
35-0.081925-0.87470.191782
36-0.140153-1.49640.068653
370.0469310.50110.308639
380.0587710.62750.265791
39-0.013428-0.14340.443126
40-0.026295-0.28080.389704
410.0542290.5790.281862
42-0.014834-0.15840.437217
43-0.153234-1.63610.052289
440.0673560.71920.236754
450.0627180.66960.252219
46-0.051281-0.54750.29254
47-0.05484-0.58550.279674
48-0.049953-0.53340.297414
490.0898850.95970.169616
50-0.045621-0.48710.313563
51-0.160903-1.7180.044258
520.035440.37840.352922
530.0208140.22220.412267
54-0.013882-0.14820.441217
550.0615450.65710.256213
560.100191.06970.143499
57-0.120326-1.28470.100745
58-0.067743-0.72330.235491
59-0.006863-0.07330.470856
60-0.014381-0.15360.439117

\begin{tabular}{lllllllll}
\hline
Partial Autocorrelation Function \tabularnewline
Time lag k & PACF(k) & T-STAT & P-value \tabularnewline
1 & 0.464499 & 4.9595 & 1e-06 \tabularnewline
2 & 0.183373 & 1.9579 & 0.026343 \tabularnewline
3 & 0.253719 & 2.709 & 0.003895 \tabularnewline
4 & -0.143604 & -1.5333 & 0.063989 \tabularnewline
5 & 0.07651 & 0.8169 & 0.207843 \tabularnewline
6 & -0.009748 & -0.1041 & 0.458645 \tabularnewline
7 & -0.028912 & -0.3087 & 0.379059 \tabularnewline
8 & -0.006301 & -0.0673 & 0.473239 \tabularnewline
9 & -0.053681 & -0.5732 & 0.283835 \tabularnewline
10 & -0.11216 & -1.1975 & 0.11679 \tabularnewline
11 & -0.184544 & -1.9704 & 0.025609 \tabularnewline
12 & -0.207089 & -2.2111 & 0.014512 \tabularnewline
13 & 0.316595 & 3.3803 & 0.000496 \tabularnewline
14 & 0.13131 & 1.402 & 0.081815 \tabularnewline
15 & -0.122484 & -1.3078 & 0.096791 \tabularnewline
16 & -0.089067 & -0.951 & 0.171814 \tabularnewline
17 & 0.097121 & 1.037 & 0.150972 \tabularnewline
18 & 0.067754 & 0.7234 & 0.235453 \tabularnewline
19 & -0.001702 & -0.0182 & 0.492768 \tabularnewline
20 & 0.126337 & 1.3489 & 0.09002 \tabularnewline
21 & 0.010941 & 0.1168 & 0.453604 \tabularnewline
22 & -0.149474 & -1.5959 & 0.056635 \tabularnewline
23 & -0.011407 & -0.1218 & 0.451638 \tabularnewline
24 & -0.196337 & -2.0963 & 0.019133 \tabularnewline
25 & 0.08323 & 0.8887 & 0.188029 \tabularnewline
26 & 0.137122 & 1.4641 & 0.072965 \tabularnewline
27 & 0.002862 & 0.0306 & 0.487839 \tabularnewline
28 & -0.141122 & -1.5068 & 0.067318 \tabularnewline
29 & 0.128282 & 1.3697 & 0.086739 \tabularnewline
30 & -0.032856 & -0.3508 & 0.363189 \tabularnewline
31 & -0.003798 & -0.0406 & 0.483861 \tabularnewline
32 & 0.055892 & 0.5968 & 0.275923 \tabularnewline
33 & -0.086134 & -0.9197 & 0.179845 \tabularnewline
34 & -0.095892 & -1.0238 & 0.154037 \tabularnewline
35 & -0.081925 & -0.8747 & 0.191782 \tabularnewline
36 & -0.140153 & -1.4964 & 0.068653 \tabularnewline
37 & 0.046931 & 0.5011 & 0.308639 \tabularnewline
38 & 0.058771 & 0.6275 & 0.265791 \tabularnewline
39 & -0.013428 & -0.1434 & 0.443126 \tabularnewline
40 & -0.026295 & -0.2808 & 0.389704 \tabularnewline
41 & 0.054229 & 0.579 & 0.281862 \tabularnewline
42 & -0.014834 & -0.1584 & 0.437217 \tabularnewline
43 & -0.153234 & -1.6361 & 0.052289 \tabularnewline
44 & 0.067356 & 0.7192 & 0.236754 \tabularnewline
45 & 0.062718 & 0.6696 & 0.252219 \tabularnewline
46 & -0.051281 & -0.5475 & 0.29254 \tabularnewline
47 & -0.05484 & -0.5855 & 0.279674 \tabularnewline
48 & -0.049953 & -0.5334 & 0.297414 \tabularnewline
49 & 0.089885 & 0.9597 & 0.169616 \tabularnewline
50 & -0.045621 & -0.4871 & 0.313563 \tabularnewline
51 & -0.160903 & -1.718 & 0.044258 \tabularnewline
52 & 0.03544 & 0.3784 & 0.352922 \tabularnewline
53 & 0.020814 & 0.2222 & 0.412267 \tabularnewline
54 & -0.013882 & -0.1482 & 0.441217 \tabularnewline
55 & 0.061545 & 0.6571 & 0.256213 \tabularnewline
56 & 0.10019 & 1.0697 & 0.143499 \tabularnewline
57 & -0.120326 & -1.2847 & 0.100745 \tabularnewline
58 & -0.067743 & -0.7233 & 0.235491 \tabularnewline
59 & -0.006863 & -0.0733 & 0.470856 \tabularnewline
60 & -0.014381 & -0.1536 & 0.439117 \tabularnewline
\hline
\end{tabular}
%Source: https://freestatistics.org/blog/index.php?pk=302947&T=2

[TABLE]
[ROW][C]Partial Autocorrelation Function[/C][/ROW]
[ROW][C]Time lag k[/C][C]PACF(k)[/C][C]T-STAT[/C][C]P-value[/C][/ROW]
[ROW][C]1[/C][C]0.464499[/C][C]4.9595[/C][C]1e-06[/C][/ROW]
[ROW][C]2[/C][C]0.183373[/C][C]1.9579[/C][C]0.026343[/C][/ROW]
[ROW][C]3[/C][C]0.253719[/C][C]2.709[/C][C]0.003895[/C][/ROW]
[ROW][C]4[/C][C]-0.143604[/C][C]-1.5333[/C][C]0.063989[/C][/ROW]
[ROW][C]5[/C][C]0.07651[/C][C]0.8169[/C][C]0.207843[/C][/ROW]
[ROW][C]6[/C][C]-0.009748[/C][C]-0.1041[/C][C]0.458645[/C][/ROW]
[ROW][C]7[/C][C]-0.028912[/C][C]-0.3087[/C][C]0.379059[/C][/ROW]
[ROW][C]8[/C][C]-0.006301[/C][C]-0.0673[/C][C]0.473239[/C][/ROW]
[ROW][C]9[/C][C]-0.053681[/C][C]-0.5732[/C][C]0.283835[/C][/ROW]
[ROW][C]10[/C][C]-0.11216[/C][C]-1.1975[/C][C]0.11679[/C][/ROW]
[ROW][C]11[/C][C]-0.184544[/C][C]-1.9704[/C][C]0.025609[/C][/ROW]
[ROW][C]12[/C][C]-0.207089[/C][C]-2.2111[/C][C]0.014512[/C][/ROW]
[ROW][C]13[/C][C]0.316595[/C][C]3.3803[/C][C]0.000496[/C][/ROW]
[ROW][C]14[/C][C]0.13131[/C][C]1.402[/C][C]0.081815[/C][/ROW]
[ROW][C]15[/C][C]-0.122484[/C][C]-1.3078[/C][C]0.096791[/C][/ROW]
[ROW][C]16[/C][C]-0.089067[/C][C]-0.951[/C][C]0.171814[/C][/ROW]
[ROW][C]17[/C][C]0.097121[/C][C]1.037[/C][C]0.150972[/C][/ROW]
[ROW][C]18[/C][C]0.067754[/C][C]0.7234[/C][C]0.235453[/C][/ROW]
[ROW][C]19[/C][C]-0.001702[/C][C]-0.0182[/C][C]0.492768[/C][/ROW]
[ROW][C]20[/C][C]0.126337[/C][C]1.3489[/C][C]0.09002[/C][/ROW]
[ROW][C]21[/C][C]0.010941[/C][C]0.1168[/C][C]0.453604[/C][/ROW]
[ROW][C]22[/C][C]-0.149474[/C][C]-1.5959[/C][C]0.056635[/C][/ROW]
[ROW][C]23[/C][C]-0.011407[/C][C]-0.1218[/C][C]0.451638[/C][/ROW]
[ROW][C]24[/C][C]-0.196337[/C][C]-2.0963[/C][C]0.019133[/C][/ROW]
[ROW][C]25[/C][C]0.08323[/C][C]0.8887[/C][C]0.188029[/C][/ROW]
[ROW][C]26[/C][C]0.137122[/C][C]1.4641[/C][C]0.072965[/C][/ROW]
[ROW][C]27[/C][C]0.002862[/C][C]0.0306[/C][C]0.487839[/C][/ROW]
[ROW][C]28[/C][C]-0.141122[/C][C]-1.5068[/C][C]0.067318[/C][/ROW]
[ROW][C]29[/C][C]0.128282[/C][C]1.3697[/C][C]0.086739[/C][/ROW]
[ROW][C]30[/C][C]-0.032856[/C][C]-0.3508[/C][C]0.363189[/C][/ROW]
[ROW][C]31[/C][C]-0.003798[/C][C]-0.0406[/C][C]0.483861[/C][/ROW]
[ROW][C]32[/C][C]0.055892[/C][C]0.5968[/C][C]0.275923[/C][/ROW]
[ROW][C]33[/C][C]-0.086134[/C][C]-0.9197[/C][C]0.179845[/C][/ROW]
[ROW][C]34[/C][C]-0.095892[/C][C]-1.0238[/C][C]0.154037[/C][/ROW]
[ROW][C]35[/C][C]-0.081925[/C][C]-0.8747[/C][C]0.191782[/C][/ROW]
[ROW][C]36[/C][C]-0.140153[/C][C]-1.4964[/C][C]0.068653[/C][/ROW]
[ROW][C]37[/C][C]0.046931[/C][C]0.5011[/C][C]0.308639[/C][/ROW]
[ROW][C]38[/C][C]0.058771[/C][C]0.6275[/C][C]0.265791[/C][/ROW]
[ROW][C]39[/C][C]-0.013428[/C][C]-0.1434[/C][C]0.443126[/C][/ROW]
[ROW][C]40[/C][C]-0.026295[/C][C]-0.2808[/C][C]0.389704[/C][/ROW]
[ROW][C]41[/C][C]0.054229[/C][C]0.579[/C][C]0.281862[/C][/ROW]
[ROW][C]42[/C][C]-0.014834[/C][C]-0.1584[/C][C]0.437217[/C][/ROW]
[ROW][C]43[/C][C]-0.153234[/C][C]-1.6361[/C][C]0.052289[/C][/ROW]
[ROW][C]44[/C][C]0.067356[/C][C]0.7192[/C][C]0.236754[/C][/ROW]
[ROW][C]45[/C][C]0.062718[/C][C]0.6696[/C][C]0.252219[/C][/ROW]
[ROW][C]46[/C][C]-0.051281[/C][C]-0.5475[/C][C]0.29254[/C][/ROW]
[ROW][C]47[/C][C]-0.05484[/C][C]-0.5855[/C][C]0.279674[/C][/ROW]
[ROW][C]48[/C][C]-0.049953[/C][C]-0.5334[/C][C]0.297414[/C][/ROW]
[ROW][C]49[/C][C]0.089885[/C][C]0.9597[/C][C]0.169616[/C][/ROW]
[ROW][C]50[/C][C]-0.045621[/C][C]-0.4871[/C][C]0.313563[/C][/ROW]
[ROW][C]51[/C][C]-0.160903[/C][C]-1.718[/C][C]0.044258[/C][/ROW]
[ROW][C]52[/C][C]0.03544[/C][C]0.3784[/C][C]0.352922[/C][/ROW]
[ROW][C]53[/C][C]0.020814[/C][C]0.2222[/C][C]0.412267[/C][/ROW]
[ROW][C]54[/C][C]-0.013882[/C][C]-0.1482[/C][C]0.441217[/C][/ROW]
[ROW][C]55[/C][C]0.061545[/C][C]0.6571[/C][C]0.256213[/C][/ROW]
[ROW][C]56[/C][C]0.10019[/C][C]1.0697[/C][C]0.143499[/C][/ROW]
[ROW][C]57[/C][C]-0.120326[/C][C]-1.2847[/C][C]0.100745[/C][/ROW]
[ROW][C]58[/C][C]-0.067743[/C][C]-0.7233[/C][C]0.235491[/C][/ROW]
[ROW][C]59[/C][C]-0.006863[/C][C]-0.0733[/C][C]0.470856[/C][/ROW]
[ROW][C]60[/C][C]-0.014381[/C][C]-0.1536[/C][C]0.439117[/C][/ROW]
[/TABLE]
Source: https://freestatistics.org/blog/index.php?pk=302947&T=2

Globally Unique Identifier (entire table): ba.freestatistics.org/blog/index.php?pk=302947&T=2

As an alternative you can also use a QR Code:  

The GUIDs for individual cells are displayed in the table below:

Partial Autocorrelation Function
Time lag kPACF(k)T-STATP-value
10.4644994.95951e-06
20.1833731.95790.026343
30.2537192.7090.003895
4-0.143604-1.53330.063989
50.076510.81690.207843
6-0.009748-0.10410.458645
7-0.028912-0.30870.379059
8-0.006301-0.06730.473239
9-0.053681-0.57320.283835
10-0.11216-1.19750.11679
11-0.184544-1.97040.025609
12-0.207089-2.21110.014512
130.3165953.38030.000496
140.131311.4020.081815
15-0.122484-1.30780.096791
16-0.089067-0.9510.171814
170.0971211.0370.150972
180.0677540.72340.235453
19-0.001702-0.01820.492768
200.1263371.34890.09002
210.0109410.11680.453604
22-0.149474-1.59590.056635
23-0.011407-0.12180.451638
24-0.196337-2.09630.019133
250.083230.88870.188029
260.1371221.46410.072965
270.0028620.03060.487839
28-0.141122-1.50680.067318
290.1282821.36970.086739
30-0.032856-0.35080.363189
31-0.003798-0.04060.483861
320.0558920.59680.275923
33-0.086134-0.91970.179845
34-0.095892-1.02380.154037
35-0.081925-0.87470.191782
36-0.140153-1.49640.068653
370.0469310.50110.308639
380.0587710.62750.265791
39-0.013428-0.14340.443126
40-0.026295-0.28080.389704
410.0542290.5790.281862
42-0.014834-0.15840.437217
43-0.153234-1.63610.052289
440.0673560.71920.236754
450.0627180.66960.252219
46-0.051281-0.54750.29254
47-0.05484-0.58550.279674
48-0.049953-0.53340.297414
490.0898850.95970.169616
50-0.045621-0.48710.313563
51-0.160903-1.7180.044258
520.035440.37840.352922
530.0208140.22220.412267
54-0.013882-0.14820.441217
550.0615450.65710.256213
560.100191.06970.143499
57-0.120326-1.28470.100745
58-0.067743-0.72330.235491
59-0.006863-0.07330.470856
60-0.014381-0.15360.439117


Parameters (Session):
par1 = 60 ; par2 = 1 ; par3 = 1 ; par4 = 1 ; par5 = 12 ; par6 = White Noise ; par7 = 0.95 ;
Parameters (R input):
par1 = 60 ; par2 = 1 ; par3 = 0 ; par4 = 1 ; par5 = 12 ; par6 = White Noise ; par7 = 0.95 ; par8 = ;
R code (references can be found in the software module):
par8 <- ''
par7 <- '0.95'
par6 <- 'White Noise'
par5 <- '12'
par4 <- '0'
par3 <- '0'
par2 <- '1'
par1 <- '60'
if (par1 == 'Default') {
par1 = 10*log10(length(x))
} else {
par1 <- as.numeric(par1)
}
par2 <- as.numeric(par2)
par3 <- as.numeric(par3)
par4 <- as.numeric(par4)
par5 <- as.numeric(par5)
if (par6 == 'White Noise') par6 <- 'white' else par6 <- 'ma'
par7 <- as.numeric(par7)
if (par8 != '') par8 <- as.numeric(par8)
x <- na.omit(x)
ox <- x
if (par8 == '') {
if (par2 == 0) {
x <- log(x)
} else {
x <- (x ^ par2 - 1) / par2
}
} else {
x <- log(x,base=par8)
}
if (par3 > 0) x <- diff(x,lag=1,difference=par3)
if (par4 > 0) x <- diff(x,lag=par5,difference=par4)
bitmap(file='picts.png')
op <- par(mfrow=c(2,1))
plot(ox,type='l',main='Original Time Series',xlab='time',ylab='value')
if (par8=='') {
mytitle <- paste('Working Time Series (lambda=',par2,', d=',par3,', D=',par4,')',sep='')
mysub <- paste('(lambda=',par2,', d=',par3,', D=',par4,', CI=', par7, ', CI type=',par6,')',sep='')
} else {
mytitle <- paste('Working Time Series (base=',par8,', d=',par3,', D=',par4,')',sep='')
mysub <- paste('(base=',par8,', d=',par3,', D=',par4,', CI=', par7, ', CI type=',par6,')',sep='')
}
plot(x,type='l', main=mytitle,xlab='time',ylab='value')
par(op)
dev.off()
bitmap(file='pic1.png')
racf <- acf(x, par1, main='Autocorrelation', xlab='time lag', ylab='ACF', ci.type=par6, ci=par7, sub=mysub)
dev.off()
bitmap(file='pic2.png')
rpacf <- pacf(x,par1,main='Partial Autocorrelation',xlab='lags',ylab='PACF',sub=mysub)
dev.off()
(myacf <- c(racf$acf))
(mypacf <- c(rpacf$acf))
lengthx <- length(x)
sqrtn <- sqrt(lengthx)
load(file='createtable')
a<-table.start()
a<-table.row.start(a)
a<-table.element(a,'Autocorrelation Function',4,TRUE)
a<-table.row.end(a)
a<-table.row.start(a)
a<-table.element(a,'Time lag k',header=TRUE)
a<-table.element(a,'ACF(k)',header=TRUE)
a<-table.element(a,'T-STAT',header=TRUE)
a<-table.element(a,'P-value',header=TRUE)
a<-table.row.end(a)
for (i in 2:(par1+1)) {
a<-table.row.start(a)
a<-table.element(a,i-1,header=TRUE)
a<-table.element(a,round(myacf[i],6))
mytstat <- myacf[i]*sqrtn
a<-table.element(a,round(mytstat,4))
a<-table.element(a,round(1-pt(abs(mytstat),lengthx),6))
a<-table.row.end(a)
}
a<-table.end(a)
table.save(a,file='mytable.tab')
a<-table.start()
a<-table.row.start(a)
a<-table.element(a,'Partial Autocorrelation Function',4,TRUE)
a<-table.row.end(a)
a<-table.row.start(a)
a<-table.element(a,'Time lag k',header=TRUE)
a<-table.element(a,'PACF(k)',header=TRUE)
a<-table.element(a,'T-STAT',header=TRUE)
a<-table.element(a,'P-value',header=TRUE)
a<-table.row.end(a)
for (i in 1:par1) {
a<-table.row.start(a)
a<-table.element(a,i,header=TRUE)
a<-table.element(a,round(mypacf[i],6))
mytstat <- mypacf[i]*sqrtn
a<-table.element(a,round(mytstat,4))
a<-table.element(a,round(1-pt(abs(mytstat),lengthx),6))
a<-table.row.end(a)
}
a<-table.end(a)
table.save(a,file='mytable1.tab')