Free Statistics
of Irreproducible Research!
Description of Statistical Computation | ||||||||||||||||||||||||||||||||||||||||||||||||
|---|---|---|---|---|---|---|---|---|---|---|---|---|---|---|---|---|---|---|---|---|---|---|---|---|---|---|---|---|---|---|---|---|---|---|---|---|---|---|---|---|---|---|---|---|---|---|---|---|
| Author's title | ||||||||||||||||||||||||||||||||||||||||||||||||
| Author | *The author of this computation has been verified* | |||||||||||||||||||||||||||||||||||||||||||||||
| R Software Module | rwasp_fitdistrnorm.wasp | |||||||||||||||||||||||||||||||||||||||||||||||
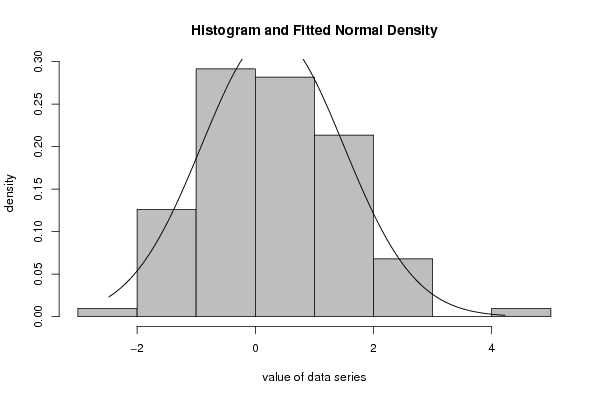
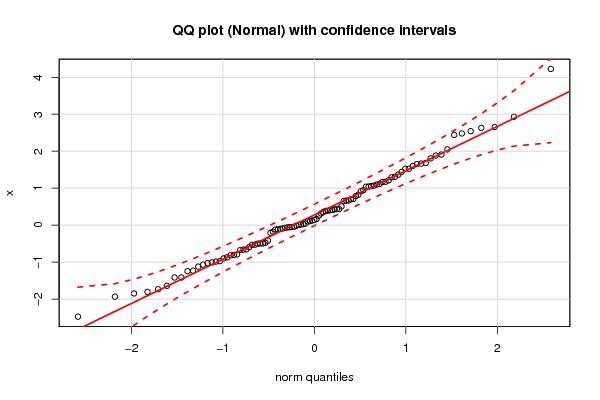
| Title produced by software | ML Fitting and QQ Plot- Normal Distribution | |||||||||||||||||||||||||||||||||||||||||||||||
| Date of computation | Fri, 23 Dec 2016 18:04:17 +0100 | |||||||||||||||||||||||||||||||||||||||||||||||
| Cite this page as follows | Statistical Computations at FreeStatistics.org, Office for Research Development and Education, URL https://freestatistics.org/blog/index.php?v=date/2016/Dec/23/t14825128561i0bgozed97mgk8.htm/, Retrieved Tue, 07 May 2024 07:42:26 +0000 | |||||||||||||||||||||||||||||||||||||||||||||||
| Statistical Computations at FreeStatistics.org, Office for Research Development and Education, URL https://freestatistics.org/blog/index.php?pk=303006, Retrieved Tue, 07 May 2024 07:42:26 +0000 | ||||||||||||||||||||||||||||||||||||||||||||||||
| QR Codes: | ||||||||||||||||||||||||||||||||||||||||||||||||
|
| ||||||||||||||||||||||||||||||||||||||||||||||||
| Original text written by user: | ||||||||||||||||||||||||||||||||||||||||||||||||
| IsPrivate? | No (this computation is public) | |||||||||||||||||||||||||||||||||||||||||||||||
| User-defined keywords | ||||||||||||||||||||||||||||||||||||||||||||||||
| Estimated Impact | 55 | |||||||||||||||||||||||||||||||||||||||||||||||
Tree of Dependent Computations | ||||||||||||||||||||||||||||||||||||||||||||||||
| Family? (F = Feedback message, R = changed R code, M = changed R Module, P = changed Parameters, D = changed Data) | ||||||||||||||||||||||||||||||||||||||||||||||||
| - [Univariate Data Series] [data set] [2008-12-01 19:54:57] [b98453cac15ba1066b407e146608df68] - RMP [Standard Deviation-Mean Plot] [Unemployment] [2010-11-29 10:34:47] [b98453cac15ba1066b407e146608df68] - RMP [ARIMA Forecasting] [Unemployment] [2010-11-29 20:46:45] [b98453cac15ba1066b407e146608df68] - RMPD [ML Fitting and QQ Plot- Normal Distribution] [] [2016-12-23 17:04:17] [8e62cbb8023b87d93040197279d31dd8] [Current] | ||||||||||||||||||||||||||||||||||||||||||||||||
| Feedback Forum | ||||||||||||||||||||||||||||||||||||||||||||||||
Post a new message | ||||||||||||||||||||||||||||||||||||||||||||||||
Dataset | ||||||||||||||||||||||||||||||||||||||||||||||||
| Dataseries X: | ||||||||||||||||||||||||||||||||||||||||||||||||
-0.119674416544362 -1.2450549365719 -1.23244433471217 1.30790827126443 1.20948241281955 1.80559083537745 1.44157342401413 -0.0612599385511935 1.17312952359567 1.0427017874741 0.100662442465355 1.90947079978085 0.0256403875064649 0.786773497633863 -0.79187319808136 0.6617995940124 -0.974598824964366 0.139688820853106 1.11523800679395 1.16578819604624 0.917183625813945 -1.02774403878696 -0.495313819428477 2.04914536794034 -0.816825738918989 0.314804229995915 -0.656108916619367 -1.73496248880003 2.65425437405061 0.427849967948113 -0.900143397335664 -0.529695971421035 0.38726438057771 2.54127152178279 0.407492867067053 -0.0740884912076537 1.60220963412373 0.821175279293522 -1.41526058292817 -0.67212500056963 0.167468962489227 1.52558066788428 0.43563170466575 -0.113544652800771 -0.662682391908132 1.66538064369683 -0.208976532793211 1.29384301051877 0.00386049365663801 0.351210754315221 -1.12274804323334 4.22475303823733 -1.01004066067026 0.0176686572492463 2.93068542227433 0.654810601551035 1.88053980862705 -0.102722439253246 -0.596158155665421 -0.987458624780075 -1.80693330399875 -0.8716713132348 -1.06995498649081 1.05473522848653 1.36505705645487 2.43950476595327 0.701505084745527 -0.421885237652541 -0.181009416535983 -2.47614318853498 1.06896972089709 0.255347879826023 -0.53285317401478 -0.804852425583787 1.52492365314007 0.404028401347959 0.507192257644832 -0.0509858295551438 0.383926818577598 0.434619003257549 -0.042291314201279 -1.84789561783062 -0.475598836698206 1.65122533982314 0.665612478635599 0.107510777662284 2.62813955602553 -1.64187168609857 1.68223631451145 -0.0880786076704655 -1.93529012079269 1.0970156409052 0.708376005580569 -0.0144862691526715 0.945708656929019 0.0436411692136322 -0.503107268247707 -0.495866542906712 -1.41632854989571 2.47950071525069 1.03789264432948 -0.0567835563599925 0.124933932183552 | ||||||||||||||||||||||||||||||||||||||||||||||||
Tables (Output of Computation) | ||||||||||||||||||||||||||||||||||||||||||||||||
| ||||||||||||||||||||||||||||||||||||||||||||||||
Figures (Output of Computation) | ||||||||||||||||||||||||||||||||||||||||||||||||
Input Parameters & R Code | ||||||||||||||||||||||||||||||||||||||||||||||||
| Parameters (Session): | ||||||||||||||||||||||||||||||||||||||||||||||||
| par1 = 8 ; par2 = 0 ; | ||||||||||||||||||||||||||||||||||||||||||||||||
| Parameters (R input): | ||||||||||||||||||||||||||||||||||||||||||||||||
| par1 = 8 ; par2 = 0 ; | ||||||||||||||||||||||||||||||||||||||||||||||||
| R code (references can be found in the software module): | ||||||||||||||||||||||||||||||||||||||||||||||||
library(MASS) | ||||||||||||||||||||||||||||||||||||||||||||||||