Free Statistics

of Irreproducible Research!

Author's title

Author*The author of this computation has been verified*
R Software Modulerwasp_autocorrelation.wasp
Title produced by software(Partial) Autocorrelation Function
Date of computationWed, 28 Dec 2016 11:18:01 +0100
Cite this page as followsStatistical Computations at FreeStatistics.org, Office for Research Development and Education, URL https://freestatistics.org/blog/index.php?v=date/2016/Dec/28/t1482920302nzj3k6t2vts3ddx.htm/, Retrieved Sun, 05 May 2024 14:14:33 +0000
Statistical Computations at FreeStatistics.org, Office for Research Development and Education, URL https://freestatistics.org/blog/index.php?pk=303105, Retrieved Sun, 05 May 2024 14:14:33 +0000
QR Codes:

Original text written by user:
IsPrivate?No (this computation is public)
User-defined keywords
Estimated Impact112
Family? (F = Feedback message, R = changed R code, M = changed R Module, P = changed Parameters, D = changed Data)
-       [(Partial) Autocorrelation Function] [] [2016-12-28 10:18:01] [def48497f28d33434d2b266acb94ba5d] [Current]
Feedback Forum

Post a new message
Dataseries X:
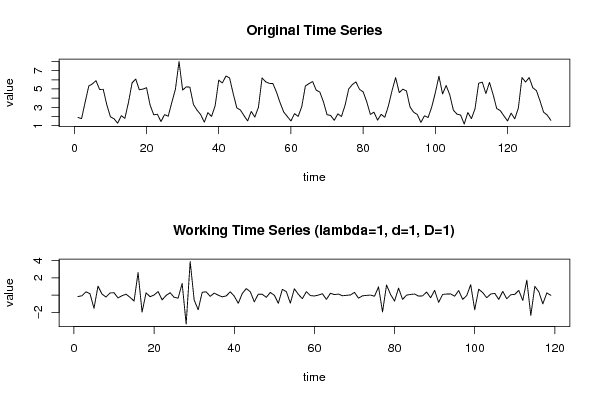
1.894
1.757
3.582
5.321
5.561
5.907
4.944
4.966
3.258
1.964
1.743
1.262
2.086
1.793
3.548
5.672
6.084
4.914
4.990
5.139
3.218
2.179
2.238
1.442
2.205
2.025
3.531
4.977
7.998
4.880
5.231
5.202
3.303
2.683
2.202
1.376
2.422
1.997
3.163
5.964
5.657
6.415
6.208
4.500
2.939
2.702
2.090
1.504
2.549
1.931
3.013
6.204
5.788
5.611
5.594
4.647
3.490
2.487
1.992
1.507
2.306
2.002
3.075
5.331
5.589
5.813
4.876
4.665
3.601
2.192
2.111
1.580
2.288
1.993
3.228
5.000
5.480
5.770
4.962
4.685
3.607
2.222
2.467
1.594
2.228
1.910
3.157
4.809
6.249
4.607
4.975
4.784
3.028
2.461
2.218
1.351
2.070
1.887
3.024
4.596
6.398
4.459
5.382
4.359
2.687
2.249
2.154
1.169
2.429
1.762
2.846
5.627
5.749
4.502
5.720
4.403
2.867
2.635
2.059
1.511
2.359
1.741
2.917
6.249
5.760
6.250
5.134
4.831
3.695
2.462
2.146
1.579


Summary of computational transaction
Raw Input view raw input (R code)
Raw Outputview raw output of R engine
Computing time2 seconds
R ServerBig Analytics Cloud Computing Center

\begin{tabular}{lllllllll}
\hline
Summary of computational transaction \tabularnewline
Raw Input view raw input (R code)  \tabularnewline
Raw Outputview raw output of R engine  \tabularnewline
Computing time2 seconds \tabularnewline
R ServerBig Analytics Cloud Computing Center \tabularnewline
\hline
\end{tabular}
%Source: https://freestatistics.org/blog/index.php?pk=303105&T=0

[TABLE]
[ROW]
Summary of computational transaction[/C][/ROW] [ROW]Raw Input[/C] view raw input (R code) [/C][/ROW] [ROW]Raw Output[/C]view raw output of R engine [/C][/ROW] [ROW]Computing time[/C]2 seconds[/C][/ROW] [ROW]R Server[/C]Big Analytics Cloud Computing Center[/C][/ROW] [/TABLE] Source: https://freestatistics.org/blog/index.php?pk=303105&T=0

Globally Unique Identifier (entire table): ba.freestatistics.org/blog/index.php?pk=303105&T=0

As an alternative you can also use a QR Code:  

The GUIDs for individual cells are displayed in the table below:

Summary of computational transaction
Raw Input view raw input (R code)
Raw Outputview raw output of R engine
Computing time2 seconds
R ServerBig Analytics Cloud Computing Center


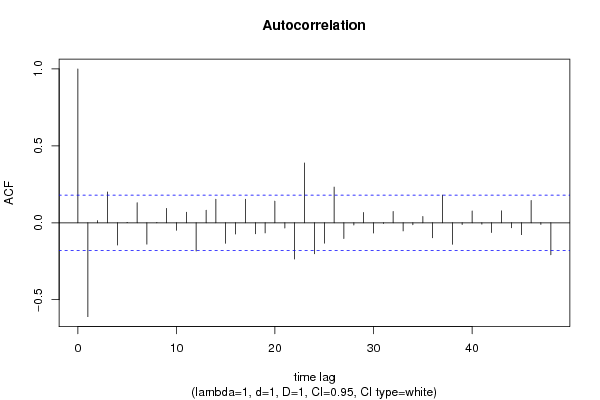
Autocorrelation Function
Time lag kACF(k)T-STATP-value
1-0.609963-6.65390
20.0140850.15360.439074
30.2006582.18890.015277
4-0.144568-1.57710.058719
50.0011330.01240.495078
60.130661.42530.078339
7-0.13888-1.5150.066212
80.002540.02770.488972
90.0936231.02130.154589
10-0.048054-0.52420.300556
110.0685640.74790.227983
12-0.18277-1.99380.024231
130.0819670.89420.186522
140.1536661.67630.048153
15-0.13316-1.45260.074483
16-0.072641-0.79240.214845
170.1533141.67250.04853
18-0.070721-0.77150.220976
19-0.065707-0.71680.237456
200.1407451.53540.063676
21-0.033518-0.36560.357641
22-0.235098-2.56460.005786
230.3890034.24352.2e-05
24-0.201486-2.1980.014944
25-0.132177-1.44190.075981
260.2320362.53120.006336
27-0.102418-1.11730.133069
28-0.013934-0.1520.439721
290.0669280.73010.233381
30-0.065791-0.71770.237175
31-0.004753-0.05180.47937
320.0731450.79790.213253
33-0.052394-0.57160.284352
34-0.013129-0.14320.443179
350.0412610.45010.326728
36-0.097249-1.06090.14545
370.1799711.96320.025975
38-0.139501-1.52180.065359
39-0.011581-0.12630.449841
400.0766030.83560.202518
41-0.008549-0.09330.462926
42-0.063475-0.69240.245008
430.0777530.84820.199018
44-0.032551-0.35510.361576
45-0.076751-0.83730.202062
460.1445661.5770.058722
47-0.010333-0.11270.455221
48-0.207853-2.26740.012585

\begin{tabular}{lllllllll}
\hline
Autocorrelation Function \tabularnewline
Time lag k & ACF(k) & T-STAT & P-value \tabularnewline
1 & -0.609963 & -6.6539 & 0 \tabularnewline
2 & 0.014085 & 0.1536 & 0.439074 \tabularnewline
3 & 0.200658 & 2.1889 & 0.015277 \tabularnewline
4 & -0.144568 & -1.5771 & 0.058719 \tabularnewline
5 & 0.001133 & 0.0124 & 0.495078 \tabularnewline
6 & 0.13066 & 1.4253 & 0.078339 \tabularnewline
7 & -0.13888 & -1.515 & 0.066212 \tabularnewline
8 & 0.00254 & 0.0277 & 0.488972 \tabularnewline
9 & 0.093623 & 1.0213 & 0.154589 \tabularnewline
10 & -0.048054 & -0.5242 & 0.300556 \tabularnewline
11 & 0.068564 & 0.7479 & 0.227983 \tabularnewline
12 & -0.18277 & -1.9938 & 0.024231 \tabularnewline
13 & 0.081967 & 0.8942 & 0.186522 \tabularnewline
14 & 0.153666 & 1.6763 & 0.048153 \tabularnewline
15 & -0.13316 & -1.4526 & 0.074483 \tabularnewline
16 & -0.072641 & -0.7924 & 0.214845 \tabularnewline
17 & 0.153314 & 1.6725 & 0.04853 \tabularnewline
18 & -0.070721 & -0.7715 & 0.220976 \tabularnewline
19 & -0.065707 & -0.7168 & 0.237456 \tabularnewline
20 & 0.140745 & 1.5354 & 0.063676 \tabularnewline
21 & -0.033518 & -0.3656 & 0.357641 \tabularnewline
22 & -0.235098 & -2.5646 & 0.005786 \tabularnewline
23 & 0.389003 & 4.2435 & 2.2e-05 \tabularnewline
24 & -0.201486 & -2.198 & 0.014944 \tabularnewline
25 & -0.132177 & -1.4419 & 0.075981 \tabularnewline
26 & 0.232036 & 2.5312 & 0.006336 \tabularnewline
27 & -0.102418 & -1.1173 & 0.133069 \tabularnewline
28 & -0.013934 & -0.152 & 0.439721 \tabularnewline
29 & 0.066928 & 0.7301 & 0.233381 \tabularnewline
30 & -0.065791 & -0.7177 & 0.237175 \tabularnewline
31 & -0.004753 & -0.0518 & 0.47937 \tabularnewline
32 & 0.073145 & 0.7979 & 0.213253 \tabularnewline
33 & -0.052394 & -0.5716 & 0.284352 \tabularnewline
34 & -0.013129 & -0.1432 & 0.443179 \tabularnewline
35 & 0.041261 & 0.4501 & 0.326728 \tabularnewline
36 & -0.097249 & -1.0609 & 0.14545 \tabularnewline
37 & 0.179971 & 1.9632 & 0.025975 \tabularnewline
38 & -0.139501 & -1.5218 & 0.065359 \tabularnewline
39 & -0.011581 & -0.1263 & 0.449841 \tabularnewline
40 & 0.076603 & 0.8356 & 0.202518 \tabularnewline
41 & -0.008549 & -0.0933 & 0.462926 \tabularnewline
42 & -0.063475 & -0.6924 & 0.245008 \tabularnewline
43 & 0.077753 & 0.8482 & 0.199018 \tabularnewline
44 & -0.032551 & -0.3551 & 0.361576 \tabularnewline
45 & -0.076751 & -0.8373 & 0.202062 \tabularnewline
46 & 0.144566 & 1.577 & 0.058722 \tabularnewline
47 & -0.010333 & -0.1127 & 0.455221 \tabularnewline
48 & -0.207853 & -2.2674 & 0.012585 \tabularnewline
\hline
\end{tabular}
%Source: https://freestatistics.org/blog/index.php?pk=303105&T=1

[TABLE]
[ROW][C]Autocorrelation Function[/C][/ROW]
[ROW][C]Time lag k[/C][C]ACF(k)[/C][C]T-STAT[/C][C]P-value[/C][/ROW]
[ROW][C]1[/C][C]-0.609963[/C][C]-6.6539[/C][C]0[/C][/ROW]
[ROW][C]2[/C][C]0.014085[/C][C]0.1536[/C][C]0.439074[/C][/ROW]
[ROW][C]3[/C][C]0.200658[/C][C]2.1889[/C][C]0.015277[/C][/ROW]
[ROW][C]4[/C][C]-0.144568[/C][C]-1.5771[/C][C]0.058719[/C][/ROW]
[ROW][C]5[/C][C]0.001133[/C][C]0.0124[/C][C]0.495078[/C][/ROW]
[ROW][C]6[/C][C]0.13066[/C][C]1.4253[/C][C]0.078339[/C][/ROW]
[ROW][C]7[/C][C]-0.13888[/C][C]-1.515[/C][C]0.066212[/C][/ROW]
[ROW][C]8[/C][C]0.00254[/C][C]0.0277[/C][C]0.488972[/C][/ROW]
[ROW][C]9[/C][C]0.093623[/C][C]1.0213[/C][C]0.154589[/C][/ROW]
[ROW][C]10[/C][C]-0.048054[/C][C]-0.5242[/C][C]0.300556[/C][/ROW]
[ROW][C]11[/C][C]0.068564[/C][C]0.7479[/C][C]0.227983[/C][/ROW]
[ROW][C]12[/C][C]-0.18277[/C][C]-1.9938[/C][C]0.024231[/C][/ROW]
[ROW][C]13[/C][C]0.081967[/C][C]0.8942[/C][C]0.186522[/C][/ROW]
[ROW][C]14[/C][C]0.153666[/C][C]1.6763[/C][C]0.048153[/C][/ROW]
[ROW][C]15[/C][C]-0.13316[/C][C]-1.4526[/C][C]0.074483[/C][/ROW]
[ROW][C]16[/C][C]-0.072641[/C][C]-0.7924[/C][C]0.214845[/C][/ROW]
[ROW][C]17[/C][C]0.153314[/C][C]1.6725[/C][C]0.04853[/C][/ROW]
[ROW][C]18[/C][C]-0.070721[/C][C]-0.7715[/C][C]0.220976[/C][/ROW]
[ROW][C]19[/C][C]-0.065707[/C][C]-0.7168[/C][C]0.237456[/C][/ROW]
[ROW][C]20[/C][C]0.140745[/C][C]1.5354[/C][C]0.063676[/C][/ROW]
[ROW][C]21[/C][C]-0.033518[/C][C]-0.3656[/C][C]0.357641[/C][/ROW]
[ROW][C]22[/C][C]-0.235098[/C][C]-2.5646[/C][C]0.005786[/C][/ROW]
[ROW][C]23[/C][C]0.389003[/C][C]4.2435[/C][C]2.2e-05[/C][/ROW]
[ROW][C]24[/C][C]-0.201486[/C][C]-2.198[/C][C]0.014944[/C][/ROW]
[ROW][C]25[/C][C]-0.132177[/C][C]-1.4419[/C][C]0.075981[/C][/ROW]
[ROW][C]26[/C][C]0.232036[/C][C]2.5312[/C][C]0.006336[/C][/ROW]
[ROW][C]27[/C][C]-0.102418[/C][C]-1.1173[/C][C]0.133069[/C][/ROW]
[ROW][C]28[/C][C]-0.013934[/C][C]-0.152[/C][C]0.439721[/C][/ROW]
[ROW][C]29[/C][C]0.066928[/C][C]0.7301[/C][C]0.233381[/C][/ROW]
[ROW][C]30[/C][C]-0.065791[/C][C]-0.7177[/C][C]0.237175[/C][/ROW]
[ROW][C]31[/C][C]-0.004753[/C][C]-0.0518[/C][C]0.47937[/C][/ROW]
[ROW][C]32[/C][C]0.073145[/C][C]0.7979[/C][C]0.213253[/C][/ROW]
[ROW][C]33[/C][C]-0.052394[/C][C]-0.5716[/C][C]0.284352[/C][/ROW]
[ROW][C]34[/C][C]-0.013129[/C][C]-0.1432[/C][C]0.443179[/C][/ROW]
[ROW][C]35[/C][C]0.041261[/C][C]0.4501[/C][C]0.326728[/C][/ROW]
[ROW][C]36[/C][C]-0.097249[/C][C]-1.0609[/C][C]0.14545[/C][/ROW]
[ROW][C]37[/C][C]0.179971[/C][C]1.9632[/C][C]0.025975[/C][/ROW]
[ROW][C]38[/C][C]-0.139501[/C][C]-1.5218[/C][C]0.065359[/C][/ROW]
[ROW][C]39[/C][C]-0.011581[/C][C]-0.1263[/C][C]0.449841[/C][/ROW]
[ROW][C]40[/C][C]0.076603[/C][C]0.8356[/C][C]0.202518[/C][/ROW]
[ROW][C]41[/C][C]-0.008549[/C][C]-0.0933[/C][C]0.462926[/C][/ROW]
[ROW][C]42[/C][C]-0.063475[/C][C]-0.6924[/C][C]0.245008[/C][/ROW]
[ROW][C]43[/C][C]0.077753[/C][C]0.8482[/C][C]0.199018[/C][/ROW]
[ROW][C]44[/C][C]-0.032551[/C][C]-0.3551[/C][C]0.361576[/C][/ROW]
[ROW][C]45[/C][C]-0.076751[/C][C]-0.8373[/C][C]0.202062[/C][/ROW]
[ROW][C]46[/C][C]0.144566[/C][C]1.577[/C][C]0.058722[/C][/ROW]
[ROW][C]47[/C][C]-0.010333[/C][C]-0.1127[/C][C]0.455221[/C][/ROW]
[ROW][C]48[/C][C]-0.207853[/C][C]-2.2674[/C][C]0.012585[/C][/ROW]
[/TABLE]
Source: https://freestatistics.org/blog/index.php?pk=303105&T=1

Globally Unique Identifier (entire table): ba.freestatistics.org/blog/index.php?pk=303105&T=1

As an alternative you can also use a QR Code:  

The GUIDs for individual cells are displayed in the table below:

Autocorrelation Function
Time lag kACF(k)T-STATP-value
1-0.609963-6.65390
20.0140850.15360.439074
30.2006582.18890.015277
4-0.144568-1.57710.058719
50.0011330.01240.495078
60.130661.42530.078339
7-0.13888-1.5150.066212
80.002540.02770.488972
90.0936231.02130.154589
10-0.048054-0.52420.300556
110.0685640.74790.227983
12-0.18277-1.99380.024231
130.0819670.89420.186522
140.1536661.67630.048153
15-0.13316-1.45260.074483
16-0.072641-0.79240.214845
170.1533141.67250.04853
18-0.070721-0.77150.220976
19-0.065707-0.71680.237456
200.1407451.53540.063676
21-0.033518-0.36560.357641
22-0.235098-2.56460.005786
230.3890034.24352.2e-05
24-0.201486-2.1980.014944
25-0.132177-1.44190.075981
260.2320362.53120.006336
27-0.102418-1.11730.133069
28-0.013934-0.1520.439721
290.0669280.73010.233381
30-0.065791-0.71770.237175
31-0.004753-0.05180.47937
320.0731450.79790.213253
33-0.052394-0.57160.284352
34-0.013129-0.14320.443179
350.0412610.45010.326728
36-0.097249-1.06090.14545
370.1799711.96320.025975
38-0.139501-1.52180.065359
39-0.011581-0.12630.449841
400.0766030.83560.202518
41-0.008549-0.09330.462926
42-0.063475-0.69240.245008
430.0777530.84820.199018
44-0.032551-0.35510.361576
45-0.076751-0.83730.202062
460.1445661.5770.058722
47-0.010333-0.11270.455221
48-0.207853-2.26740.012585


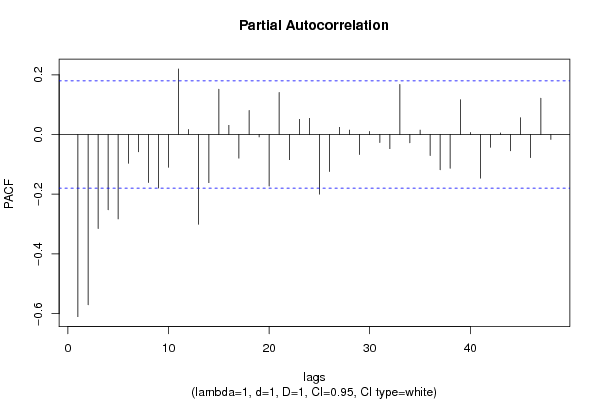
Partial Autocorrelation Function
Time lag kPACF(k)T-STATP-value
1-0.609963-6.65390
2-0.570066-6.21870
3-0.315118-3.43750.000405
4-0.252198-2.75120.003434
5-0.282695-3.08380.00127
6-0.096166-1.0490.148141
7-0.057637-0.62870.26536
8-0.160803-1.75420.040989
9-0.179234-1.95520.026451
10-0.109688-1.19660.11693
110.2194182.39360.009124
120.0169720.18510.426716
13-0.300653-3.27970.000682
14-0.161219-1.75870.0406
150.1516611.65440.050338
160.0304270.33190.370269
17-0.079298-0.8650.194378
180.0804110.87720.191077
19-0.008137-0.08880.46471
20-0.172815-1.88520.030922
210.1407061.53490.063729
22-0.084235-0.91890.180005
230.0505510.55140.291182
240.0538890.58790.278871
25-0.19984-2.180.015613
26-0.124267-1.35560.088898
270.0238220.25990.397708
280.0145480.15870.437086
29-0.066817-0.72890.233751
300.0102570.11190.455548
31-0.026672-0.2910.385795
32-0.047438-0.51750.302887
330.1675161.82740.035074
34-0.027978-0.30520.380371
350.0147140.16050.436375
36-0.070139-0.76510.222854
37-0.118161-1.2890.099952
38-0.113225-1.23510.109606
390.1163411.26910.103436
400.0065570.07150.471549
41-0.146237-1.59530.056654
42-0.04269-0.46570.321143
430.0052090.05680.47739
44-0.054262-0.59190.277512
450.0558130.60880.271894
46-0.077404-0.84440.200075
470.12121.32210.09433
48-0.016533-0.18040.428592

\begin{tabular}{lllllllll}
\hline
Partial Autocorrelation Function \tabularnewline
Time lag k & PACF(k) & T-STAT & P-value \tabularnewline
1 & -0.609963 & -6.6539 & 0 \tabularnewline
2 & -0.570066 & -6.2187 & 0 \tabularnewline
3 & -0.315118 & -3.4375 & 0.000405 \tabularnewline
4 & -0.252198 & -2.7512 & 0.003434 \tabularnewline
5 & -0.282695 & -3.0838 & 0.00127 \tabularnewline
6 & -0.096166 & -1.049 & 0.148141 \tabularnewline
7 & -0.057637 & -0.6287 & 0.26536 \tabularnewline
8 & -0.160803 & -1.7542 & 0.040989 \tabularnewline
9 & -0.179234 & -1.9552 & 0.026451 \tabularnewline
10 & -0.109688 & -1.1966 & 0.11693 \tabularnewline
11 & 0.219418 & 2.3936 & 0.009124 \tabularnewline
12 & 0.016972 & 0.1851 & 0.426716 \tabularnewline
13 & -0.300653 & -3.2797 & 0.000682 \tabularnewline
14 & -0.161219 & -1.7587 & 0.0406 \tabularnewline
15 & 0.151661 & 1.6544 & 0.050338 \tabularnewline
16 & 0.030427 & 0.3319 & 0.370269 \tabularnewline
17 & -0.079298 & -0.865 & 0.194378 \tabularnewline
18 & 0.080411 & 0.8772 & 0.191077 \tabularnewline
19 & -0.008137 & -0.0888 & 0.46471 \tabularnewline
20 & -0.172815 & -1.8852 & 0.030922 \tabularnewline
21 & 0.140706 & 1.5349 & 0.063729 \tabularnewline
22 & -0.084235 & -0.9189 & 0.180005 \tabularnewline
23 & 0.050551 & 0.5514 & 0.291182 \tabularnewline
24 & 0.053889 & 0.5879 & 0.278871 \tabularnewline
25 & -0.19984 & -2.18 & 0.015613 \tabularnewline
26 & -0.124267 & -1.3556 & 0.088898 \tabularnewline
27 & 0.023822 & 0.2599 & 0.397708 \tabularnewline
28 & 0.014548 & 0.1587 & 0.437086 \tabularnewline
29 & -0.066817 & -0.7289 & 0.233751 \tabularnewline
30 & 0.010257 & 0.1119 & 0.455548 \tabularnewline
31 & -0.026672 & -0.291 & 0.385795 \tabularnewline
32 & -0.047438 & -0.5175 & 0.302887 \tabularnewline
33 & 0.167516 & 1.8274 & 0.035074 \tabularnewline
34 & -0.027978 & -0.3052 & 0.380371 \tabularnewline
35 & 0.014714 & 0.1605 & 0.436375 \tabularnewline
36 & -0.070139 & -0.7651 & 0.222854 \tabularnewline
37 & -0.118161 & -1.289 & 0.099952 \tabularnewline
38 & -0.113225 & -1.2351 & 0.109606 \tabularnewline
39 & 0.116341 & 1.2691 & 0.103436 \tabularnewline
40 & 0.006557 & 0.0715 & 0.471549 \tabularnewline
41 & -0.146237 & -1.5953 & 0.056654 \tabularnewline
42 & -0.04269 & -0.4657 & 0.321143 \tabularnewline
43 & 0.005209 & 0.0568 & 0.47739 \tabularnewline
44 & -0.054262 & -0.5919 & 0.277512 \tabularnewline
45 & 0.055813 & 0.6088 & 0.271894 \tabularnewline
46 & -0.077404 & -0.8444 & 0.200075 \tabularnewline
47 & 0.1212 & 1.3221 & 0.09433 \tabularnewline
48 & -0.016533 & -0.1804 & 0.428592 \tabularnewline
\hline
\end{tabular}
%Source: https://freestatistics.org/blog/index.php?pk=303105&T=2

[TABLE]
[ROW][C]Partial Autocorrelation Function[/C][/ROW]
[ROW][C]Time lag k[/C][C]PACF(k)[/C][C]T-STAT[/C][C]P-value[/C][/ROW]
[ROW][C]1[/C][C]-0.609963[/C][C]-6.6539[/C][C]0[/C][/ROW]
[ROW][C]2[/C][C]-0.570066[/C][C]-6.2187[/C][C]0[/C][/ROW]
[ROW][C]3[/C][C]-0.315118[/C][C]-3.4375[/C][C]0.000405[/C][/ROW]
[ROW][C]4[/C][C]-0.252198[/C][C]-2.7512[/C][C]0.003434[/C][/ROW]
[ROW][C]5[/C][C]-0.282695[/C][C]-3.0838[/C][C]0.00127[/C][/ROW]
[ROW][C]6[/C][C]-0.096166[/C][C]-1.049[/C][C]0.148141[/C][/ROW]
[ROW][C]7[/C][C]-0.057637[/C][C]-0.6287[/C][C]0.26536[/C][/ROW]
[ROW][C]8[/C][C]-0.160803[/C][C]-1.7542[/C][C]0.040989[/C][/ROW]
[ROW][C]9[/C][C]-0.179234[/C][C]-1.9552[/C][C]0.026451[/C][/ROW]
[ROW][C]10[/C][C]-0.109688[/C][C]-1.1966[/C][C]0.11693[/C][/ROW]
[ROW][C]11[/C][C]0.219418[/C][C]2.3936[/C][C]0.009124[/C][/ROW]
[ROW][C]12[/C][C]0.016972[/C][C]0.1851[/C][C]0.426716[/C][/ROW]
[ROW][C]13[/C][C]-0.300653[/C][C]-3.2797[/C][C]0.000682[/C][/ROW]
[ROW][C]14[/C][C]-0.161219[/C][C]-1.7587[/C][C]0.0406[/C][/ROW]
[ROW][C]15[/C][C]0.151661[/C][C]1.6544[/C][C]0.050338[/C][/ROW]
[ROW][C]16[/C][C]0.030427[/C][C]0.3319[/C][C]0.370269[/C][/ROW]
[ROW][C]17[/C][C]-0.079298[/C][C]-0.865[/C][C]0.194378[/C][/ROW]
[ROW][C]18[/C][C]0.080411[/C][C]0.8772[/C][C]0.191077[/C][/ROW]
[ROW][C]19[/C][C]-0.008137[/C][C]-0.0888[/C][C]0.46471[/C][/ROW]
[ROW][C]20[/C][C]-0.172815[/C][C]-1.8852[/C][C]0.030922[/C][/ROW]
[ROW][C]21[/C][C]0.140706[/C][C]1.5349[/C][C]0.063729[/C][/ROW]
[ROW][C]22[/C][C]-0.084235[/C][C]-0.9189[/C][C]0.180005[/C][/ROW]
[ROW][C]23[/C][C]0.050551[/C][C]0.5514[/C][C]0.291182[/C][/ROW]
[ROW][C]24[/C][C]0.053889[/C][C]0.5879[/C][C]0.278871[/C][/ROW]
[ROW][C]25[/C][C]-0.19984[/C][C]-2.18[/C][C]0.015613[/C][/ROW]
[ROW][C]26[/C][C]-0.124267[/C][C]-1.3556[/C][C]0.088898[/C][/ROW]
[ROW][C]27[/C][C]0.023822[/C][C]0.2599[/C][C]0.397708[/C][/ROW]
[ROW][C]28[/C][C]0.014548[/C][C]0.1587[/C][C]0.437086[/C][/ROW]
[ROW][C]29[/C][C]-0.066817[/C][C]-0.7289[/C][C]0.233751[/C][/ROW]
[ROW][C]30[/C][C]0.010257[/C][C]0.1119[/C][C]0.455548[/C][/ROW]
[ROW][C]31[/C][C]-0.026672[/C][C]-0.291[/C][C]0.385795[/C][/ROW]
[ROW][C]32[/C][C]-0.047438[/C][C]-0.5175[/C][C]0.302887[/C][/ROW]
[ROW][C]33[/C][C]0.167516[/C][C]1.8274[/C][C]0.035074[/C][/ROW]
[ROW][C]34[/C][C]-0.027978[/C][C]-0.3052[/C][C]0.380371[/C][/ROW]
[ROW][C]35[/C][C]0.014714[/C][C]0.1605[/C][C]0.436375[/C][/ROW]
[ROW][C]36[/C][C]-0.070139[/C][C]-0.7651[/C][C]0.222854[/C][/ROW]
[ROW][C]37[/C][C]-0.118161[/C][C]-1.289[/C][C]0.099952[/C][/ROW]
[ROW][C]38[/C][C]-0.113225[/C][C]-1.2351[/C][C]0.109606[/C][/ROW]
[ROW][C]39[/C][C]0.116341[/C][C]1.2691[/C][C]0.103436[/C][/ROW]
[ROW][C]40[/C][C]0.006557[/C][C]0.0715[/C][C]0.471549[/C][/ROW]
[ROW][C]41[/C][C]-0.146237[/C][C]-1.5953[/C][C]0.056654[/C][/ROW]
[ROW][C]42[/C][C]-0.04269[/C][C]-0.4657[/C][C]0.321143[/C][/ROW]
[ROW][C]43[/C][C]0.005209[/C][C]0.0568[/C][C]0.47739[/C][/ROW]
[ROW][C]44[/C][C]-0.054262[/C][C]-0.5919[/C][C]0.277512[/C][/ROW]
[ROW][C]45[/C][C]0.055813[/C][C]0.6088[/C][C]0.271894[/C][/ROW]
[ROW][C]46[/C][C]-0.077404[/C][C]-0.8444[/C][C]0.200075[/C][/ROW]
[ROW][C]47[/C][C]0.1212[/C][C]1.3221[/C][C]0.09433[/C][/ROW]
[ROW][C]48[/C][C]-0.016533[/C][C]-0.1804[/C][C]0.428592[/C][/ROW]
[/TABLE]
Source: https://freestatistics.org/blog/index.php?pk=303105&T=2

Globally Unique Identifier (entire table): ba.freestatistics.org/blog/index.php?pk=303105&T=2

As an alternative you can also use a QR Code:  

The GUIDs for individual cells are displayed in the table below:

Partial Autocorrelation Function
Time lag kPACF(k)T-STATP-value
1-0.609963-6.65390
2-0.570066-6.21870
3-0.315118-3.43750.000405
4-0.252198-2.75120.003434
5-0.282695-3.08380.00127
6-0.096166-1.0490.148141
7-0.057637-0.62870.26536
8-0.160803-1.75420.040989
9-0.179234-1.95520.026451
10-0.109688-1.19660.11693
110.2194182.39360.009124
120.0169720.18510.426716
13-0.300653-3.27970.000682
14-0.161219-1.75870.0406
150.1516611.65440.050338
160.0304270.33190.370269
17-0.079298-0.8650.194378
180.0804110.87720.191077
19-0.008137-0.08880.46471
20-0.172815-1.88520.030922
210.1407061.53490.063729
22-0.084235-0.91890.180005
230.0505510.55140.291182
240.0538890.58790.278871
25-0.19984-2.180.015613
26-0.124267-1.35560.088898
270.0238220.25990.397708
280.0145480.15870.437086
29-0.066817-0.72890.233751
300.0102570.11190.455548
31-0.026672-0.2910.385795
32-0.047438-0.51750.302887
330.1675161.82740.035074
34-0.027978-0.30520.380371
350.0147140.16050.436375
36-0.070139-0.76510.222854
37-0.118161-1.2890.099952
38-0.113225-1.23510.109606
390.1163411.26910.103436
400.0065570.07150.471549
41-0.146237-1.59530.056654
42-0.04269-0.46570.321143
430.0052090.05680.47739
44-0.054262-0.59190.277512
450.0558130.60880.271894
46-0.077404-0.84440.200075
470.12121.32210.09433
48-0.016533-0.18040.428592


Parameters (Session):
Parameters (R input):
par1 = 48 ; par2 = 1 ; par3 = 1 ; par4 = 1 ; par5 = 12 ; par6 = White Noise ; par7 = 0.95 ; par8 = ;
R code (references can be found in the software module):
par8 <- ''
par7 <- '0.95'
par6 <- 'White Noise'
par5 <- '12'
par4 <- '0'
par3 <- '1'
par2 <- '1'
par1 <- '48'
if (par1 == 'Default') {
par1 = 10*log10(length(x))
} else {
par1 <- as.numeric(par1)
}
par2 <- as.numeric(par2)
par3 <- as.numeric(par3)
par4 <- as.numeric(par4)
par5 <- as.numeric(par5)
if (par6 == 'White Noise') par6 <- 'white' else par6 <- 'ma'
par7 <- as.numeric(par7)
if (par8 != '') par8 <- as.numeric(par8)
x <- na.omit(x)
ox <- x
if (par8 == '') {
if (par2 == 0) {
x <- log(x)
} else {
x <- (x ^ par2 - 1) / par2
}
} else {
x <- log(x,base=par8)
}
if (par3 > 0) x <- diff(x,lag=1,difference=par3)
if (par4 > 0) x <- diff(x,lag=par5,difference=par4)
bitmap(file='picts.png')
op <- par(mfrow=c(2,1))
plot(ox,type='l',main='Original Time Series',xlab='time',ylab='value')
if (par8=='') {
mytitle <- paste('Working Time Series (lambda=',par2,', d=',par3,', D=',par4,')',sep='')
mysub <- paste('(lambda=',par2,', d=',par3,', D=',par4,', CI=', par7, ', CI type=',par6,')',sep='')
} else {
mytitle <- paste('Working Time Series (base=',par8,', d=',par3,', D=',par4,')',sep='')
mysub <- paste('(base=',par8,', d=',par3,', D=',par4,', CI=', par7, ', CI type=',par6,')',sep='')
}
plot(x,type='l', main=mytitle,xlab='time',ylab='value')
par(op)
dev.off()
bitmap(file='pic1.png')
racf <- acf(x, par1, main='Autocorrelation', xlab='time lag', ylab='ACF', ci.type=par6, ci=par7, sub=mysub)
dev.off()
bitmap(file='pic2.png')
rpacf <- pacf(x,par1,main='Partial Autocorrelation',xlab='lags',ylab='PACF',sub=mysub)
dev.off()
(myacf <- c(racf$acf))
(mypacf <- c(rpacf$acf))
lengthx <- length(x)
sqrtn <- sqrt(lengthx)
load(file='createtable')
a<-table.start()
a<-table.row.start(a)
a<-table.element(a,'Autocorrelation Function',4,TRUE)
a<-table.row.end(a)
a<-table.row.start(a)
a<-table.element(a,'Time lag k',header=TRUE)
a<-table.element(a,'ACF(k)',header=TRUE)
a<-table.element(a,'T-STAT',header=TRUE)
a<-table.element(a,'P-value',header=TRUE)
a<-table.row.end(a)
for (i in 2:(par1+1)) {
a<-table.row.start(a)
a<-table.element(a,i-1,header=TRUE)
a<-table.element(a,round(myacf[i],6))
mytstat <- myacf[i]*sqrtn
a<-table.element(a,round(mytstat,4))
a<-table.element(a,round(1-pt(abs(mytstat),lengthx),6))
a<-table.row.end(a)
}
a<-table.end(a)
table.save(a,file='mytable.tab')
a<-table.start()
a<-table.row.start(a)
a<-table.element(a,'Partial Autocorrelation Function',4,TRUE)
a<-table.row.end(a)
a<-table.row.start(a)
a<-table.element(a,'Time lag k',header=TRUE)
a<-table.element(a,'PACF(k)',header=TRUE)
a<-table.element(a,'T-STAT',header=TRUE)
a<-table.element(a,'P-value',header=TRUE)
a<-table.row.end(a)
for (i in 1:par1) {
a<-table.row.start(a)
a<-table.element(a,i,header=TRUE)
a<-table.element(a,round(mypacf[i],6))
mytstat <- mypacf[i]*sqrtn
a<-table.element(a,round(mytstat,4))
a<-table.element(a,round(1-pt(abs(mytstat),lengthx),6))
a<-table.row.end(a)
}
a<-table.end(a)
table.save(a,file='mytable1.tab')