Free Statistics

of Irreproducible Research!

Author's title

Author*Unverified author*
R Software Modulerwasp_exponentialsmoothing.wasp
Title produced by softwareExponential Smoothing
Date of computationWed, 28 Dec 2016 14:44:39 +0000
Cite this page as followsStatistical Computations at FreeStatistics.org, Office for Research Development and Education, URL https://freestatistics.org/blog/index.php?v=date/2016/Dec/28/t1482936572bt9z93zul5lniad.htm/, Retrieved Sun, 05 May 2024 14:51:32 +0200
Statistical Computations at FreeStatistics.org, Office for Research Development and Education, URL https://freestatistics.org/blog/index.php?pk=, Retrieved Sun, 05 May 2024 14:51:32 +0200
QR Codes:

Original text written by user:
IsPrivate?No (this computation is public)
User-defined keywords
Estimated Impact0
Dataseries X:
12347
12624
11918
10028
10228
11026
13878
22165
23533
13445
12164
9606
12177
13142
11210
9485
10082
10680
13579
21709
22205
14687
11222
8196
12794
12627
11080
10425
10865
10771
14771
20993
23882
14825
11648
10091
14976
14472
12254
12257
10767
12275
14845
21939
26740
16974
12956
12494
16024
15306
13989
12792
10697
14257
17251
25795
29016
18968
16009
14511


Summary of computational transaction
Raw Inputview raw input (R code)
Raw Outputview raw output of R engine
Computing time2 seconds
R Server'Gwilym Jenkins' @ jenkins.wessa.net

\begin{tabular}{lllllllll}
\hline
Summary of computational transaction \tabularnewline
Raw Input & view raw input (R code)  \tabularnewline
Raw Output & view raw output of R engine  \tabularnewline
Computing time & 2 seconds \tabularnewline
R Server & 'Gwilym Jenkins' @ jenkins.wessa.net \tabularnewline
\hline
\end{tabular}
%Source: https://freestatistics.org/blog/index.php?pk=&T=0

[TABLE]
[ROW][C]Summary of computational transaction[/C][/ROW]
[ROW][C]Raw Input[/C][C]view raw input (R code) [/C][/ROW]
[ROW][C]Raw Output[/C][C]view raw output of R engine [/C][/ROW]
[ROW][C]Computing time[/C][C]2 seconds[/C][/ROW]
[ROW][C]R Server[/C][C]'Gwilym Jenkins' @ jenkins.wessa.net[/C][/ROW]
[/TABLE]
Source: https://freestatistics.org/blog/index.php?pk=&T=0

Globally Unique Identifier (entire table): ba.freestatistics.org/blog/index.php?pk=&T=0

As an alternative you can also use a QR Code:  

The GUIDs for individual cells are displayed in the table below:

Summary of computational transaction
Raw Inputview raw input (R code)
Raw Outputview raw output of R engine
Computing time2 seconds
R Server'Gwilym Jenkins' @ jenkins.wessa.net


Estimated Parameters of Exponential Smoothing
ParameterValue
alpha0.155012192424745
beta0.153630708322919
gamma1

\begin{tabular}{lllllllll}
\hline
Estimated Parameters of Exponential Smoothing \tabularnewline
Parameter & Value \tabularnewline
alpha & 0.155012192424745 \tabularnewline
beta & 0.153630708322919 \tabularnewline
gamma & 1 \tabularnewline
\hline
\end{tabular}
%Source: https://freestatistics.org/blog/index.php?pk=&T=1

[TABLE]
[ROW][C]Estimated Parameters of Exponential Smoothing[/C][/ROW]
[ROW][C]Parameter[/C][C]Value[/C][/ROW]
[ROW][C]alpha[/C][C]0.155012192424745[/C][/ROW]
[ROW][C]beta[/C][C]0.153630708322919[/C][/ROW]
[ROW][C]gamma[/C][C]1[/C][/ROW]
[/TABLE]
Source: https://freestatistics.org/blog/index.php?pk=&T=1

Globally Unique Identifier (entire table): ba.freestatistics.org/blog/index.php?pk=&T=1

As an alternative you can also use a QR Code:  

The GUIDs for individual cells are displayed in the table below:

Estimated Parameters of Exponential Smoothing
ParameterValue
alpha0.155012192424745
beta0.153630708322919
gamma1


Interpolation Forecasts of Exponential Smoothing
tObservedFittedResiduals
131217712333.1820328825-156.182032882496
141314213282.7130206558-140.713020655765
151121011343.366218481-133.366218480951
1694859553.95081941742-68.9508194174214
171008210101.9225339377-19.9225339377226
181068010741.7153623161-61.7153623160721
191357913574.03266318814.9673368119129
202170921583.5528527342125.447147265771
212220522874.1763750806-669.176375080569
221468713007.01623114291679.98376885707
231122212017.6037855129-795.60378551286
2481969383.37914751115-1187.37914751115
251279411493.92613883651300.0738611635
261262712636.8252791865-9.82527918649066
271108010794.696160151285.30383984905
28104259187.436303065981237.56369693402
291086510013.0524941759851.947505824122
301077110822.0863128054-51.0863128054425
311477113833.1743193666937.825680633439
322099322499.7308629695-1506.73086296949
332388223015.5945583558866.405441644194
341482515125.3828610224-300.382861022388
351164811687.5185685925-39.5185685925426
36100918750.383501428691340.61649857131
371497613910.60238080471065.39761919533
381447214048.5262284505423.473771549543
391225412479.7939906961-225.793990696142
401225711591.8979901312665.102009868768
411076712134.0851126875-1367.08511268753
421227511875.132703378399.867296622026
431484516278.41155958-1433.41155958
442193923086.8828932595-1147.88289325948
452674025952.2982711598787.701728840158
461697416259.1218647797714.87813522027
471295612905.688521894450.311478105592
481249410960.85158074581533.14841925421
491602416467.8066236777-443.806623677719
501530615777.6429690972-471.642969097158
511398913320.6546959872668.345304012821
521279213315.3024414566-523.302441456637
531069711811.9475997582-1114.94759975817
541425713183.48100280171073.51899719835
551725116365.3069086462885.693091353804
562579524652.80845300581142.19154699415
572901630277.6655199666-1261.66551996661
581896819032.0915899524-64.0915899523607
591600914544.6196576511464.38034234898
601451114004.5555593675506.444440632471

\begin{tabular}{lllllllll}
\hline
Interpolation Forecasts of Exponential Smoothing \tabularnewline
t & Observed & Fitted & Residuals \tabularnewline
13 & 12177 & 12333.1820328825 & -156.182032882496 \tabularnewline
14 & 13142 & 13282.7130206558 & -140.713020655765 \tabularnewline
15 & 11210 & 11343.366218481 & -133.366218480951 \tabularnewline
16 & 9485 & 9553.95081941742 & -68.9508194174214 \tabularnewline
17 & 10082 & 10101.9225339377 & -19.9225339377226 \tabularnewline
18 & 10680 & 10741.7153623161 & -61.7153623160721 \tabularnewline
19 & 13579 & 13574.0326631881 & 4.9673368119129 \tabularnewline
20 & 21709 & 21583.5528527342 & 125.447147265771 \tabularnewline
21 & 22205 & 22874.1763750806 & -669.176375080569 \tabularnewline
22 & 14687 & 13007.0162311429 & 1679.98376885707 \tabularnewline
23 & 11222 & 12017.6037855129 & -795.60378551286 \tabularnewline
24 & 8196 & 9383.37914751115 & -1187.37914751115 \tabularnewline
25 & 12794 & 11493.9261388365 & 1300.0738611635 \tabularnewline
26 & 12627 & 12636.8252791865 & -9.82527918649066 \tabularnewline
27 & 11080 & 10794.696160151 & 285.30383984905 \tabularnewline
28 & 10425 & 9187.43630306598 & 1237.56369693402 \tabularnewline
29 & 10865 & 10013.0524941759 & 851.947505824122 \tabularnewline
30 & 10771 & 10822.0863128054 & -51.0863128054425 \tabularnewline
31 & 14771 & 13833.1743193666 & 937.825680633439 \tabularnewline
32 & 20993 & 22499.7308629695 & -1506.73086296949 \tabularnewline
33 & 23882 & 23015.5945583558 & 866.405441644194 \tabularnewline
34 & 14825 & 15125.3828610224 & -300.382861022388 \tabularnewline
35 & 11648 & 11687.5185685925 & -39.5185685925426 \tabularnewline
36 & 10091 & 8750.38350142869 & 1340.61649857131 \tabularnewline
37 & 14976 & 13910.6023808047 & 1065.39761919533 \tabularnewline
38 & 14472 & 14048.5262284505 & 423.473771549543 \tabularnewline
39 & 12254 & 12479.7939906961 & -225.793990696142 \tabularnewline
40 & 12257 & 11591.8979901312 & 665.102009868768 \tabularnewline
41 & 10767 & 12134.0851126875 & -1367.08511268753 \tabularnewline
42 & 12275 & 11875.132703378 & 399.867296622026 \tabularnewline
43 & 14845 & 16278.41155958 & -1433.41155958 \tabularnewline
44 & 21939 & 23086.8828932595 & -1147.88289325948 \tabularnewline
45 & 26740 & 25952.2982711598 & 787.701728840158 \tabularnewline
46 & 16974 & 16259.1218647797 & 714.87813522027 \tabularnewline
47 & 12956 & 12905.6885218944 & 50.311478105592 \tabularnewline
48 & 12494 & 10960.8515807458 & 1533.14841925421 \tabularnewline
49 & 16024 & 16467.8066236777 & -443.806623677719 \tabularnewline
50 & 15306 & 15777.6429690972 & -471.642969097158 \tabularnewline
51 & 13989 & 13320.6546959872 & 668.345304012821 \tabularnewline
52 & 12792 & 13315.3024414566 & -523.302441456637 \tabularnewline
53 & 10697 & 11811.9475997582 & -1114.94759975817 \tabularnewline
54 & 14257 & 13183.4810028017 & 1073.51899719835 \tabularnewline
55 & 17251 & 16365.3069086462 & 885.693091353804 \tabularnewline
56 & 25795 & 24652.8084530058 & 1142.19154699415 \tabularnewline
57 & 29016 & 30277.6655199666 & -1261.66551996661 \tabularnewline
58 & 18968 & 19032.0915899524 & -64.0915899523607 \tabularnewline
59 & 16009 & 14544.619657651 & 1464.38034234898 \tabularnewline
60 & 14511 & 14004.5555593675 & 506.444440632471 \tabularnewline
\hline
\end{tabular}
%Source: https://freestatistics.org/blog/index.php?pk=&T=2

[TABLE]
[ROW][C]Interpolation Forecasts of Exponential Smoothing[/C][/ROW]
[ROW][C]t[/C][C]Observed[/C][C]Fitted[/C][C]Residuals[/C][/ROW]
[ROW][C]13[/C][C]12177[/C][C]12333.1820328825[/C][C]-156.182032882496[/C][/ROW]
[ROW][C]14[/C][C]13142[/C][C]13282.7130206558[/C][C]-140.713020655765[/C][/ROW]
[ROW][C]15[/C][C]11210[/C][C]11343.366218481[/C][C]-133.366218480951[/C][/ROW]
[ROW][C]16[/C][C]9485[/C][C]9553.95081941742[/C][C]-68.9508194174214[/C][/ROW]
[ROW][C]17[/C][C]10082[/C][C]10101.9225339377[/C][C]-19.9225339377226[/C][/ROW]
[ROW][C]18[/C][C]10680[/C][C]10741.7153623161[/C][C]-61.7153623160721[/C][/ROW]
[ROW][C]19[/C][C]13579[/C][C]13574.0326631881[/C][C]4.9673368119129[/C][/ROW]
[ROW][C]20[/C][C]21709[/C][C]21583.5528527342[/C][C]125.447147265771[/C][/ROW]
[ROW][C]21[/C][C]22205[/C][C]22874.1763750806[/C][C]-669.176375080569[/C][/ROW]
[ROW][C]22[/C][C]14687[/C][C]13007.0162311429[/C][C]1679.98376885707[/C][/ROW]
[ROW][C]23[/C][C]11222[/C][C]12017.6037855129[/C][C]-795.60378551286[/C][/ROW]
[ROW][C]24[/C][C]8196[/C][C]9383.37914751115[/C][C]-1187.37914751115[/C][/ROW]
[ROW][C]25[/C][C]12794[/C][C]11493.9261388365[/C][C]1300.0738611635[/C][/ROW]
[ROW][C]26[/C][C]12627[/C][C]12636.8252791865[/C][C]-9.82527918649066[/C][/ROW]
[ROW][C]27[/C][C]11080[/C][C]10794.696160151[/C][C]285.30383984905[/C][/ROW]
[ROW][C]28[/C][C]10425[/C][C]9187.43630306598[/C][C]1237.56369693402[/C][/ROW]
[ROW][C]29[/C][C]10865[/C][C]10013.0524941759[/C][C]851.947505824122[/C][/ROW]
[ROW][C]30[/C][C]10771[/C][C]10822.0863128054[/C][C]-51.0863128054425[/C][/ROW]
[ROW][C]31[/C][C]14771[/C][C]13833.1743193666[/C][C]937.825680633439[/C][/ROW]
[ROW][C]32[/C][C]20993[/C][C]22499.7308629695[/C][C]-1506.73086296949[/C][/ROW]
[ROW][C]33[/C][C]23882[/C][C]23015.5945583558[/C][C]866.405441644194[/C][/ROW]
[ROW][C]34[/C][C]14825[/C][C]15125.3828610224[/C][C]-300.382861022388[/C][/ROW]
[ROW][C]35[/C][C]11648[/C][C]11687.5185685925[/C][C]-39.5185685925426[/C][/ROW]
[ROW][C]36[/C][C]10091[/C][C]8750.38350142869[/C][C]1340.61649857131[/C][/ROW]
[ROW][C]37[/C][C]14976[/C][C]13910.6023808047[/C][C]1065.39761919533[/C][/ROW]
[ROW][C]38[/C][C]14472[/C][C]14048.5262284505[/C][C]423.473771549543[/C][/ROW]
[ROW][C]39[/C][C]12254[/C][C]12479.7939906961[/C][C]-225.793990696142[/C][/ROW]
[ROW][C]40[/C][C]12257[/C][C]11591.8979901312[/C][C]665.102009868768[/C][/ROW]
[ROW][C]41[/C][C]10767[/C][C]12134.0851126875[/C][C]-1367.08511268753[/C][/ROW]
[ROW][C]42[/C][C]12275[/C][C]11875.132703378[/C][C]399.867296622026[/C][/ROW]
[ROW][C]43[/C][C]14845[/C][C]16278.41155958[/C][C]-1433.41155958[/C][/ROW]
[ROW][C]44[/C][C]21939[/C][C]23086.8828932595[/C][C]-1147.88289325948[/C][/ROW]
[ROW][C]45[/C][C]26740[/C][C]25952.2982711598[/C][C]787.701728840158[/C][/ROW]
[ROW][C]46[/C][C]16974[/C][C]16259.1218647797[/C][C]714.87813522027[/C][/ROW]
[ROW][C]47[/C][C]12956[/C][C]12905.6885218944[/C][C]50.311478105592[/C][/ROW]
[ROW][C]48[/C][C]12494[/C][C]10960.8515807458[/C][C]1533.14841925421[/C][/ROW]
[ROW][C]49[/C][C]16024[/C][C]16467.8066236777[/C][C]-443.806623677719[/C][/ROW]
[ROW][C]50[/C][C]15306[/C][C]15777.6429690972[/C][C]-471.642969097158[/C][/ROW]
[ROW][C]51[/C][C]13989[/C][C]13320.6546959872[/C][C]668.345304012821[/C][/ROW]
[ROW][C]52[/C][C]12792[/C][C]13315.3024414566[/C][C]-523.302441456637[/C][/ROW]
[ROW][C]53[/C][C]10697[/C][C]11811.9475997582[/C][C]-1114.94759975817[/C][/ROW]
[ROW][C]54[/C][C]14257[/C][C]13183.4810028017[/C][C]1073.51899719835[/C][/ROW]
[ROW][C]55[/C][C]17251[/C][C]16365.3069086462[/C][C]885.693091353804[/C][/ROW]
[ROW][C]56[/C][C]25795[/C][C]24652.8084530058[/C][C]1142.19154699415[/C][/ROW]
[ROW][C]57[/C][C]29016[/C][C]30277.6655199666[/C][C]-1261.66551996661[/C][/ROW]
[ROW][C]58[/C][C]18968[/C][C]19032.0915899524[/C][C]-64.0915899523607[/C][/ROW]
[ROW][C]59[/C][C]16009[/C][C]14544.619657651[/C][C]1464.38034234898[/C][/ROW]
[ROW][C]60[/C][C]14511[/C][C]14004.5555593675[/C][C]506.444440632471[/C][/ROW]
[/TABLE]
Source: https://freestatistics.org/blog/index.php?pk=&T=2

Globally Unique Identifier (entire table): ba.freestatistics.org/blog/index.php?pk=&T=2

As an alternative you can also use a QR Code:  

The GUIDs for individual cells are displayed in the table below:

Interpolation Forecasts of Exponential Smoothing
tObservedFittedResiduals
131217712333.1820328825-156.182032882496
141314213282.7130206558-140.713020655765
151121011343.366218481-133.366218480951
1694859553.95081941742-68.9508194174214
171008210101.9225339377-19.9225339377226
181068010741.7153623161-61.7153623160721
191357913574.03266318814.9673368119129
202170921583.5528527342125.447147265771
212220522874.1763750806-669.176375080569
221468713007.01623114291679.98376885707
231122212017.6037855129-795.60378551286
2481969383.37914751115-1187.37914751115
251279411493.92613883651300.0738611635
261262712636.8252791865-9.82527918649066
271108010794.696160151285.30383984905
28104259187.436303065981237.56369693402
291086510013.0524941759851.947505824122
301077110822.0863128054-51.0863128054425
311477113833.1743193666937.825680633439
322099322499.7308629695-1506.73086296949
332388223015.5945583558866.405441644194
341482515125.3828610224-300.382861022388
351164811687.5185685925-39.5185685925426
36100918750.383501428691340.61649857131
371497613910.60238080471065.39761919533
381447214048.5262284505423.473771549543
391225412479.7939906961-225.793990696142
401225711591.8979901312665.102009868768
411076712134.0851126875-1367.08511268753
421227511875.132703378399.867296622026
431484516278.41155958-1433.41155958
442193923086.8828932595-1147.88289325948
452674025952.2982711598787.701728840158
461697416259.1218647797714.87813522027
471295612905.688521894450.311478105592
481249410960.85158074581533.14841925421
491602416467.8066236777-443.806623677719
501530615777.6429690972-471.642969097158
511398913320.6546959872668.345304012821
521279213315.3024414566-523.302441456637
531069711811.9475997582-1114.94759975817
541425713183.48100280171073.51899719835
551725116365.3069086462885.693091353804
562579524652.80845300581142.19154699415
572901630277.6655199666-1261.66551996661
581896819032.0915899524-64.0915899523607
591600914544.6196576511464.38034234898
601451114004.5555593675506.444440632471


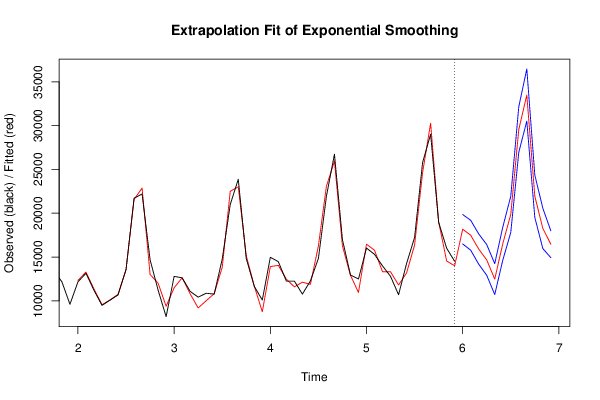
Extrapolation Forecasts of Exponential Smoothing
tForecast95% Lower Bound95% Upper Bound
6118174.914513991116494.044422088419855.7846058939
6217486.849763682715781.814492967519191.8850343979
6315910.102441535714182.789817810617637.4150652608
6414667.926142789412916.622298353316419.2299872256
6512483.877526358610722.164883768314245.590168949
6616513.374567261414624.006485383718402.7426491391
6719876.065959136917814.678820819721937.4530974541
6829561.913947719526962.077099203432161.7507962355
6933494.807261673230518.548571886736471.0659514598
7021943.912736703319523.074211117624364.751262289
7118267.381498167715966.401629837120568.3613664984
7216457.060529996214924.764048525817989.3570114666

\begin{tabular}{lllllllll}
\hline
Extrapolation Forecasts of Exponential Smoothing \tabularnewline
t & Forecast & 95% Lower Bound & 95% Upper Bound \tabularnewline
61 & 18174.9145139911 & 16494.0444220884 & 19855.7846058939 \tabularnewline
62 & 17486.8497636827 & 15781.8144929675 & 19191.8850343979 \tabularnewline
63 & 15910.1024415357 & 14182.7898178106 & 17637.4150652608 \tabularnewline
64 & 14667.9261427894 & 12916.6222983533 & 16419.2299872256 \tabularnewline
65 & 12483.8775263586 & 10722.1648837683 & 14245.590168949 \tabularnewline
66 & 16513.3745672614 & 14624.0064853837 & 18402.7426491391 \tabularnewline
67 & 19876.0659591369 & 17814.6788208197 & 21937.4530974541 \tabularnewline
68 & 29561.9139477195 & 26962.0770992034 & 32161.7507962355 \tabularnewline
69 & 33494.8072616732 & 30518.5485718867 & 36471.0659514598 \tabularnewline
70 & 21943.9127367033 & 19523.0742111176 & 24364.751262289 \tabularnewline
71 & 18267.3814981677 & 15966.4016298371 & 20568.3613664984 \tabularnewline
72 & 16457.0605299962 & 14924.7640485258 & 17989.3570114666 \tabularnewline
\hline
\end{tabular}
%Source: https://freestatistics.org/blog/index.php?pk=&T=3

[TABLE]
[ROW][C]Extrapolation Forecasts of Exponential Smoothing[/C][/ROW]
[ROW][C]t[/C][C]Forecast[/C][C]95% Lower Bound[/C][C]95% Upper Bound[/C][/ROW]
[ROW][C]61[/C][C]18174.9145139911[/C][C]16494.0444220884[/C][C]19855.7846058939[/C][/ROW]
[ROW][C]62[/C][C]17486.8497636827[/C][C]15781.8144929675[/C][C]19191.8850343979[/C][/ROW]
[ROW][C]63[/C][C]15910.1024415357[/C][C]14182.7898178106[/C][C]17637.4150652608[/C][/ROW]
[ROW][C]64[/C][C]14667.9261427894[/C][C]12916.6222983533[/C][C]16419.2299872256[/C][/ROW]
[ROW][C]65[/C][C]12483.8775263586[/C][C]10722.1648837683[/C][C]14245.590168949[/C][/ROW]
[ROW][C]66[/C][C]16513.3745672614[/C][C]14624.0064853837[/C][C]18402.7426491391[/C][/ROW]
[ROW][C]67[/C][C]19876.0659591369[/C][C]17814.6788208197[/C][C]21937.4530974541[/C][/ROW]
[ROW][C]68[/C][C]29561.9139477195[/C][C]26962.0770992034[/C][C]32161.7507962355[/C][/ROW]
[ROW][C]69[/C][C]33494.8072616732[/C][C]30518.5485718867[/C][C]36471.0659514598[/C][/ROW]
[ROW][C]70[/C][C]21943.9127367033[/C][C]19523.0742111176[/C][C]24364.751262289[/C][/ROW]
[ROW][C]71[/C][C]18267.3814981677[/C][C]15966.4016298371[/C][C]20568.3613664984[/C][/ROW]
[ROW][C]72[/C][C]16457.0605299962[/C][C]14924.7640485258[/C][C]17989.3570114666[/C][/ROW]
[/TABLE]
Source: https://freestatistics.org/blog/index.php?pk=&T=3

Globally Unique Identifier (entire table): ba.freestatistics.org/blog/index.php?pk=&T=3

As an alternative you can also use a QR Code:  

The GUIDs for individual cells are displayed in the table below:

Extrapolation Forecasts of Exponential Smoothing
tForecast95% Lower Bound95% Upper Bound
6118174.914513991116494.044422088419855.7846058939
6217486.849763682715781.814492967519191.8850343979
6315910.102441535714182.789817810617637.4150652608
6414667.926142789412916.622298353316419.2299872256
6512483.877526358610722.164883768314245.590168949
6616513.374567261414624.006485383718402.7426491391
6719876.065959136917814.678820819721937.4530974541
6829561.913947719526962.077099203432161.7507962355
6933494.807261673230518.548571886736471.0659514598
7021943.912736703319523.074211117624364.751262289
7118267.381498167715966.401629837120568.3613664984
7216457.060529996214924.764048525817989.3570114666


Parameters (Session):
par1 = 12 ; par2 = Triple ; par3 = multiplicative ;
Parameters (R input):
par1 = 12 ; par2 = Triple ; par3 = multiplicative ;
R code (references can be found in the software module):
par1 <- as.numeric(par1)
if (par2 == 'Single') K <- 1
if (par2 == 'Double') K <- 2
if (par2 == 'Triple') K <- par1
nx <- length(x)
nxmK <- nx - K
x <- ts(x, frequency = par1)
if (par2 == 'Single') fit <- HoltWinters(x, gamma=F, beta=F)
if (par2 == 'Double') fit <- HoltWinters(x, gamma=F)
if (par2 == 'Triple') fit <- HoltWinters(x, seasonal=par3)
fit
myresid <- x - fit$fitted[,'xhat']
bitmap(file='test1.png')
op <- par(mfrow=c(2,1))
plot(fit,ylab='Observed (black) / Fitted (red)',main='Interpolation Fit of Exponential Smoothing')
plot(myresid,ylab='Residuals',main='Interpolation Prediction Errors')
par(op)
dev.off()
bitmap(file='test2.png')
p <- predict(fit, par1, prediction.interval=TRUE)
np <- length(p[,1])
plot(fit,p,ylab='Observed (black) / Fitted (red)',main='Extrapolation Fit of Exponential Smoothing')
dev.off()
bitmap(file='test3.png')
op <- par(mfrow = c(2,2))
acf(as.numeric(myresid),lag.max = nx/2,main='Residual ACF')
spectrum(myresid,main='Residals Periodogram')
cpgram(myresid,main='Residal Cumulative Periodogram')
qqnorm(myresid,main='Residual Normal QQ Plot')
qqline(myresid)
par(op)
dev.off()
load(file='createtable')
a<-table.start()
a<-table.row.start(a)
a<-table.element(a,'Estimated Parameters of Exponential Smoothing',2,TRUE)
a<-table.row.end(a)
a<-table.row.start(a)
a<-table.element(a,'Parameter',header=TRUE)
a<-table.element(a,'Value',header=TRUE)
a<-table.row.end(a)
a<-table.row.start(a)
a<-table.element(a,'alpha',header=TRUE)
a<-table.element(a,fit$alpha)
a<-table.row.end(a)
a<-table.row.start(a)
a<-table.element(a,'beta',header=TRUE)
a<-table.element(a,fit$beta)
a<-table.row.end(a)
a<-table.row.start(a)
a<-table.element(a,'gamma',header=TRUE)
a<-table.element(a,fit$gamma)
a<-table.row.end(a)
a<-table.end(a)
table.save(a,file='mytable.tab')
a<-table.start()
a<-table.row.start(a)
a<-table.element(a,'Interpolation Forecasts of Exponential Smoothing',4,TRUE)
a<-table.row.end(a)
a<-table.row.start(a)
a<-table.element(a,'t',header=TRUE)
a<-table.element(a,'Observed',header=TRUE)
a<-table.element(a,'Fitted',header=TRUE)
a<-table.element(a,'Residuals',header=TRUE)
a<-table.row.end(a)
for (i in 1:nxmK) {
a<-table.row.start(a)
a<-table.element(a,i+K,header=TRUE)
a<-table.element(a,x[i+K])
a<-table.element(a,fit$fitted[i,'xhat'])
a<-table.element(a,myresid[i])
a<-table.row.end(a)
}
a<-table.end(a)
table.save(a,file='mytable1.tab')
a<-table.start()
a<-table.row.start(a)
a<-table.element(a,'Extrapolation Forecasts of Exponential Smoothing',4,TRUE)
a<-table.row.end(a)
a<-table.row.start(a)
a<-table.element(a,'t',header=TRUE)
a<-table.element(a,'Forecast',header=TRUE)
a<-table.element(a,'95% Lower Bound',header=TRUE)
a<-table.element(a,'95% Upper Bound',header=TRUE)
a<-table.row.end(a)
for (i in 1:np) {
a<-table.row.start(a)
a<-table.element(a,nx+i,header=TRUE)
a<-table.element(a,p[i,'fit'])
a<-table.element(a,p[i,'lwr'])
a<-table.element(a,p[i,'upr'])
a<-table.row.end(a)
}
a<-table.end(a)
table.save(a,file='mytable2.tab')