Free Statistics

of Irreproducible Research!

Author's title

Author*Unverified author*
R Software Modulerwasp_univariatedataseries.wasp
Title produced by softwareUnivariate Data Series
Date of computationThu, 04 Feb 2016 13:35:34 +0000
Cite this page as followsStatistical Computations at FreeStatistics.org, Office for Research Development and Education, URL https://freestatistics.org/blog/index.php?v=date/2016/Feb/04/t1454593618edwoqr9z2tp3idw.htm/, Retrieved Mon, 29 Apr 2024 23:58:22 +0000
Statistical Computations at FreeStatistics.org, Office for Research Development and Education, URL https://freestatistics.org/blog/index.php?pk=291851, Retrieved Mon, 29 Apr 2024 23:58:22 +0000
QR Codes:

Original text written by user:
IsPrivate?No (this computation is public)
User-defined keywords
Estimated Impact146
Family? (F = Feedback message, R = changed R code, M = changed R Module, P = changed Parameters, D = changed Data)
-       [Univariate Data Series] [] [2016-02-04 13:35:34] [d41d8cd98f00b204e9800998ecf8427e] [Current]
- RMP     [Histogram] [] [2016-02-19 09:17:19] [0de32314d7b3b08395095f6c5b967281]
- RMP     [Kernel Density Estimation] [] [2016-02-19 09:22:29] [0de32314d7b3b08395095f6c5b967281]
Feedback Forum

Post a new message
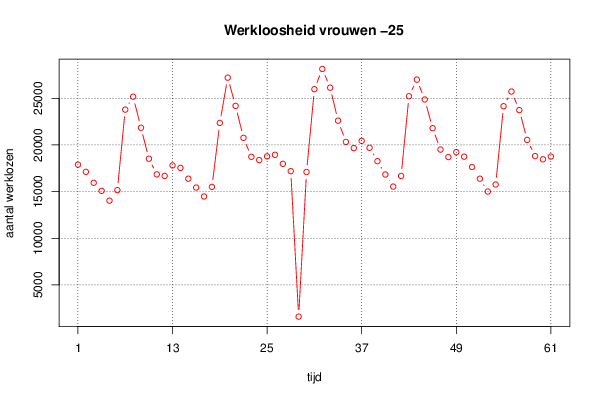
Dataseries X:
17887
17118
15945
15085
14027
15158
23783
25166
21839
18522
16850
16679
17806
17542
16380
15434
14478
15506
22357
27204
24182
20760
18731
18377
18775
18943
17974
17192
1604
17101
25972
28139
26131
22600
20320
19662
20440
19694
18260
16832
15539
16676
25216
26994
24865
21793
19505
18696
19221
18742
17633
16379
15007
15762
24146
25720
23731
20542
18807
18459
18754


Summary of computational transaction
Raw Inputview raw input (R code)
Raw Outputview raw output of R engine
Computing time1 seconds
R Server'Gwilym Jenkins' @ jenkins.wessa.net

\begin{tabular}{lllllllll}
\hline
Summary of computational transaction \tabularnewline
Raw Input & view raw input (R code)  \tabularnewline
Raw Output & view raw output of R engine  \tabularnewline
Computing time & 1 seconds \tabularnewline
R Server & 'Gwilym Jenkins' @ jenkins.wessa.net \tabularnewline
\hline
\end{tabular}
%Source: https://freestatistics.org/blog/index.php?pk=291851&T=0

[TABLE]
[ROW][C]Summary of computational transaction[/C][/ROW]
[ROW][C]Raw Input[/C][C]view raw input (R code) [/C][/ROW]
[ROW][C]Raw Output[/C][C]view raw output of R engine [/C][/ROW]
[ROW][C]Computing time[/C][C]1 seconds[/C][/ROW]
[ROW][C]R Server[/C][C]'Gwilym Jenkins' @ jenkins.wessa.net[/C][/ROW]
[/TABLE]
Source: https://freestatistics.org/blog/index.php?pk=291851&T=0

Globally Unique Identifier (entire table): ba.freestatistics.org/blog/index.php?pk=291851&T=0

As an alternative you can also use a QR Code:  

The GUIDs for individual cells are displayed in the table below:

Summary of computational transaction
Raw Inputview raw input (R code)
Raw Outputview raw output of R engine
Computing time1 seconds
R Server'Gwilym Jenkins' @ jenkins.wessa.net


Univariate Dataseries
Name of dataseriesWerkloosheid
SourceNBB
DescriptionWerkloosheid vrouwen -25j
Number of observations61

\begin{tabular}{lllllllll}
\hline
Univariate Dataseries \tabularnewline
Name of dataseries & Werkloosheid  \tabularnewline
Source & NBB \tabularnewline
Description & Werkloosheid vrouwen -25j \tabularnewline
Number of observations & 61 \tabularnewline
\hline
\end{tabular}
%Source: https://freestatistics.org/blog/index.php?pk=291851&T=1

[TABLE]
[ROW][C]Univariate Dataseries[/C][/ROW]
[ROW][C]Name of dataseries[/C][C]Werkloosheid [/C][/ROW]
[ROW][C]Source[/C][C]NBB[/C][/ROW]
[ROW][C]Description[/C][C]Werkloosheid vrouwen -25j[/C][/ROW]
[ROW][C]Number of observations[/C][C]61[/C][/ROW]
[/TABLE]
Source: https://freestatistics.org/blog/index.php?pk=291851&T=1

Globally Unique Identifier (entire table): ba.freestatistics.org/blog/index.php?pk=291851&T=1

As an alternative you can also use a QR Code:  

The GUIDs for individual cells are displayed in the table below:

Univariate Dataseries
Name of dataseriesWerkloosheid
SourceNBB
DescriptionWerkloosheid vrouwen -25j
Number of observations61


Parameters (Session):
par1 = Werkloosheid ; par2 = NBB ; par3 = Werkloosheid vrouwen -25j ; par4 = 12 ;
Parameters (R input):
par1 = Werkloosheid ; par2 = NBB ; par3 = Werkloosheid vrouwen -25j ; par4 = 12 ;
R code (references can be found in the software module):
if (par4 != 'No season') {
par4 <- as.numeric(par4)
if (par4 < 4) par4 <- 12
}
summary(x)
n <- length(x)
bitmap(file='test1.png')
if (par4=='No season') {
plot(x,col=2,type='b',main=main,xlab=xlab,ylab=ylab,xaxt='n')
axis(1,at=seq(1,n,10))
}
if (par4!='No season') {
plot(x,col=2,type='b',main=main,xlab=xlab,ylab=ylab,xaxt='n')
axis(1,at=seq(1,n,par4))
grid(nx=0,ny=NULL,col='black')
abline(v=seq(1,n,par4),col='black',lty='dotted')
}
dev.off()
load(file='createtable')
a<-table.start()
a<-table.row.start(a)
a<-table.element(a,'Univariate Dataseries',2,TRUE)
a<-table.row.end(a)
a<-table.row.start(a)
a<-table.element(a,'Name of dataseries',header=TRUE)
a<-table.element(a,par1)
a<-table.row.end(a)
a<-table.row.start(a)
a<-table.element(a,'Source',header=TRUE)
a<-table.element(a,par2)
a<-table.row.end(a)
a<-table.row.start(a)
a<-table.element(a,'Description',header=TRUE)
a<-table.element(a,par3)
a<-table.row.end(a)
a<-table.row.start(a)
a<-table.element(a,'Number of observations',header=TRUE)
a<-table.element(a,length(x))
a<-table.row.end(a)
a<-table.end(a)
table.save(a,file='mytable.tab')