Free Statistics
of Irreproducible Research!
Description of Statistical Computation | |||||||||||||||||||||||||||||||||||||||||
|---|---|---|---|---|---|---|---|---|---|---|---|---|---|---|---|---|---|---|---|---|---|---|---|---|---|---|---|---|---|---|---|---|---|---|---|---|---|---|---|---|---|
| Author's title | |||||||||||||||||||||||||||||||||||||||||
| Author | *Unverified author* | ||||||||||||||||||||||||||||||||||||||||
| R Software Module | rwasp_univariatedataseries.wasp | ||||||||||||||||||||||||||||||||||||||||
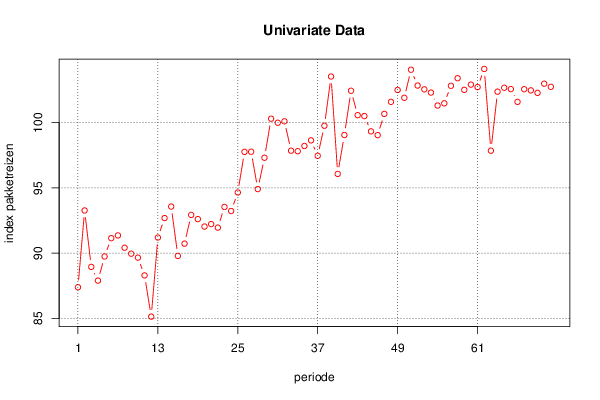
| Title produced by software | Univariate Data Series | ||||||||||||||||||||||||||||||||||||||||
| Date of computation | Thu, 04 Feb 2016 17:01:50 +0000 | ||||||||||||||||||||||||||||||||||||||||
| Cite this page as follows | Statistical Computations at FreeStatistics.org, Office for Research Development and Education, URL https://freestatistics.org/blog/index.php?v=date/2016/Feb/04/t1454605476xiwy1szts9jfchz.htm/, Retrieved Mon, 29 Apr 2024 17:43:50 +0000 | ||||||||||||||||||||||||||||||||||||||||
| Statistical Computations at FreeStatistics.org, Office for Research Development and Education, URL https://freestatistics.org/blog/index.php?pk=291860, Retrieved Mon, 29 Apr 2024 17:43:50 +0000 | |||||||||||||||||||||||||||||||||||||||||
| QR Codes: | |||||||||||||||||||||||||||||||||||||||||
|
| |||||||||||||||||||||||||||||||||||||||||
| Original text written by user: | |||||||||||||||||||||||||||||||||||||||||
| IsPrivate? | No (this computation is public) | ||||||||||||||||||||||||||||||||||||||||
| User-defined keywords | |||||||||||||||||||||||||||||||||||||||||
| Estimated Impact | 160 | ||||||||||||||||||||||||||||||||||||||||
Tree of Dependent Computations | |||||||||||||||||||||||||||||||||||||||||
| Family? (F = Feedback message, R = changed R code, M = changed R Module, P = changed Parameters, D = changed Data) | |||||||||||||||||||||||||||||||||||||||||
| - [Univariate Data Series] [] [2016-02-04 17:01:50] [e5ae4b5dd737e4828f1ae85ef60fb5e4] [Current] - RMP [Histogram] [] [2016-02-19 15:00:19] [0bd5197a1c154a97fbf526752c6b129d] - RMP [Histogram] [] [2016-02-19 15:03:53] [0bd5197a1c154a97fbf526752c6b129d] - RMP [Histogram] [] [2016-02-19 15:38:48] [0bd5197a1c154a97fbf526752c6b129d] - RMP [Kernel Density Estimation] [] [2016-02-19 15:49:57] [0bd5197a1c154a97fbf526752c6b129d] | |||||||||||||||||||||||||||||||||||||||||
| Feedback Forum | |||||||||||||||||||||||||||||||||||||||||
Post a new message | |||||||||||||||||||||||||||||||||||||||||
Dataset | |||||||||||||||||||||||||||||||||||||||||
| Dataseries X: | |||||||||||||||||||||||||||||||||||||||||
87.39 93.27 88.95 87.9 89.75 91.15 91.36 90.42 89.96 89.66 88.3 85.14 91.2 92.69 93.57 89.79 90.73 92.93 92.61 92.04 92.23 91.96 93.54 93.23 94.65 97.76 97.77 94.91 97.31 100.3 99.99 100.1 97.85 97.81 98.21 98.64 97.46 99.76 103.53 96.07 99.05 102.44 100.57 100.5 99.33 99.04 100.67 101.59 102.5 101.9 104.05 102.84 102.55 102.3 101.31 101.48 102.82 103.4 102.51 102.91 102.72 104.11 97.85 102.37 102.67 102.57 101.59 102.56 102.47 102.28 102.98 102.74 | |||||||||||||||||||||||||||||||||||||||||
Tables (Output of Computation) | |||||||||||||||||||||||||||||||||||||||||
| |||||||||||||||||||||||||||||||||||||||||
Figures (Output of Computation) | |||||||||||||||||||||||||||||||||||||||||
Input Parameters & R Code | |||||||||||||||||||||||||||||||||||||||||
| Parameters (Session): | |||||||||||||||||||||||||||||||||||||||||
| par1 = Consumentenprijzenindex voor pakketreizen ; par2 = http://stat.nbb.be ; par3 = De grafiek geeft de prijzenindex voor de cijferreeks pakketreizen weer ; par4 = 12 ; | |||||||||||||||||||||||||||||||||||||||||
| Parameters (R input): | |||||||||||||||||||||||||||||||||||||||||
| par1 = Consumentenprijzenindex voor pakketreizen ; par2 = http://stat.nbb.be ; par3 = De grafiek geeft de prijzenindex voor de cijferreeks pakketreizen weer ; par4 = 12 ; | |||||||||||||||||||||||||||||||||||||||||
| R code (references can be found in the software module): | |||||||||||||||||||||||||||||||||||||||||
par4 <- '12' | |||||||||||||||||||||||||||||||||||||||||