Free Statistics
of Irreproducible Research!
Description of Statistical Computation | |||||||||||||||||||||||||||||||||||||||||
|---|---|---|---|---|---|---|---|---|---|---|---|---|---|---|---|---|---|---|---|---|---|---|---|---|---|---|---|---|---|---|---|---|---|---|---|---|---|---|---|---|---|
| Author's title | |||||||||||||||||||||||||||||||||||||||||
| Author | *Unverified author* | ||||||||||||||||||||||||||||||||||||||||
| R Software Module | rwasp_univariatedataseries.wasp | ||||||||||||||||||||||||||||||||||||||||
| Title produced by software | Univariate Data Series | ||||||||||||||||||||||||||||||||||||||||
| Date of computation | Thu, 04 Feb 2016 19:44:28 +0000 | ||||||||||||||||||||||||||||||||||||||||
| Cite this page as follows | Statistical Computations at FreeStatistics.org, Office for Research Development and Education, URL https://freestatistics.org/blog/index.php?v=date/2016/Feb/04/t1454615337x529nefkcy74j67.htm/, Retrieved Mon, 29 Apr 2024 23:16:14 +0000 | ||||||||||||||||||||||||||||||||||||||||
| Statistical Computations at FreeStatistics.org, Office for Research Development and Education, URL https://freestatistics.org/blog/index.php?pk=291863, Retrieved Mon, 29 Apr 2024 23:16:14 +0000 | |||||||||||||||||||||||||||||||||||||||||
| QR Codes: | |||||||||||||||||||||||||||||||||||||||||
|
| |||||||||||||||||||||||||||||||||||||||||
| Original text written by user: | |||||||||||||||||||||||||||||||||||||||||
| IsPrivate? | No (this computation is public) | ||||||||||||||||||||||||||||||||||||||||
| User-defined keywords | |||||||||||||||||||||||||||||||||||||||||
| Estimated Impact | 155 | ||||||||||||||||||||||||||||||||||||||||
Tree of Dependent Computations | |||||||||||||||||||||||||||||||||||||||||
| Family? (F = Feedback message, R = changed R code, M = changed R Module, P = changed Parameters, D = changed Data) | |||||||||||||||||||||||||||||||||||||||||
| - [Univariate Data Series] [CPI sigaretten] [2016-02-04 19:44:28] [d41d8cd98f00b204e9800998ecf8427e] [Current] | |||||||||||||||||||||||||||||||||||||||||
| Feedback Forum | |||||||||||||||||||||||||||||||||||||||||
Post a new message | |||||||||||||||||||||||||||||||||||||||||
Dataset | |||||||||||||||||||||||||||||||||||||||||
| Dataseries X: | |||||||||||||||||||||||||||||||||||||||||
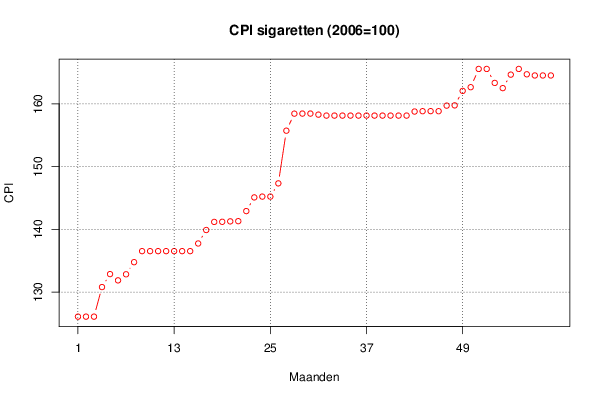
126.07 126.07 126.07 130.79 132.86 131.86 132.83 134.76 136.52 136.52 136.52 136.52 136.52 136.52 136.52 137.74 139.89 141.18 141.2 141.27 141.3 142.91 145.09 145.22 145.22 147.33 155.73 158.45 158.46 158.46 158.29 158.14 158.14 158.14 158.14 158.14 158.14 158.14 158.14 158.14 158.14 158.14 158.79 158.84 158.85 158.84 159.73 159.77 162.08 162.67 165.58 165.58 163.35 162.52 164.67 165.58 164.73 164.54 164.54 164.54 | |||||||||||||||||||||||||||||||||||||||||
Tables (Output of Computation) | |||||||||||||||||||||||||||||||||||||||||
| |||||||||||||||||||||||||||||||||||||||||
Figures (Output of Computation) | |||||||||||||||||||||||||||||||||||||||||
Input Parameters & R Code | |||||||||||||||||||||||||||||||||||||||||
| Parameters (Session): | |||||||||||||||||||||||||||||||||||||||||
| par1 = Consumentenprijsindex sigaretten ; par2 = http://statline.cbs.nl/Statweb/publication/?DM=SLNL&PA=71311NED&D1=0&D2=67&D3=207-218,220-231,233-244,246-257,259-270&HDR=T,G1&STB=G2&CHARTTYPE=1&VW=T ; par3 = Deze reeks stelt de evolutie voor van de consumptieprijsindex van sigaretten van begin 2011 tot eind 2015 met als basisjaar 2006. Deze zijn maandelijks opgedeeld om een betere zicht te hebben op de prijsevolutie. Ik koos voor deze cijferreeks omdat ik zelf een roker ben en wou weten hoe sterk de prijzen zijn gestegen. ; par4 = 12 ; | |||||||||||||||||||||||||||||||||||||||||
| Parameters (R input): | |||||||||||||||||||||||||||||||||||||||||
| par1 = Consumentenprijsindex sigaretten ; par2 = http://statline.cbs.nl/Statweb/publication/?DM=SLNL&PA=71311NED&D1=0&D2=67&D3=207-218,220-231,233-244,246-257,259-270&HDR=T,G1&STB=G2&CHARTTYPE=1&VW=T ; par3 = Deze reeks stelt de evolutie voor van de consumptieprijsindex van sigaretten van begin 2011 tot eind 2015 met als basisjaar 2006. Deze zijn maandelijks opgedeeld om een betere zicht te hebben op de prijsevolutie. Ik koos voor deze cijferreeks omdat ik zelf een roker ben en wou weten hoe sterk de prijzen zijn gestegen. ; par4 = 12 ; | |||||||||||||||||||||||||||||||||||||||||
| R code (references can be found in the software module): | |||||||||||||||||||||||||||||||||||||||||
par4 <- '12' | |||||||||||||||||||||||||||||||||||||||||