Free Statistics

of Irreproducible Research!

Author's title

Author*Unverified author*
R Software Modulerwasp_univariatedataseries.wasp
Title produced by softwareUnivariate Data Series
Date of computationTue, 16 Feb 2016 08:58:03 +0000
Cite this page as followsStatistical Computations at FreeStatistics.org, Office for Research Development and Education, URL https://freestatistics.org/blog/index.php?v=date/2016/Feb/16/t1455613186p2yaecf0i16aadn.htm/, Retrieved Sun, 05 May 2024 23:57:08 +0000
Statistical Computations at FreeStatistics.org, Office for Research Development and Education, URL https://freestatistics.org/blog/index.php?pk=292011, Retrieved Sun, 05 May 2024 23:57:08 +0000
QR Codes:

Original text written by user:
IsPrivate?No (this computation is public)
User-defined keywords
Estimated Impact96
Family? (F = Feedback message, R = changed R code, M = changed R Module, P = changed Parameters, D = changed Data)
-       [Univariate Data Series] [Grafiek CPI Wijnen] [2016-02-16 08:58:03] [d41d8cd98f00b204e9800998ecf8427e] [Current]
Feedback Forum

Post a new message
Dataseries X:
110.27
110.91
110.27
109.41
111.47
110.77
110.83
110.52
110.44
109.99
110.55
109.99
111.2
111.81
110.36
111.24
112.6
111.75
112.49
111.94
113.22
112.85
114.37
113.68
118
118.27
119.2
117.98
117.59
117.41
118.31
118.4
117.92
118.94
118.81
117.44
120.21
119.74
118.79
118.19
119.16
118.88
119.59
119.44
119.84
119.31
118.15
118.23
119.89
118.83
118.95
119.86
119.07
119.52
119.92
119.68
119.81
120.09
119.98
118.96


Summary of computational transaction
Raw Inputview raw input (R code)
Raw Outputview raw output of R engine
Computing time0 seconds
R Server'Gwilym Jenkins' @ jenkins.wessa.net

\begin{tabular}{lllllllll}
\hline
Summary of computational transaction \tabularnewline
Raw Input & view raw input (R code)  \tabularnewline
Raw Output & view raw output of R engine  \tabularnewline
Computing time & 0 seconds \tabularnewline
R Server & 'Gwilym Jenkins' @ jenkins.wessa.net \tabularnewline
\hline
\end{tabular}
%Source: https://freestatistics.org/blog/index.php?pk=292011&T=0

[TABLE]
[ROW][C]Summary of computational transaction[/C][/ROW]
[ROW][C]Raw Input[/C][C]view raw input (R code) [/C][/ROW]
[ROW][C]Raw Output[/C][C]view raw output of R engine [/C][/ROW]
[ROW][C]Computing time[/C][C]0 seconds[/C][/ROW]
[ROW][C]R Server[/C][C]'Gwilym Jenkins' @ jenkins.wessa.net[/C][/ROW]
[/TABLE]
Source: https://freestatistics.org/blog/index.php?pk=292011&T=0

Globally Unique Identifier (entire table): ba.freestatistics.org/blog/index.php?pk=292011&T=0

As an alternative you can also use a QR Code:  

The GUIDs for individual cells are displayed in the table below:

Summary of computational transaction
Raw Inputview raw input (R code)
Raw Outputview raw output of R engine
Computing time0 seconds
R Server'Gwilym Jenkins' @ jenkins.wessa.net


Univariate Dataseries
Name of dataseriesCPI Wijnen
Sourcehttp://statline.cbs.nl/Statweb/publication/?DM=SLNL&PA=71311NED&D1=0&D2=64&D3=207-218,220-231,233-244,246-257,259-270&HDR=T,G1&STB=G2&CHARTTYPE=1&P=T&VW=T
DescriptionDeze reeks stelt de evolutie voor van de consumptieprijsindex van wijn van begin 2011 tot eind 2015 met als basisjaar 2006. Deze zijn maandelijks opgedeeld om een betere zicht te hebben op de prijsevolutie.
Number of observations60

\begin{tabular}{lllllllll}
\hline
Univariate Dataseries \tabularnewline
Name of dataseries & CPI Wijnen \tabularnewline
Source & http://statline.cbs.nl/Statweb/publication/?DM=SLNL&PA=71311NED&D1=0&D2=64&D3=207-218,220-231,233-244,246-257,259-270&HDR=T,G1&STB=G2&CHARTTYPE=1&P=T&VW=T \tabularnewline
Description & Deze reeks stelt de evolutie voor van de consumptieprijsindex van wijn van begin 2011 tot eind 2015 met als basisjaar 2006. Deze zijn maandelijks opgedeeld om een betere zicht te hebben op de prijsevolutie. \tabularnewline
Number of observations & 60 \tabularnewline
\hline
\end{tabular}
%Source: https://freestatistics.org/blog/index.php?pk=292011&T=1

[TABLE]
[ROW][C]Univariate Dataseries[/C][/ROW]
[ROW][C]Name of dataseries[/C][C]CPI Wijnen[/C][/ROW]
[ROW][C]Source[/C][C]http://statline.cbs.nl/Statweb/publication/?DM=SLNL&PA=71311NED&D1=0&D2=64&D3=207-218,220-231,233-244,246-257,259-270&HDR=T,G1&STB=G2&CHARTTYPE=1&P=T&VW=T[/C][/ROW]
[ROW][C]Description[/C][C]Deze reeks stelt de evolutie voor van de consumptieprijsindex van wijn van begin 2011 tot eind 2015 met als basisjaar 2006. Deze zijn maandelijks opgedeeld om een betere zicht te hebben op de prijsevolutie.[/C][/ROW]
[ROW][C]Number of observations[/C][C]60[/C][/ROW]
[/TABLE]
Source: https://freestatistics.org/blog/index.php?pk=292011&T=1

Globally Unique Identifier (entire table): ba.freestatistics.org/blog/index.php?pk=292011&T=1

As an alternative you can also use a QR Code:  

The GUIDs for individual cells are displayed in the table below:

Univariate Dataseries
Name of dataseriesCPI Wijnen
Sourcehttp://statline.cbs.nl/Statweb/publication/?DM=SLNL&PA=71311NED&D1=0&D2=64&D3=207-218,220-231,233-244,246-257,259-270&HDR=T,G1&STB=G2&CHARTTYPE=1&P=T&VW=T
DescriptionDeze reeks stelt de evolutie voor van de consumptieprijsindex van wijn van begin 2011 tot eind 2015 met als basisjaar 2006. Deze zijn maandelijks opgedeeld om een betere zicht te hebben op de prijsevolutie.
Number of observations60


Parameters (Session):
par1 = CPI Wijnen ; par2 = http://statline.cbs.nl/Statweb/publication/?DM=SLNL&PA=71311NED&D1=0&D2=64&D3=207-218,220-231,233-244,246-257,259-270&HDR=T,G1&STB=G2&CHARTTYPE=1&P=T&VW=T ; par3 = Deze reeks stelt de evolutie voor van de consumptieprijsindex van wijn van begin 2011 tot eind 2015 met als basisjaar 2006. Deze zijn maandelijks opgedeeld om een betere zicht te hebben op de prijsevolutie. ; par4 = 12 ;
Parameters (R input):
par1 = CPI Wijnen ; par2 = http://statline.cbs.nl/Statweb/publication/?DM=SLNL&PA=71311NED&D1=0&D2=64&D3=207-218,220-231,233-244,246-257,259-270&HDR=T,G1&STB=G2&CHARTTYPE=1&P=T&VW=T ; par3 = Deze reeks stelt de evolutie voor van de consumptieprijsindex van wijn van begin 2011 tot eind 2015 met als basisjaar 2006. Deze zijn maandelijks opgedeeld om een betere zicht te hebben op de prijsevolutie. ; par4 = 12 ;
R code (references can be found in the software module):
par4 <- '12'
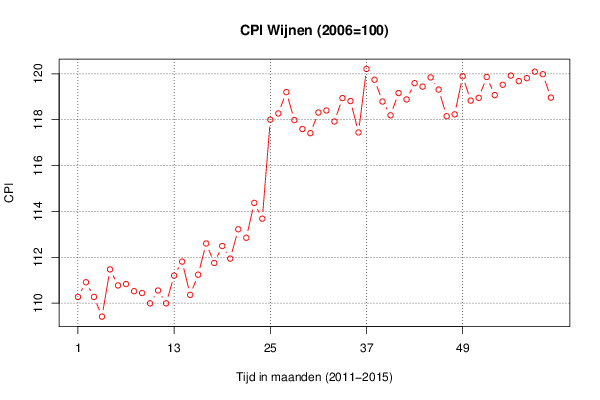
par3 <- 'Deze reeks stelt de evolutie voor van de consumptieprijsindex van sigaretten van begin 2011 tot eind 2015 met als basisjaar 2006. Deze zijn maandelijks opgedeeld om een betere zicht te hebben op de prijsevolutie.'
par2 <- 'http://statline.cbs.nl/Statweb/publication/?DM=SLNL&PA=71311NED&D1=0&D2=64&D3=207-218,220-231,233-244,246-257,259-270&HDR=T,G1&STB=G2&CHARTTYPE=1&P=T&VW=T'
par1 <- 'CPI Wijnen'
if (par4 != 'No season') {
par4 <- as.numeric(par4)
if (par4 < 4) par4 <- 12
}
summary(x)
n <- length(x)
bitmap(file='test1.png')
if (par4=='No season') {
plot(x,col=2,type='b',main=main,xlab=xlab,ylab=ylab,xaxt='n')
axis(1,at=seq(1,n,10))
}
if (par4!='No season') {
plot(x,col=2,type='b',main=main,xlab=xlab,ylab=ylab,xaxt='n')
axis(1,at=seq(1,n,par4))
grid(nx=0,ny=NULL,col='black')
abline(v=seq(1,n,par4),col='black',lty='dotted')
}
dev.off()
load(file='createtable')
a<-table.start()
a<-table.row.start(a)
a<-table.element(a,'Univariate Dataseries',2,TRUE)
a<-table.row.end(a)
a<-table.row.start(a)
a<-table.element(a,'Name of dataseries',header=TRUE)
a<-table.element(a,par1)
a<-table.row.end(a)
a<-table.row.start(a)
a<-table.element(a,'Source',header=TRUE)
a<-table.element(a,par2)
a<-table.row.end(a)
a<-table.row.start(a)
a<-table.element(a,'Description',header=TRUE)
a<-table.element(a,par3)
a<-table.row.end(a)
a<-table.row.start(a)
a<-table.element(a,'Number of observations',header=TRUE)
a<-table.element(a,length(x))
a<-table.row.end(a)
a<-table.end(a)
table.save(a,file='mytable.tab')