Free Statistics

of Irreproducible Research!

Author's title

Author*Unverified author*
R Software Modulerwasp_density.wasp
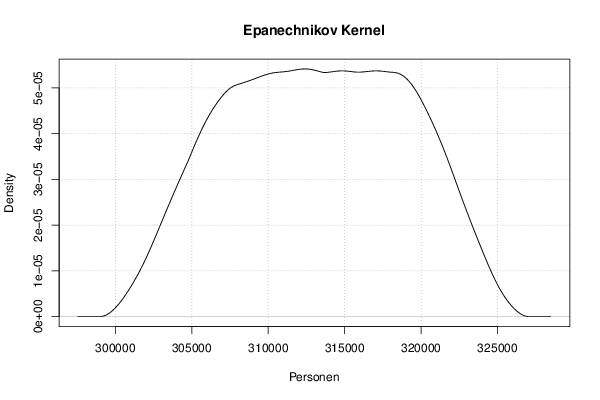
Title produced by softwareKernel Density Estimation
Date of computationThu, 18 Feb 2016 19:57:04 +0000
Cite this page as followsStatistical Computations at FreeStatistics.org, Office for Research Development and Education, URL https://freestatistics.org/blog/index.php?v=date/2016/Feb/18/t1455825862rlrosj6o2lre19o.htm/, Retrieved Mon, 06 May 2024 23:44:11 +0000
Statistical Computations at FreeStatistics.org, Office for Research Development and Education, URL https://freestatistics.org/blog/index.php?pk=292156, Retrieved Mon, 06 May 2024 23:44:11 +0000
QR Codes:

Original text written by user:
IsPrivate?No (this computation is public)
User-defined keywords
Estimated Impact94
Family? (F = Feedback message, R = changed R code, M = changed R Module, P = changed Parameters, D = changed Data)
-     [Univariate Data Series] [] [2016-02-06 21:39:48] [74be16979710d4c4e7c6647856088456]
- RMPD    [Kernel Density Estimation] [dichtheidsgrafiek...] [2016-02-18 19:57:04] [cd64a5fdaad03808d42c807526620cf5] [Current]
Feedback Forum

Post a new message
Dataseries X:
303506
303711
303907
304117
304323
304556
304798
305045
305309
305554
305786
306004
306208
306402
306588
306787
306984
307206
307439
307685
307946
308189
308418
308633
308833
309027
309212
309191
309376
309562
309767
309989
310218
310451
310657
310853
311042
311205
311367
311548
311729
311923
312139
312355
312587
312810
313003
313191
313373
313537
313705
313881
314052
314247
314449
314673
314909
315129
315341
315532
315701
315869
316041
316220
316395
316594
316799
317019
317253
317470
317679
317867
318032
318200
318373
318552
318728
318927
319133
319354
319588
319804
320013
320201
320367
320534
320707
320887
321062
321262
321467
321688
321922
322139
322348
322536


Summary of computational transaction
Raw Inputview raw input (R code)
Raw Outputview raw output of R engine
Computing time4 seconds
R Server'George Udny Yule' @ yule.wessa.net

\begin{tabular}{lllllllll}
\hline
Summary of computational transaction \tabularnewline
Raw Input & view raw input (R code)  \tabularnewline
Raw Output & view raw output of R engine  \tabularnewline
Computing time & 4 seconds \tabularnewline
R Server & 'George Udny Yule' @ yule.wessa.net \tabularnewline
\hline
\end{tabular}
%Source: https://freestatistics.org/blog/index.php?pk=292156&T=0

[TABLE]
[ROW][C]Summary of computational transaction[/C][/ROW]
[ROW][C]Raw Input[/C][C]view raw input (R code) [/C][/ROW]
[ROW][C]Raw Output[/C][C]view raw output of R engine [/C][/ROW]
[ROW][C]Computing time[/C][C]4 seconds[/C][/ROW]
[ROW][C]R Server[/C][C]'George Udny Yule' @ yule.wessa.net[/C][/ROW]
[/TABLE]
Source: https://freestatistics.org/blog/index.php?pk=292156&T=0

Globally Unique Identifier (entire table): ba.freestatistics.org/blog/index.php?pk=292156&T=0

As an alternative you can also use a QR Code:  

The GUIDs for individual cells are displayed in the table below:

Summary of computational transaction
Raw Inputview raw input (R code)
Raw Outputview raw output of R engine
Computing time4 seconds
R Server'George Udny Yule' @ yule.wessa.net


Properties of Density Trace
Bandwidth1984.57527895599
#Observations96

\begin{tabular}{lllllllll}
\hline
Properties of Density Trace \tabularnewline
Bandwidth & 1984.57527895599 \tabularnewline
#Observations & 96 \tabularnewline
\hline
\end{tabular}
%Source: https://freestatistics.org/blog/index.php?pk=292156&T=1

[TABLE]
[ROW][C]Properties of Density Trace[/C][/ROW]
[ROW][C]Bandwidth[/C][C]1984.57527895599[/C][/ROW]
[ROW][C]#Observations[/C][C]96[/C][/ROW]
[/TABLE]
Source: https://freestatistics.org/blog/index.php?pk=292156&T=1

Globally Unique Identifier (entire table): ba.freestatistics.org/blog/index.php?pk=292156&T=1

As an alternative you can also use a QR Code:  

The GUIDs for individual cells are displayed in the table below:

Properties of Density Trace
Bandwidth1984.57527895599
#Observations96


Maximum Density Values
Kernelx-valuemax. density
Gaussian311779.8693555555.37683358689359e-05
Epanechnikov312445.8418964775.41535365090917e-05
Rectangular312445.8418964775.49198284627922e-05
Triangular312627.4707712735.38695113365716e-05
Biweight312264.213021685.39431246671966e-05
Cosine312203.6700634145.3892753805608e-05
Optcosine312324.7559799455.40991505606922e-05

\begin{tabular}{lllllllll}
\hline
Maximum Density Values \tabularnewline
Kernel & x-value & max. density \tabularnewline
Gaussian & 311779.869355555 & 5.37683358689359e-05 \tabularnewline
Epanechnikov & 312445.841896477 & 5.41535365090917e-05 \tabularnewline
Rectangular & 312445.841896477 & 5.49198284627922e-05 \tabularnewline
Triangular & 312627.470771273 & 5.38695113365716e-05 \tabularnewline
Biweight & 312264.21302168 & 5.39431246671966e-05 \tabularnewline
Cosine & 312203.670063414 & 5.3892753805608e-05 \tabularnewline
Optcosine & 312324.755979945 & 5.40991505606922e-05 \tabularnewline
\hline
\end{tabular}
%Source: https://freestatistics.org/blog/index.php?pk=292156&T=2

[TABLE]
[ROW][C]Maximum Density Values[/C][/ROW]
[ROW][C]Kernel[/C][C]x-value[/C][C]max. density[/C][/ROW]
[ROW][C]Gaussian[/C][C]311779.869355555[/C][C]5.37683358689359e-05[/C][/ROW]
[ROW][C]Epanechnikov[/C][C]312445.841896477[/C][C]5.41535365090917e-05[/C][/ROW]
[ROW][C]Rectangular[/C][C]312445.841896477[/C][C]5.49198284627922e-05[/C][/ROW]
[ROW][C]Triangular[/C][C]312627.470771273[/C][C]5.38695113365716e-05[/C][/ROW]
[ROW][C]Biweight[/C][C]312264.21302168[/C][C]5.39431246671966e-05[/C][/ROW]
[ROW][C]Cosine[/C][C]312203.670063414[/C][C]5.3892753805608e-05[/C][/ROW]
[ROW][C]Optcosine[/C][C]312324.755979945[/C][C]5.40991505606922e-05[/C][/ROW]
[/TABLE]
Source: https://freestatistics.org/blog/index.php?pk=292156&T=2

Globally Unique Identifier (entire table): ba.freestatistics.org/blog/index.php?pk=292156&T=2

As an alternative you can also use a QR Code:  

The GUIDs for individual cells are displayed in the table below:

Maximum Density Values
Kernelx-valuemax. density
Gaussian311779.8693555555.37683358689359e-05
Epanechnikov312445.8418964775.41535365090917e-05
Rectangular312445.8418964775.49198284627922e-05
Triangular312627.4707712735.38695113365716e-05
Biweight312264.213021685.39431246671966e-05
Cosine312203.6700634145.3892753805608e-05
Optcosine312324.7559799455.40991505606922e-05


Kernel Density Values
x-valueGaussianEpanechnikovRectangularTriangularBiweightCosineOptcosine
Kernel Density Values are not shown

\begin{tabular}{lllllllll}
\hline
Kernel Density Values \tabularnewline
x-value & Gaussian & Epanechnikov & Rectangular & Triangular & Biweight & Cosine & Optcosine \tabularnewline
Kernel Density Values are not shown \tabularnewline
\hline
\end{tabular}
%Source: https://freestatistics.org/blog/index.php?pk=292156&T=3

[TABLE]
[ROW][C]Kernel Density Values[/C][/ROW]
[ROW][C]x-value[/C][C]Gaussian[/C][C]Epanechnikov[/C][C]Rectangular[/C][C]Triangular[/C][C]Biweight[/C][C]Cosine[/C][C]Optcosine[/C][/ROW]
[ROW][C]Kernel Density Values are not shown[/C][/ROW]
[/TABLE]
Source: https://freestatistics.org/blog/index.php?pk=292156&T=3

Globally Unique Identifier (entire table): ba.freestatistics.org/blog/index.php?pk=292156&T=3

As an alternative you can also use a QR Code:  

The GUIDs for individual cells are displayed in the table below:

Kernel Density Values
x-valueGaussianEpanechnikovRectangularTriangularBiweightCosineOptcosine
Kernel Density Values are not shown


Parameters (Session):
par1 = 0 ; par2 = no ; par3 = 512 ;
Parameters (R input):
par1 = 0 ; par2 = no ; par3 = 512 ;
R code (references can be found in the software module):
if (par1 == '0') bw <- 'nrd0'
if (par1 != '0') bw <- as.numeric(par1)
par3 <- as.numeric(par3)
mydensity <- array(NA, dim=c(par3,8))
bitmap(file='density1.png')
mydensity1<-density(x,bw=bw,kernel='gaussian',na.rm=TRUE)
mydensity[,8] = signif(mydensity1$x,3)
mydensity[,1] = signif(mydensity1$y,3)
plot(mydensity1,main='Gaussian Kernel',xlab=xlab,ylab=ylab)
grid()
dev.off()
mydensity1
bitmap(file='density2.png')
mydensity2<-density(x,bw=bw,kernel='epanechnikov',na.rm=TRUE)
mydensity[,2] = signif(mydensity2$y,3)
plot(mydensity2,main='Epanechnikov Kernel',xlab=xlab,ylab=ylab)
grid()
dev.off()
bitmap(file='density3.png')
mydensity3<-density(x,bw=bw,kernel='rectangular',na.rm=TRUE)
mydensity[,3] = signif(mydensity3$y,3)
plot(mydensity3,main='Rectangular Kernel',xlab=xlab,ylab=ylab)
grid()
dev.off()
bitmap(file='density4.png')
mydensity4<-density(x,bw=bw,kernel='triangular',na.rm=TRUE)
mydensity[,4] = signif(mydensity4$y,3)
plot(mydensity4,main='Triangular Kernel',xlab=xlab,ylab=ylab)
grid()
dev.off()
bitmap(file='density5.png')
mydensity5<-density(x,bw=bw,kernel='biweight',na.rm=TRUE)
mydensity[,5] = signif(mydensity5$y,3)
plot(mydensity5,main='Biweight Kernel',xlab=xlab,ylab=ylab)
grid()
dev.off()
bitmap(file='density6.png')
mydensity6<-density(x,bw=bw,kernel='cosine',na.rm=TRUE)
mydensity[,6] = signif(mydensity6$y,3)
plot(mydensity6,main='Cosine Kernel',xlab=xlab,ylab=ylab)
grid()
dev.off()
bitmap(file='density7.png')
mydensity7<-density(x,bw=bw,kernel='optcosine',na.rm=TRUE)
mydensity[,7] = signif(mydensity7$y,3)
plot(mydensity7,main='Optcosine Kernel',xlab=xlab,ylab=ylab)
grid()
dev.off()
load(file='createtable')
ab<-table.start()
ab<-table.row.start(ab)
ab<-table.element(ab,'Properties of Density Trace',2,TRUE)
ab<-table.row.end(ab)
ab<-table.row.start(ab)
ab<-table.element(ab,'Bandwidth',header=TRUE)
ab<-table.element(ab,mydensity1$bw)
ab<-table.row.end(ab)
ab<-table.row.start(ab)
ab<-table.element(ab,'#Observations',header=TRUE)
ab<-table.element(ab,mydensity1$n)
ab<-table.row.end(ab)
ab<-table.end(ab)
a <- ab
table.save(ab,file='mytable123.tab')
b<-table.start()
b<-table.row.start(b)
b<-table.element(b,'Maximum Density Values',3,TRUE)
b<-table.row.end(b)
b<-table.row.start(b)
b<-table.element(b,'Kernel',1,TRUE)
b<-table.element(b,'x-value',1,TRUE)
b<-table.element(b,'max. density',1,TRUE)
b<-table.row.end(b)
b<-table.row.start(b)
b<-table.element(b,'Gaussian',1,TRUE)
b<-table.element(b,mydensity1$x[mydensity1$y==max(mydensity1$y)],1)
b<-table.element(b,mydensity1$y[mydensity1$y==max(mydensity1$y)],1)
b<-table.row.end(b)
b<-table.row.start(b)
b<-table.element(b,'Epanechnikov',1,TRUE)
b<-table.element(b,mydensity2$x[mydensity2$y==max(mydensity2$y)],1)
b<-table.element(b,mydensity2$y[mydensity2$y==max(mydensity2$y)],1)
b<-table.row.end(b)
b<-table.row.start(b)
b<-table.element(b,'Rectangular',1,TRUE)
b<-table.element(b,mydensity3$x[mydensity3$y==max(mydensity3$y)],1)
b<-table.element(b,mydensity3$y[mydensity3$y==max(mydensity3$y)],1)
b<-table.row.end(b)
b<-table.row.start(b)
b<-table.element(b,'Triangular',1,TRUE)
b<-table.element(b,mydensity4$x[mydensity4$y==max(mydensity4$y)],1)
b<-table.element(b,mydensity4$y[mydensity4$y==max(mydensity4$y)],1)
b<-table.row.end(b)
b<-table.row.start(b)
b<-table.element(b,'Biweight',1,TRUE)
b<-table.element(b,mydensity5$x[mydensity5$y==max(mydensity5$y)],1)
b<-table.element(b,mydensity5$y[mydensity5$y==max(mydensity5$y)],1)
b<-table.row.end(b)
b<-table.row.start(b)
b<-table.element(b,'Cosine',1,TRUE)
b<-table.element(b,mydensity6$x[mydensity6$y==max(mydensity6$y)],1)
b<-table.element(b,mydensity6$y[mydensity6$y==max(mydensity6$y)],1)
b<-table.row.end(b)
b<-table.row.start(b)
b<-table.element(b,'Optcosine',1,TRUE)
b<-table.element(b,mydensity7$x[mydensity7$y==max(mydensity7$y)],1)
b<-table.element(b,mydensity7$y[mydensity7$y==max(mydensity7$y)],1)
b<-table.row.end(b)
b<-table.end(b)
a <- b[1]
table.save(b,file='mytable2a.tab')
a<-table.start()
a<-table.row.start(a)
a<-table.element(a,'Kernel Density Values',8,TRUE)
a<-table.row.end(a)
a<-table.row.start(a)
a<-table.element(a,'x-value',1,TRUE)
a<-table.element(a,'Gaussian',1,TRUE)
a<-table.element(a,'Epanechnikov',1,TRUE)
a<-table.element(a,'Rectangular',1,TRUE)
a<-table.element(a,'Triangular',1,TRUE)
a<-table.element(a,'Biweight',1,TRUE)
a<-table.element(a,'Cosine',1,TRUE)
a<-table.element(a,'Optcosine',1,TRUE)
a<-table.row.end(a)
if (par2=='yes') {
for(i in 1:par3) {
a<-table.row.start(a)
a<-table.element(a,mydensity[i,8],1,TRUE)
for(j in 1:7) {
a<-table.element(a,mydensity[i,j],1)
}
a<-table.row.end(a)
}
} else {
a<-table.row.start(a)
a<-table.element(a,'Kernel Density Values are not shown',8)
a<-table.row.end(a)
}
a<-table.end(a)
table.save(a,file='mytable1.tab')