Free Statistics
of Irreproducible Research!
Description of Statistical Computation | |||||||||||||||||||||||||||||||||||||||||
|---|---|---|---|---|---|---|---|---|---|---|---|---|---|---|---|---|---|---|---|---|---|---|---|---|---|---|---|---|---|---|---|---|---|---|---|---|---|---|---|---|---|
| Author's title | |||||||||||||||||||||||||||||||||||||||||
| Author | *Unverified author* | ||||||||||||||||||||||||||||||||||||||||
| R Software Module | rwasp_univariatedataseries.wasp | ||||||||||||||||||||||||||||||||||||||||
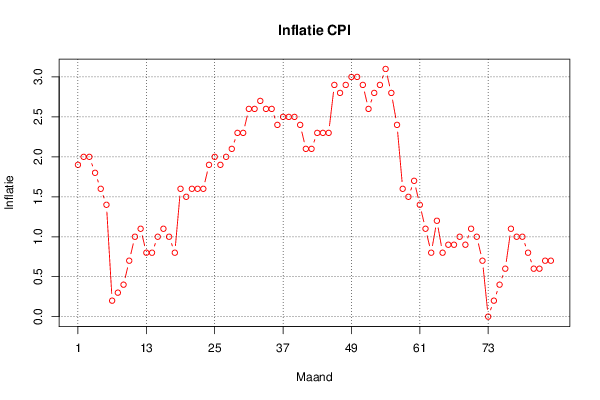
| Title produced by software | Univariate Data Series | ||||||||||||||||||||||||||||||||||||||||
| Date of computation | Fri, 19 Feb 2016 07:47:41 +0000 | ||||||||||||||||||||||||||||||||||||||||
| Cite this page as follows | Statistical Computations at FreeStatistics.org, Office for Research Development and Education, URL https://freestatistics.org/blog/index.php?v=date/2016/Feb/19/t1455868234mr0xnqwq9llabdg.htm/, Retrieved Tue, 07 May 2024 15:58:30 +0000 | ||||||||||||||||||||||||||||||||||||||||
| Statistical Computations at FreeStatistics.org, Office for Research Development and Education, URL https://freestatistics.org/blog/index.php?pk=292157, Retrieved Tue, 07 May 2024 15:58:30 +0000 | |||||||||||||||||||||||||||||||||||||||||
| QR Codes: | |||||||||||||||||||||||||||||||||||||||||
|
| |||||||||||||||||||||||||||||||||||||||||
| Original text written by user: | |||||||||||||||||||||||||||||||||||||||||
| IsPrivate? | No (this computation is public) | ||||||||||||||||||||||||||||||||||||||||
| User-defined keywords | |||||||||||||||||||||||||||||||||||||||||
| Estimated Impact | 107 | ||||||||||||||||||||||||||||||||||||||||
Tree of Dependent Computations | |||||||||||||||||||||||||||||||||||||||||
| Family? (F = Feedback message, R = changed R code, M = changed R Module, P = changed Parameters, D = changed Data) | |||||||||||||||||||||||||||||||||||||||||
| - [Univariate Data Series] [Datareeks-Inflati...] [2016-02-19 07:47:41] [544b481aaa38f6ceeb4c090a83033a19] [Current] | |||||||||||||||||||||||||||||||||||||||||
| Feedback Forum | |||||||||||||||||||||||||||||||||||||||||
Post a new message | |||||||||||||||||||||||||||||||||||||||||
Dataset | |||||||||||||||||||||||||||||||||||||||||
| Dataseries X: | |||||||||||||||||||||||||||||||||||||||||
1,9 2 2 1,8 1,6 1,4 0,2 0,3 0,4 0,7 1 1,1 0,8 0,8 1 1,1 1 0,8 1,6 1,5 1,6 1,6 1,6 1,9 2 1,9 2 2,1 2,3 2,3 2,6 2,6 2,7 2,6 2,6 2,4 2,5 2,5 2,5 2,4 2,1 2,1 2,3 2,3 2,3 2,9 2,8 2,9 3 3 2,9 2,6 2,8 2,9 3,1 2,8 2,4 1,6 1,5 1,7 1,4 1,1 0,8 1,2 0,8 0,9 0,9 1 0,9 1,1 1 0,7 0 0,2 0,4 0,6 1,1 1 1 0,8 0,6 0,6 0,7 0,7 | |||||||||||||||||||||||||||||||||||||||||
Tables (Output of Computation) | |||||||||||||||||||||||||||||||||||||||||
| |||||||||||||||||||||||||||||||||||||||||
Figures (Output of Computation) | |||||||||||||||||||||||||||||||||||||||||
Input Parameters & R Code | |||||||||||||||||||||||||||||||||||||||||
| Parameters (Session): | |||||||||||||||||||||||||||||||||||||||||
| par1 = Percentage Inflatie ; par2 = http://statline.cbs.nl/StatWeb/publication/?VW=T&DM=SLNL&PA=70936NED&D1=0&D2=(l-34)-l&HD=081020-1258&HDR=T&STB=G1 ; par3 = De gemiddelde prijsstijging van de producten in Nederland ; par4 = 12 ; | |||||||||||||||||||||||||||||||||||||||||
| Parameters (R input): | |||||||||||||||||||||||||||||||||||||||||
| par1 = Percentage Inflatie ; par2 = http://statline.cbs.nl/StatWeb/publication/?VW=T&DM=SLNL&PA=70936NED&D1=0&D2=(l-34)-l&HD=081020-1258&HDR=T&STB=G1 ; par3 = De gemiddelde prijsstijging van de producten in Nederland ; par4 = 12 ; | |||||||||||||||||||||||||||||||||||||||||
| R code (references can be found in the software module): | |||||||||||||||||||||||||||||||||||||||||
if (par4 != 'No season') { | |||||||||||||||||||||||||||||||||||||||||