Free Statistics
of Irreproducible Research!
Description of Statistical Computation | |||||||||||||||||||||||||||||||||||||||||||||||||||||||||||||||||||||||||||||||||||||||||||||||||||||||||||||||||||||||||||||||||||||||||||||||||||||||||||||||||||||||||||||||||||||||||||||||||||||||||||||||||||||
|---|---|---|---|---|---|---|---|---|---|---|---|---|---|---|---|---|---|---|---|---|---|---|---|---|---|---|---|---|---|---|---|---|---|---|---|---|---|---|---|---|---|---|---|---|---|---|---|---|---|---|---|---|---|---|---|---|---|---|---|---|---|---|---|---|---|---|---|---|---|---|---|---|---|---|---|---|---|---|---|---|---|---|---|---|---|---|---|---|---|---|---|---|---|---|---|---|---|---|---|---|---|---|---|---|---|---|---|---|---|---|---|---|---|---|---|---|---|---|---|---|---|---|---|---|---|---|---|---|---|---|---|---|---|---|---|---|---|---|---|---|---|---|---|---|---|---|---|---|---|---|---|---|---|---|---|---|---|---|---|---|---|---|---|---|---|---|---|---|---|---|---|---|---|---|---|---|---|---|---|---|---|---|---|---|---|---|---|---|---|---|---|---|---|---|---|---|---|---|---|---|---|---|---|---|---|---|---|---|---|---|---|---|---|
| Author's title | |||||||||||||||||||||||||||||||||||||||||||||||||||||||||||||||||||||||||||||||||||||||||||||||||||||||||||||||||||||||||||||||||||||||||||||||||||||||||||||||||||||||||||||||||||||||||||||||||||||||||||||||||||||
| Author | *Unverified author* | ||||||||||||||||||||||||||||||||||||||||||||||||||||||||||||||||||||||||||||||||||||||||||||||||||||||||||||||||||||||||||||||||||||||||||||||||||||||||||||||||||||||||||||||||||||||||||||||||||||||||||||||||||||
| R Software Module | rwasp_histogram.wasp | ||||||||||||||||||||||||||||||||||||||||||||||||||||||||||||||||||||||||||||||||||||||||||||||||||||||||||||||||||||||||||||||||||||||||||||||||||||||||||||||||||||||||||||||||||||||||||||||||||||||||||||||||||||
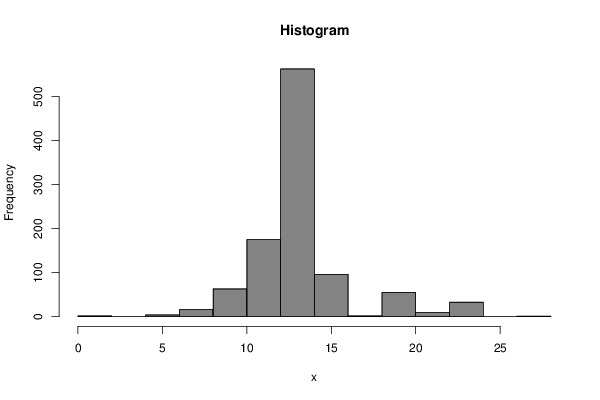
| Title produced by software | Histogram | ||||||||||||||||||||||||||||||||||||||||||||||||||||||||||||||||||||||||||||||||||||||||||||||||||||||||||||||||||||||||||||||||||||||||||||||||||||||||||||||||||||||||||||||||||||||||||||||||||||||||||||||||||||
| Date of computation | Sat, 20 Feb 2016 15:28:34 +0000 | ||||||||||||||||||||||||||||||||||||||||||||||||||||||||||||||||||||||||||||||||||||||||||||||||||||||||||||||||||||||||||||||||||||||||||||||||||||||||||||||||||||||||||||||||||||||||||||||||||||||||||||||||||||
| Cite this page as follows | Statistical Computations at FreeStatistics.org, Office for Research Development and Education, URL https://freestatistics.org/blog/index.php?v=date/2016/Feb/20/t1455982582qmpgt7mq2gqze91.htm/, Retrieved Wed, 08 May 2024 20:28:42 +0000 | ||||||||||||||||||||||||||||||||||||||||||||||||||||||||||||||||||||||||||||||||||||||||||||||||||||||||||||||||||||||||||||||||||||||||||||||||||||||||||||||||||||||||||||||||||||||||||||||||||||||||||||||||||||
| Statistical Computations at FreeStatistics.org, Office for Research Development and Education, URL https://freestatistics.org/blog/index.php?pk=292321, Retrieved Wed, 08 May 2024 20:28:42 +0000 | |||||||||||||||||||||||||||||||||||||||||||||||||||||||||||||||||||||||||||||||||||||||||||||||||||||||||||||||||||||||||||||||||||||||||||||||||||||||||||||||||||||||||||||||||||||||||||||||||||||||||||||||||||||
| QR Codes: | |||||||||||||||||||||||||||||||||||||||||||||||||||||||||||||||||||||||||||||||||||||||||||||||||||||||||||||||||||||||||||||||||||||||||||||||||||||||||||||||||||||||||||||||||||||||||||||||||||||||||||||||||||||
|
| |||||||||||||||||||||||||||||||||||||||||||||||||||||||||||||||||||||||||||||||||||||||||||||||||||||||||||||||||||||||||||||||||||||||||||||||||||||||||||||||||||||||||||||||||||||||||||||||||||||||||||||||||||||
| Original text written by user: | |||||||||||||||||||||||||||||||||||||||||||||||||||||||||||||||||||||||||||||||||||||||||||||||||||||||||||||||||||||||||||||||||||||||||||||||||||||||||||||||||||||||||||||||||||||||||||||||||||||||||||||||||||||
| IsPrivate? | No (this computation is public) | ||||||||||||||||||||||||||||||||||||||||||||||||||||||||||||||||||||||||||||||||||||||||||||||||||||||||||||||||||||||||||||||||||||||||||||||||||||||||||||||||||||||||||||||||||||||||||||||||||||||||||||||||||||
| User-defined keywords | |||||||||||||||||||||||||||||||||||||||||||||||||||||||||||||||||||||||||||||||||||||||||||||||||||||||||||||||||||||||||||||||||||||||||||||||||||||||||||||||||||||||||||||||||||||||||||||||||||||||||||||||||||||
| Estimated Impact | 125 | ||||||||||||||||||||||||||||||||||||||||||||||||||||||||||||||||||||||||||||||||||||||||||||||||||||||||||||||||||||||||||||||||||||||||||||||||||||||||||||||||||||||||||||||||||||||||||||||||||||||||||||||||||||
Tree of Dependent Computations | |||||||||||||||||||||||||||||||||||||||||||||||||||||||||||||||||||||||||||||||||||||||||||||||||||||||||||||||||||||||||||||||||||||||||||||||||||||||||||||||||||||||||||||||||||||||||||||||||||||||||||||||||||||
| Family? (F = Feedback message, R = changed R code, M = changed R Module, P = changed Parameters, D = changed Data) | |||||||||||||||||||||||||||||||||||||||||||||||||||||||||||||||||||||||||||||||||||||||||||||||||||||||||||||||||||||||||||||||||||||||||||||||||||||||||||||||||||||||||||||||||||||||||||||||||||||||||||||||||||||
| - [Histogram] [] [2016-02-20 15:28:34] [60c466f2753cef60360c0cd0685abd02] [Current] | |||||||||||||||||||||||||||||||||||||||||||||||||||||||||||||||||||||||||||||||||||||||||||||||||||||||||||||||||||||||||||||||||||||||||||||||||||||||||||||||||||||||||||||||||||||||||||||||||||||||||||||||||||||
| Feedback Forum | |||||||||||||||||||||||||||||||||||||||||||||||||||||||||||||||||||||||||||||||||||||||||||||||||||||||||||||||||||||||||||||||||||||||||||||||||||||||||||||||||||||||||||||||||||||||||||||||||||||||||||||||||||||
Post a new message | |||||||||||||||||||||||||||||||||||||||||||||||||||||||||||||||||||||||||||||||||||||||||||||||||||||||||||||||||||||||||||||||||||||||||||||||||||||||||||||||||||||||||||||||||||||||||||||||||||||||||||||||||||||
Dataset | |||||||||||||||||||||||||||||||||||||||||||||||||||||||||||||||||||||||||||||||||||||||||||||||||||||||||||||||||||||||||||||||||||||||||||||||||||||||||||||||||||||||||||||||||||||||||||||||||||||||||||||||||||||
| Dataseries X: | |||||||||||||||||||||||||||||||||||||||||||||||||||||||||||||||||||||||||||||||||||||||||||||||||||||||||||||||||||||||||||||||||||||||||||||||||||||||||||||||||||||||||||||||||||||||||||||||||||||||||||||||||||||
11.25 11.25 11.25 11.25 13.05 13.50 13.50 13.05 15.75 13.50 13.50 13.50 13.05 13.50 13.50 11.70 13.50 13.50 13.50 15.75 13.50 13.50 13.50 22.50 11.25 13.05 13.50 11.25 13.50 13.50 11.25 18.90 13.05 6.75 13.05 13.50 11.25 9.00 4.50 13.50 13.05 13.50 22.50 11.25 13.50 13.50 11.25 22.50 13.05 13.50 13.50 13.50 13.50 13.50 13.50 13.05 15.75 18.00 13.05 11.70 10.35 11.25 13.50 13.50 13.50 13.50 9.00 13.05 11.25 11.25 12.60 13.50 13.50 11.25 13.50 13.95 13.50 13.05 20.25 13.50 13.50 15.75 13.50 13.50 11.25 22.50 18.00 9.00 15.75 9.90 13.50 11.25 13.50 13.50 13.05 22.50 20.25 13.50 11.70 13.50 13.05 15.75 9.00 13.05 11.25 13.50 20.25 15.75 13.50 13.50 18.00 9.00 11.70 13.05 9.00 11.25 13.50 13.50 11.25 13.50 10.35 11.25 13.50 13.50 18.00 13.50 18.00 15.75 18.00 13.50 11.25 14.85 13.50 13.50 13.50 15.75 14.85 15.75 13.50 18.00 13.05 11.25 12.15 13.50 13.50 15.75 9.00 13.50 13.50 11.25 11.25 13.50 13.50 13.50 18.00 18.00 13.50 18.00 9.00 22.50 9.00 13.50 13.50 13.50 13.50 11.25 13.50 13.50 13.50 13.50 13.50 13.50 10.35 13.50 11.25 22.50 9.00 10.35 11.25 13.05 11.70 18.00 13.50 13.50 15.75 9.00 13.05 11.25 13.50 13.50 13.50 22.50 13.50 15.75 13.50 13.50 13.50 15.75 13.50 15.75 6.75 13.50 9.00 15.75 18.00 13.50 13.50 18.00 13.05 13.50 9.00 15.75 22.50 13.50 13.50 18.00 13.50 22.50 8.10 6.75 13.50 10.35 13.05 13.50 15.75 13.50 10.35 13.50 11.25 11.70 11.25 13.50 9.00 11.25 13.50 13.05 18.00 13.50 13.50 13.50 18.00 16.65 9.00 11.25 13.50 14.40 15.75 14.40 13.50 13.50 15.75 13.50 11.25 13.50 10.80 13.50 15.75 13.50 13.50 13.50 13.50 13.50 11.25 13.50 11.25 15.75 13.50 13.50 13.50 13.50 13.50 13.50 15.75 14.40 13.50 9.00 9.00 13.50 15.75 13.50 18.00 13.05 11.70 18.00 11.25 15.75 13.50 10.35 13.50 12.15 15.75 13.50 9.00 13.50 11.25 22.50 13.50 13.50 13.05 15.75 13.05 11.25 13.50 20.25 13.50 11.25 13.05 11.25 18.00 13.50 13.50 18.00 13.50 13.50 13.05 15.75 15.75 13.50 13.50 12.15 13.50 13.50 13.05 22.50 13.50 13.50 9.00 11.25 11.25 13.50 12.15 13.05 22.50 22.50 13.50 13.50 18.00 9.00 13.50 13.50 13.50 11.25 13.50 13.50 13.50 13.50 18.00 11.25 15.75 13.50 13.50 15.75 9.00 9.00 22.50 15.75 13.05 22.50 18.00 13.50 20.25 13.50 18.00 13.50 13.05 11.25 18.00 15.75 11.25 9.45 13.50 13.50 13.50 13.50 6.75 13.50 13.50 13.50 13.50 13.50 11.25 13.50 13.50 13.50 13.50 11.25 11.25 18.00 13.50 14.85 18.00 11.70 13.50 16.65 11.25 13.05 13.50 11.25 13.05 13.50 13.50 13.50 13.50 13.50 9.90 11.25 13.50 18.00 13.50 13.05 11.25 13.50 13.50 13.05 13.50 13.50 13.50 15.75 13.50 15.75 13.50 5.40 6.75 11.25 13.50 13.50 13.50 11.25 9.00 13.50 15.75 15.75 13.05 18.00 13.50 18.00 13.50 11.25 13.50 9.00 13.05 12.60 13.50 11.25 13.50 22.50 13.50 13.50 13.05 13.50 15.75 9.00 13.50 13.50 13.50 13.50 13.50 18.00 13.50 13.50 15.75 11.25 13.50 22.50 13.50 13.50 13.50 13.50 11.25 13.50 13.50 13.50 11.25 13.50 13.50 13.50 11.25 13.50 13.50 11.70 13.50 13.50 13.50 13.50 11.25 9.00 13.50 15.75 13.50 9.00 9.00 11.25 13.50 13.50 13.50 13.50 13.05 15.75 11.25 13.50 13.50 15.75 15.75 13.50 9.00 13.50 13.50 13.50 11.25 13.50 13.50 11.70 13.50 11.25 13.50 22.50 13.50 9.00 13.05 13.50 13.50 13.50 13.50 13.50 18.00 13.50 15.75 12.15 13.50 11.25 13.05 11.25 13.50 11.25 13.50 13.05 11.25 9.00 13.50 11.25 14.40 13.50 13.05 13.50 13.50 13.50 13.50 11.25 11.25 13.50 13.50 27.00 9.00 13.50 15.75 11.25 13.50 11.25 13.50 18.00 11.25 13.50 13.05 13.05 13.50 13.05 11.70 8.10 13.50 18.00 13.50 13.50 13.50 13.50 13.50 13.05 13.50 13.50 13.50 15.75 13.50 13.50 13.50 9.00 13.05 9.00 13.50 13.50 11.25 13.50 18.00 13.50 13.50 11.25 18.00 13.50 13.50 13.05 11.25 13.50 15.75 13.50 9.00 13.50 9.00 11.25 13.50 18.00 11.25 21.15 9.00 9.00 13.50 13.50 11.25 13.50 11.25 18.00 13.05 18.00 13.05 13.50 13.50 13.50 15.75 13.50 9.00 13.50 10.80 13.50 18.00 13.50 13.50 6.75 15.75 8.10 13.50 11.25 13.50 13.50 13.50 6.75 9.00 13.50 11.25 13.50 9.00 13.50 13.50 13.50 11.25 18.00 22.50 13.50 13.50 15.75 13.50 13.50 6.75 13.50 11.25 13.50 13.50 11.70 13.50 11.25 11.25 13.50 13.50 13.50 22.50 13.50 11.25 13.50 11.25 13.50 11.70 11.25 15.30 13.50 11.25 13.50 15.75 13.50 18.00 13.50 13.50 13.05 13.50 13.05 13.50 22.50 13.50 6.75 13.50 11.25 22.50 13.50 13.50 15.75 15.75 11.25 10.35 13.50 13.50 13.50 15.75 11.25 6.75 13.50 13.05 13.50 6.75 13.50 18.00 13.05 13.50 11.25 11.25 22.50 13.50 0.45 13.50 13.50 13.50 15.75 13.50 13.50 15.75 13.50 9.00 9.00 9.00 13.50 15.75 13.50 11.25 13.05 15.75 18.00 13.50 15.75 13.05 13.50 13.50 13.50 13.05 13.50 13.50 13.50 13.50 13.50 13.50 13.50 15.75 13.50 13.50 13.50 11.25 22.50 13.50 13.50 13.50 11.25 11.25 15.75 13.50 15.75 13.50 13.05 13.50 15.75 13.50 13.50 15.75 11.25 11.25 13.05 15.75 22.50 13.50 13.50 13.05 13.50 13.50 13.50 9.00 13.50 13.50 9.00 13.50 11.25 9.00 13.50 22.50 9.00 18.00 18.00 13.50 13.05 15.75 11.25 9.00 9.00 9.45 13.05 15.75 13.50 12.60 13.50 13.50 15.75 11.70 13.50 11.25 11.25 13.50 13.50 13.50 11.25 15.75 13.50 15.75 15.75 13.50 13.05 13.50 11.70 13.50 12.15 13.50 13.50 22.50 11.25 13.50 13.50 13.50 18.00 13.50 14.40 11.25 15.75 13.50 13.50 9.00 13.50 18.00 13.50 11.70 13.50 18.00 13.50 13.50 11.70 15.75 15.75 11.70 22.50 13.50 13.50 11.25 13.50 18.00 11.25 13.50 11.25 13.50 6.75 18.00 13.50 11.25 13.50 13.50 13.50 13.50 13.50 11.25 11.25 13.50 9.00 8.10 11.25 13.50 13.05 5.85 12.15 13.50 13.50 13.50 13.50 11.25 13.50 15.75 13.05 13.50 13.05 13.50 13.50 11.25 20.25 13.05 13.50 13.50 11.25 11.25 13.05 13.50 13.50 13.50 13.05 13.50 10.35 15.75 15.75 4.50 14.40 13.05 20.25 13.50 13.05 13.50 6.75 22.50 15.75 11.25 11.25 13.50 13.50 13.50 13.50 13.50 18.00 13.05 11.25 13.50 11.25 13.50 11.25 11.25 13.50 15.75 13.50 11.25 9.00 13.50 13.50 13.50 6.75 13.50 15.75 22.50 15.75 13.50 13.50 11.25 13.50 13.50 6.75 13.50 11.25 13.50 13.50 11.25 13.05 13.50 13.50 18.00 11.25 13.50 13.50 11.25 15.75 13.05 13.50 11.25 13.50 13.50 11.25 13.50 13.50 13.50 11.25 15.75 11.25 13.05 11.25 13.50 13.50 22.50 13.50 13.50 0.00 13.50 13.50 13.50 9.00 11.25 11.25 15.75 11.25 13.50 11.25 22.50 9.00 20.25 11.25 15.75 13.50 18.00 15.75 13.50 13.50 13.50 13.50 10.35 13.50 11.25 13.50 6.75 | |||||||||||||||||||||||||||||||||||||||||||||||||||||||||||||||||||||||||||||||||||||||||||||||||||||||||||||||||||||||||||||||||||||||||||||||||||||||||||||||||||||||||||||||||||||||||||||||||||||||||||||||||||||
Tables (Output of Computation) | |||||||||||||||||||||||||||||||||||||||||||||||||||||||||||||||||||||||||||||||||||||||||||||||||||||||||||||||||||||||||||||||||||||||||||||||||||||||||||||||||||||||||||||||||||||||||||||||||||||||||||||||||||||
| |||||||||||||||||||||||||||||||||||||||||||||||||||||||||||||||||||||||||||||||||||||||||||||||||||||||||||||||||||||||||||||||||||||||||||||||||||||||||||||||||||||||||||||||||||||||||||||||||||||||||||||||||||||
Figures (Output of Computation) | |||||||||||||||||||||||||||||||||||||||||||||||||||||||||||||||||||||||||||||||||||||||||||||||||||||||||||||||||||||||||||||||||||||||||||||||||||||||||||||||||||||||||||||||||||||||||||||||||||||||||||||||||||||
Input Parameters & R Code | |||||||||||||||||||||||||||||||||||||||||||||||||||||||||||||||||||||||||||||||||||||||||||||||||||||||||||||||||||||||||||||||||||||||||||||||||||||||||||||||||||||||||||||||||||||||||||||||||||||||||||||||||||||
| Parameters (Session): | |||||||||||||||||||||||||||||||||||||||||||||||||||||||||||||||||||||||||||||||||||||||||||||||||||||||||||||||||||||||||||||||||||||||||||||||||||||||||||||||||||||||||||||||||||||||||||||||||||||||||||||||||||||
| par2 = grey ; par3 = FALSE ; par4 = Unknown ; | |||||||||||||||||||||||||||||||||||||||||||||||||||||||||||||||||||||||||||||||||||||||||||||||||||||||||||||||||||||||||||||||||||||||||||||||||||||||||||||||||||||||||||||||||||||||||||||||||||||||||||||||||||||
| Parameters (R input): | |||||||||||||||||||||||||||||||||||||||||||||||||||||||||||||||||||||||||||||||||||||||||||||||||||||||||||||||||||||||||||||||||||||||||||||||||||||||||||||||||||||||||||||||||||||||||||||||||||||||||||||||||||||
| par1 = ; par2 = grey ; par3 = FALSE ; par4 = Unknown ; | |||||||||||||||||||||||||||||||||||||||||||||||||||||||||||||||||||||||||||||||||||||||||||||||||||||||||||||||||||||||||||||||||||||||||||||||||||||||||||||||||||||||||||||||||||||||||||||||||||||||||||||||||||||
| R code (references can be found in the software module): | |||||||||||||||||||||||||||||||||||||||||||||||||||||||||||||||||||||||||||||||||||||||||||||||||||||||||||||||||||||||||||||||||||||||||||||||||||||||||||||||||||||||||||||||||||||||||||||||||||||||||||||||||||||
par1 <- as.numeric(par1) | |||||||||||||||||||||||||||||||||||||||||||||||||||||||||||||||||||||||||||||||||||||||||||||||||||||||||||||||||||||||||||||||||||||||||||||||||||||||||||||||||||||||||||||||||||||||||||||||||||||||||||||||||||||