Free Statistics
of Irreproducible Research!
Description of Statistical Computation | |||||||||||||||||||||||||||||||||||||||||
|---|---|---|---|---|---|---|---|---|---|---|---|---|---|---|---|---|---|---|---|---|---|---|---|---|---|---|---|---|---|---|---|---|---|---|---|---|---|---|---|---|---|
| Author's title | |||||||||||||||||||||||||||||||||||||||||
| Author | *Unverified author* | ||||||||||||||||||||||||||||||||||||||||
| R Software Module | rwasp_univariatedataseries.wasp | ||||||||||||||||||||||||||||||||||||||||
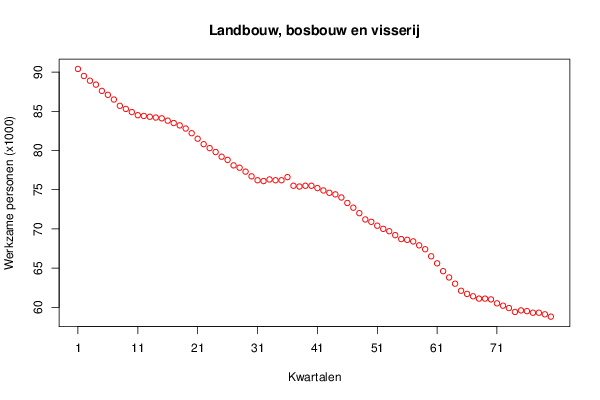
| Title produced by software | Univariate Data Series | ||||||||||||||||||||||||||||||||||||||||
| Date of computation | Tue, 23 Feb 2016 14:56:40 +0000 | ||||||||||||||||||||||||||||||||||||||||
| Cite this page as follows | Statistical Computations at FreeStatistics.org, Office for Research Development and Education, URL https://freestatistics.org/blog/index.php?v=date/2016/Feb/23/t1456239542p12c2sq5v8lbycp.htm/, Retrieved Tue, 08 Jul 2025 11:27:57 +0000 | ||||||||||||||||||||||||||||||||||||||||
| Statistical Computations at FreeStatistics.org, Office for Research Development and Education, URL https://freestatistics.org/blog/index.php?pk=292528, Retrieved Tue, 08 Jul 2025 11:27:57 +0000 | |||||||||||||||||||||||||||||||||||||||||
| QR Codes: | |||||||||||||||||||||||||||||||||||||||||
|
| |||||||||||||||||||||||||||||||||||||||||
| Original text written by user: | |||||||||||||||||||||||||||||||||||||||||
| IsPrivate? | No (this computation is public) | ||||||||||||||||||||||||||||||||||||||||
| User-defined keywords | |||||||||||||||||||||||||||||||||||||||||
| Estimated Impact | 161 | ||||||||||||||||||||||||||||||||||||||||
Tree of Dependent Computations | |||||||||||||||||||||||||||||||||||||||||
| Family? (F = Feedback message, R = changed R code, M = changed R Module, P = changed Parameters, D = changed Data) | |||||||||||||||||||||||||||||||||||||||||
| - [Univariate Data Series] [] [2016-02-23 14:56:40] [3d038f408b3fdbe799ace9817e748893] [Current] - RMP [Histogram] [] [2016-02-23 18:31:34] [06b70a401cc2120a77d9cd1d85e9d45c] - RMP [Histogram] [] [2016-02-23 18:31:34] [06b70a401cc2120a77d9cd1d85e9d45c] - RMP [Histogram] [] [2016-02-23 18:31:34] [06b70a401cc2120a77d9cd1d85e9d45c] - RMP [Kernel Density Estimation] [] [2016-02-23 18:43:45] [06b70a401cc2120a77d9cd1d85e9d45c] | |||||||||||||||||||||||||||||||||||||||||
| Feedback Forum | |||||||||||||||||||||||||||||||||||||||||
Post a new message | |||||||||||||||||||||||||||||||||||||||||
Dataset | |||||||||||||||||||||||||||||||||||||||||
| Dataseries X: | |||||||||||||||||||||||||||||||||||||||||
90.4 89.5 88.9 88.4 87.6 87.1 86.5 85.7 85.3 84.9 84.5 84.4 84.3 84.2 84.1 83.8 83.5 83.2 82.8 82.2 81.5 80.8 80.3 79.8 79.2 78.8 78.1 77.8 77.3 76.7 76.2 76.1 76.3 76.2 76.2 76.6 75.5 75.4 75.5 75.5 75.2 74.9 74.6 74.4 74 73.3 72.7 72 71.2 70.9 70.4 70 69.7 69.2 68.7 68.6 68.4 67.9 67.4 66.5 65.6 64.6 63.8 63 62.1 61.7 61.4 61.1 61.1 61 60.5 60.2 59.9 59.4 59.6 59.5 59.3 59.3 59.1 58.8 | |||||||||||||||||||||||||||||||||||||||||
Tables (Output of Computation) | |||||||||||||||||||||||||||||||||||||||||
| |||||||||||||||||||||||||||||||||||||||||
Figures (Output of Computation) | |||||||||||||||||||||||||||||||||||||||||
Input Parameters & R Code | |||||||||||||||||||||||||||||||||||||||||
| Parameters (Session): | |||||||||||||||||||||||||||||||||||||||||
| par1 = Landbouw en bosbouw en visserij ; par2 = http://stat.nbb.be/Index.aspx?ThemeTreeId=8&lang=nl# ; par3 = Het aantal werkzame personen (x1000) in de landbouw, bosbouw en visserij per kwartaal. ; par4 = No season ; | |||||||||||||||||||||||||||||||||||||||||
| Parameters (R input): | |||||||||||||||||||||||||||||||||||||||||
| par1 = Landbouw en bosbouw en visserij ; par2 = http://stat.nbb.be/Index.aspx?ThemeTreeId=8&lang=nl# ; par3 = Het aantal werkzame personen (x1000) in de landbouw, bosbouw en visserij per kwartaal. ; par4 = No season ; | |||||||||||||||||||||||||||||||||||||||||
| R code (references can be found in the software module): | |||||||||||||||||||||||||||||||||||||||||
par4 <- 'No season' | |||||||||||||||||||||||||||||||||||||||||