Free Statistics

of Irreproducible Research!

Author's title

Author*Unverified author*
R Software Modulerwasp_autocorrelation.wasp
Title produced by software(Partial) Autocorrelation Function
Date of computationSat, 02 Jan 2016 12:48:43 +0000
Cite this page as followsStatistical Computations at FreeStatistics.org, Office for Research Development and Education, URL https://freestatistics.org/blog/index.php?v=date/2016/Jan/02/t1451738979fjgq7hr2y2qjx35.htm/, Retrieved Sun, 28 Apr 2024 23:21:09 +0000
Statistical Computations at FreeStatistics.org, Office for Research Development and Education, URL https://freestatistics.org/blog/index.php?pk=287266, Retrieved Sun, 28 Apr 2024 23:21:09 +0000
QR Codes:

Original text written by user:
IsPrivate?No (this computation is public)
User-defined keywords
Estimated Impact165
Family? (F = Feedback message, R = changed R code, M = changed R Module, P = changed Parameters, D = changed Data)
-       [(Partial) Autocorrelation Function] [] [2016-01-02 12:48:43] [1d0d2a0cfdb7bd945f85de3fbad0315e] [Current]
Feedback Forum

Post a new message
Dataseries X:
173019
173690
172439
171914
171968
169500
173898
172308
171568
164939
161275
160770
162466
160185
154836
154103
150495
142707
149962
149967
144572
143819
141070
144119
145330
143279
139063
139202
133632
134476
141859
140693
138047
138346
140167
146796
152228
155410
159032
160312
157687
160141
167421
167628
164403
163405
163229
171154
173323
172381
168983
165380
161641
161933
172018
168455
164332
161193
157645
161694
163411
161834
159511
156359
154223
151497
160607
159672
155601
154668
153960
157307
165218
165616
162212
159787
157454
156485
165887
166836
163541
163973
164805
167521
174347
173374
172198
171055
168385
167281
177670
177280
174846
174476
174595
178392
185345
183293
181081
177795
173552
170734
179293
178659
175894
174815
173506
175376


Summary of computational transaction
Raw Inputview raw input (R code)
Raw Outputview raw output of R engine
Computing time2 seconds
R Server'Herman Ole Andreas Wold' @ wold.wessa.net

\begin{tabular}{lllllllll}
\hline
Summary of computational transaction \tabularnewline
Raw Input & view raw input (R code)  \tabularnewline
Raw Output & view raw output of R engine  \tabularnewline
Computing time & 2 seconds \tabularnewline
R Server & 'Herman Ole Andreas Wold' @ wold.wessa.net \tabularnewline
\hline
\end{tabular}
%Source: https://freestatistics.org/blog/index.php?pk=287266&T=0

[TABLE]
[ROW][C]Summary of computational transaction[/C][/ROW]
[ROW][C]Raw Input[/C][C]view raw input (R code) [/C][/ROW]
[ROW][C]Raw Output[/C][C]view raw output of R engine [/C][/ROW]
[ROW][C]Computing time[/C][C]2 seconds[/C][/ROW]
[ROW][C]R Server[/C][C]'Herman Ole Andreas Wold' @ wold.wessa.net[/C][/ROW]
[/TABLE]
Source: https://freestatistics.org/blog/index.php?pk=287266&T=0

Globally Unique Identifier (entire table): ba.freestatistics.org/blog/index.php?pk=287266&T=0

As an alternative you can also use a QR Code:  

The GUIDs for individual cells are displayed in the table below:

Summary of computational transaction
Raw Inputview raw input (R code)
Raw Outputview raw output of R engine
Computing time2 seconds
R Server'Herman Ole Andreas Wold' @ wold.wessa.net


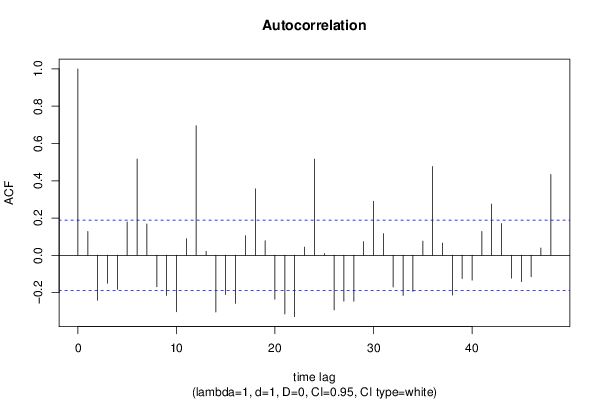
Autocorrelation Function
Time lag kACF(k)T-STATP-value
10.1278061.3220.094487
2-0.241029-2.49320.007095
3-0.149826-1.54980.062069
4-0.182875-1.89170.030619
50.1788911.85050.033502
60.5173135.35110
70.1678431.73620.042705
8-0.168494-1.74290.042111
9-0.215977-2.23410.013779
10-0.302971-3.1340.001113
110.089010.92070.179632
120.6955287.19460
130.021180.21910.413499
14-0.304465-3.14940.001061
15-0.210331-2.17570.01589
16-0.258087-2.66970.004388
170.1053721.090.139086
180.3566393.68910.000178
190.0780150.8070.210729
20-0.23531-2.43410.008293
21-0.314761-3.25590.000757
22-0.329058-3.40380.000468
230.0442190.45740.324153
240.5162985.34060
250.0098360.10170.459573
26-0.292924-3.030.001533
27-0.245699-2.54150.006235
28-0.24633-2.54810.006126
290.0735130.76040.224338
300.2901793.00160.001671
310.1163381.20340.115736
32-0.170281-1.76140.040514
33-0.214914-2.22310.014156
34-0.193672-2.00340.023833
350.0762960.78920.215866
360.4762034.92592e-06
370.065560.67820.249569
38-0.21306-2.20390.014837
39-0.124031-1.2830.101135
40-0.133309-1.3790.085392
410.1282961.32710.09365
420.27472.84150.002689
430.1704421.76310.040372
44-0.122468-1.26680.103984
45-0.141156-1.46010.073592
46-0.11534-1.19310.117737
470.0394190.40780.342134
480.4332994.48219e-06

\begin{tabular}{lllllllll}
\hline
Autocorrelation Function \tabularnewline
Time lag k & ACF(k) & T-STAT & P-value \tabularnewline
1 & 0.127806 & 1.322 & 0.094487 \tabularnewline
2 & -0.241029 & -2.4932 & 0.007095 \tabularnewline
3 & -0.149826 & -1.5498 & 0.062069 \tabularnewline
4 & -0.182875 & -1.8917 & 0.030619 \tabularnewline
5 & 0.178891 & 1.8505 & 0.033502 \tabularnewline
6 & 0.517313 & 5.3511 & 0 \tabularnewline
7 & 0.167843 & 1.7362 & 0.042705 \tabularnewline
8 & -0.168494 & -1.7429 & 0.042111 \tabularnewline
9 & -0.215977 & -2.2341 & 0.013779 \tabularnewline
10 & -0.302971 & -3.134 & 0.001113 \tabularnewline
11 & 0.08901 & 0.9207 & 0.179632 \tabularnewline
12 & 0.695528 & 7.1946 & 0 \tabularnewline
13 & 0.02118 & 0.2191 & 0.413499 \tabularnewline
14 & -0.304465 & -3.1494 & 0.001061 \tabularnewline
15 & -0.210331 & -2.1757 & 0.01589 \tabularnewline
16 & -0.258087 & -2.6697 & 0.004388 \tabularnewline
17 & 0.105372 & 1.09 & 0.139086 \tabularnewline
18 & 0.356639 & 3.6891 & 0.000178 \tabularnewline
19 & 0.078015 & 0.807 & 0.210729 \tabularnewline
20 & -0.23531 & -2.4341 & 0.008293 \tabularnewline
21 & -0.314761 & -3.2559 & 0.000757 \tabularnewline
22 & -0.329058 & -3.4038 & 0.000468 \tabularnewline
23 & 0.044219 & 0.4574 & 0.324153 \tabularnewline
24 & 0.516298 & 5.3406 & 0 \tabularnewline
25 & 0.009836 & 0.1017 & 0.459573 \tabularnewline
26 & -0.292924 & -3.03 & 0.001533 \tabularnewline
27 & -0.245699 & -2.5415 & 0.006235 \tabularnewline
28 & -0.24633 & -2.5481 & 0.006126 \tabularnewline
29 & 0.073513 & 0.7604 & 0.224338 \tabularnewline
30 & 0.290179 & 3.0016 & 0.001671 \tabularnewline
31 & 0.116338 & 1.2034 & 0.115736 \tabularnewline
32 & -0.170281 & -1.7614 & 0.040514 \tabularnewline
33 & -0.214914 & -2.2231 & 0.014156 \tabularnewline
34 & -0.193672 & -2.0034 & 0.023833 \tabularnewline
35 & 0.076296 & 0.7892 & 0.215866 \tabularnewline
36 & 0.476203 & 4.9259 & 2e-06 \tabularnewline
37 & 0.06556 & 0.6782 & 0.249569 \tabularnewline
38 & -0.21306 & -2.2039 & 0.014837 \tabularnewline
39 & -0.124031 & -1.283 & 0.101135 \tabularnewline
40 & -0.133309 & -1.379 & 0.085392 \tabularnewline
41 & 0.128296 & 1.3271 & 0.09365 \tabularnewline
42 & 0.2747 & 2.8415 & 0.002689 \tabularnewline
43 & 0.170442 & 1.7631 & 0.040372 \tabularnewline
44 & -0.122468 & -1.2668 & 0.103984 \tabularnewline
45 & -0.141156 & -1.4601 & 0.073592 \tabularnewline
46 & -0.11534 & -1.1931 & 0.117737 \tabularnewline
47 & 0.039419 & 0.4078 & 0.342134 \tabularnewline
48 & 0.433299 & 4.4821 & 9e-06 \tabularnewline
\hline
\end{tabular}
%Source: https://freestatistics.org/blog/index.php?pk=287266&T=1

[TABLE]
[ROW][C]Autocorrelation Function[/C][/ROW]
[ROW][C]Time lag k[/C][C]ACF(k)[/C][C]T-STAT[/C][C]P-value[/C][/ROW]
[ROW][C]1[/C][C]0.127806[/C][C]1.322[/C][C]0.094487[/C][/ROW]
[ROW][C]2[/C][C]-0.241029[/C][C]-2.4932[/C][C]0.007095[/C][/ROW]
[ROW][C]3[/C][C]-0.149826[/C][C]-1.5498[/C][C]0.062069[/C][/ROW]
[ROW][C]4[/C][C]-0.182875[/C][C]-1.8917[/C][C]0.030619[/C][/ROW]
[ROW][C]5[/C][C]0.178891[/C][C]1.8505[/C][C]0.033502[/C][/ROW]
[ROW][C]6[/C][C]0.517313[/C][C]5.3511[/C][C]0[/C][/ROW]
[ROW][C]7[/C][C]0.167843[/C][C]1.7362[/C][C]0.042705[/C][/ROW]
[ROW][C]8[/C][C]-0.168494[/C][C]-1.7429[/C][C]0.042111[/C][/ROW]
[ROW][C]9[/C][C]-0.215977[/C][C]-2.2341[/C][C]0.013779[/C][/ROW]
[ROW][C]10[/C][C]-0.302971[/C][C]-3.134[/C][C]0.001113[/C][/ROW]
[ROW][C]11[/C][C]0.08901[/C][C]0.9207[/C][C]0.179632[/C][/ROW]
[ROW][C]12[/C][C]0.695528[/C][C]7.1946[/C][C]0[/C][/ROW]
[ROW][C]13[/C][C]0.02118[/C][C]0.2191[/C][C]0.413499[/C][/ROW]
[ROW][C]14[/C][C]-0.304465[/C][C]-3.1494[/C][C]0.001061[/C][/ROW]
[ROW][C]15[/C][C]-0.210331[/C][C]-2.1757[/C][C]0.01589[/C][/ROW]
[ROW][C]16[/C][C]-0.258087[/C][C]-2.6697[/C][C]0.004388[/C][/ROW]
[ROW][C]17[/C][C]0.105372[/C][C]1.09[/C][C]0.139086[/C][/ROW]
[ROW][C]18[/C][C]0.356639[/C][C]3.6891[/C][C]0.000178[/C][/ROW]
[ROW][C]19[/C][C]0.078015[/C][C]0.807[/C][C]0.210729[/C][/ROW]
[ROW][C]20[/C][C]-0.23531[/C][C]-2.4341[/C][C]0.008293[/C][/ROW]
[ROW][C]21[/C][C]-0.314761[/C][C]-3.2559[/C][C]0.000757[/C][/ROW]
[ROW][C]22[/C][C]-0.329058[/C][C]-3.4038[/C][C]0.000468[/C][/ROW]
[ROW][C]23[/C][C]0.044219[/C][C]0.4574[/C][C]0.324153[/C][/ROW]
[ROW][C]24[/C][C]0.516298[/C][C]5.3406[/C][C]0[/C][/ROW]
[ROW][C]25[/C][C]0.009836[/C][C]0.1017[/C][C]0.459573[/C][/ROW]
[ROW][C]26[/C][C]-0.292924[/C][C]-3.03[/C][C]0.001533[/C][/ROW]
[ROW][C]27[/C][C]-0.245699[/C][C]-2.5415[/C][C]0.006235[/C][/ROW]
[ROW][C]28[/C][C]-0.24633[/C][C]-2.5481[/C][C]0.006126[/C][/ROW]
[ROW][C]29[/C][C]0.073513[/C][C]0.7604[/C][C]0.224338[/C][/ROW]
[ROW][C]30[/C][C]0.290179[/C][C]3.0016[/C][C]0.001671[/C][/ROW]
[ROW][C]31[/C][C]0.116338[/C][C]1.2034[/C][C]0.115736[/C][/ROW]
[ROW][C]32[/C][C]-0.170281[/C][C]-1.7614[/C][C]0.040514[/C][/ROW]
[ROW][C]33[/C][C]-0.214914[/C][C]-2.2231[/C][C]0.014156[/C][/ROW]
[ROW][C]34[/C][C]-0.193672[/C][C]-2.0034[/C][C]0.023833[/C][/ROW]
[ROW][C]35[/C][C]0.076296[/C][C]0.7892[/C][C]0.215866[/C][/ROW]
[ROW][C]36[/C][C]0.476203[/C][C]4.9259[/C][C]2e-06[/C][/ROW]
[ROW][C]37[/C][C]0.06556[/C][C]0.6782[/C][C]0.249569[/C][/ROW]
[ROW][C]38[/C][C]-0.21306[/C][C]-2.2039[/C][C]0.014837[/C][/ROW]
[ROW][C]39[/C][C]-0.124031[/C][C]-1.283[/C][C]0.101135[/C][/ROW]
[ROW][C]40[/C][C]-0.133309[/C][C]-1.379[/C][C]0.085392[/C][/ROW]
[ROW][C]41[/C][C]0.128296[/C][C]1.3271[/C][C]0.09365[/C][/ROW]
[ROW][C]42[/C][C]0.2747[/C][C]2.8415[/C][C]0.002689[/C][/ROW]
[ROW][C]43[/C][C]0.170442[/C][C]1.7631[/C][C]0.040372[/C][/ROW]
[ROW][C]44[/C][C]-0.122468[/C][C]-1.2668[/C][C]0.103984[/C][/ROW]
[ROW][C]45[/C][C]-0.141156[/C][C]-1.4601[/C][C]0.073592[/C][/ROW]
[ROW][C]46[/C][C]-0.11534[/C][C]-1.1931[/C][C]0.117737[/C][/ROW]
[ROW][C]47[/C][C]0.039419[/C][C]0.4078[/C][C]0.342134[/C][/ROW]
[ROW][C]48[/C][C]0.433299[/C][C]4.4821[/C][C]9e-06[/C][/ROW]
[/TABLE]
Source: https://freestatistics.org/blog/index.php?pk=287266&T=1

Globally Unique Identifier (entire table): ba.freestatistics.org/blog/index.php?pk=287266&T=1

As an alternative you can also use a QR Code:  

The GUIDs for individual cells are displayed in the table below:

Autocorrelation Function
Time lag kACF(k)T-STATP-value
10.1278061.3220.094487
2-0.241029-2.49320.007095
3-0.149826-1.54980.062069
4-0.182875-1.89170.030619
50.1788911.85050.033502
60.5173135.35110
70.1678431.73620.042705
8-0.168494-1.74290.042111
9-0.215977-2.23410.013779
10-0.302971-3.1340.001113
110.089010.92070.179632
120.6955287.19460
130.021180.21910.413499
14-0.304465-3.14940.001061
15-0.210331-2.17570.01589
16-0.258087-2.66970.004388
170.1053721.090.139086
180.3566393.68910.000178
190.0780150.8070.210729
20-0.23531-2.43410.008293
21-0.314761-3.25590.000757
22-0.329058-3.40380.000468
230.0442190.45740.324153
240.5162985.34060
250.0098360.10170.459573
26-0.292924-3.030.001533
27-0.245699-2.54150.006235
28-0.24633-2.54810.006126
290.0735130.76040.224338
300.2901793.00160.001671
310.1163381.20340.115736
32-0.170281-1.76140.040514
33-0.214914-2.22310.014156
34-0.193672-2.00340.023833
350.0762960.78920.215866
360.4762034.92592e-06
370.065560.67820.249569
38-0.21306-2.20390.014837
39-0.124031-1.2830.101135
40-0.133309-1.3790.085392
410.1282961.32710.09365
420.27472.84150.002689
430.1704421.76310.040372
44-0.122468-1.26680.103984
45-0.141156-1.46010.073592
46-0.11534-1.19310.117737
470.0394190.40780.342134
480.4332994.48219e-06


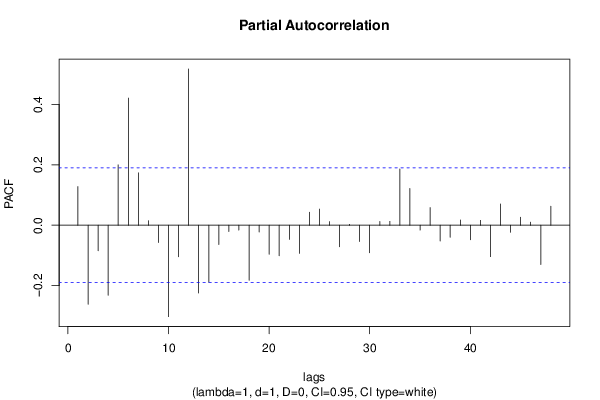
Partial Autocorrelation Function
Time lag kPACF(k)T-STATP-value
10.1278061.3220.094487
2-0.261637-2.70640.003959
3-0.084602-0.87510.191733
4-0.231919-2.3990.009085
50.19982.06670.020586
60.420834.35311.5e-05
70.1732581.79220.037964
80.0146010.1510.440115
9-0.057025-0.58990.278259
10-0.302786-3.1320.00112
11-0.104479-1.08070.141123
120.5173915.35190
13-0.224682-2.32410.011004
14-0.188774-1.95270.026734
15-0.063958-0.66160.254828
16-0.021128-0.21860.413708
17-0.016214-0.16770.433559
18-0.182076-1.88340.03118
19-0.022558-0.23330.407972
20-0.095943-0.99240.161612
21-0.101268-1.04750.148608
22-0.046893-0.48510.314311
23-0.093285-0.96490.168373
240.0430570.44540.328472
250.0532520.55080.291444
260.0117980.1220.451548
27-0.071177-0.73630.23159
280.0028380.02940.488318
29-0.053954-0.55810.288968
30-0.091433-0.94580.173192
310.0125230.12950.448587
320.0127090.13150.447828
330.1862451.92650.028345
340.12171.25890.105407
35-0.016193-0.16750.433646
360.0582270.60230.274122
37-0.052121-0.53910.295453
38-0.040017-0.41390.339874
390.0172080.1780.429529
40-0.048463-0.50130.308591
410.0159970.16550.434442
42-0.104127-1.07710.141929
430.0702090.72620.234636
44-0.023636-0.24450.40366
450.0263360.27240.392911
460.0101240.10470.458397
47-0.129991-1.34460.090793
480.0630320.6520.257897

\begin{tabular}{lllllllll}
\hline
Partial Autocorrelation Function \tabularnewline
Time lag k & PACF(k) & T-STAT & P-value \tabularnewline
1 & 0.127806 & 1.322 & 0.094487 \tabularnewline
2 & -0.261637 & -2.7064 & 0.003959 \tabularnewline
3 & -0.084602 & -0.8751 & 0.191733 \tabularnewline
4 & -0.231919 & -2.399 & 0.009085 \tabularnewline
5 & 0.1998 & 2.0667 & 0.020586 \tabularnewline
6 & 0.42083 & 4.3531 & 1.5e-05 \tabularnewline
7 & 0.173258 & 1.7922 & 0.037964 \tabularnewline
8 & 0.014601 & 0.151 & 0.440115 \tabularnewline
9 & -0.057025 & -0.5899 & 0.278259 \tabularnewline
10 & -0.302786 & -3.132 & 0.00112 \tabularnewline
11 & -0.104479 & -1.0807 & 0.141123 \tabularnewline
12 & 0.517391 & 5.3519 & 0 \tabularnewline
13 & -0.224682 & -2.3241 & 0.011004 \tabularnewline
14 & -0.188774 & -1.9527 & 0.026734 \tabularnewline
15 & -0.063958 & -0.6616 & 0.254828 \tabularnewline
16 & -0.021128 & -0.2186 & 0.413708 \tabularnewline
17 & -0.016214 & -0.1677 & 0.433559 \tabularnewline
18 & -0.182076 & -1.8834 & 0.03118 \tabularnewline
19 & -0.022558 & -0.2333 & 0.407972 \tabularnewline
20 & -0.095943 & -0.9924 & 0.161612 \tabularnewline
21 & -0.101268 & -1.0475 & 0.148608 \tabularnewline
22 & -0.046893 & -0.4851 & 0.314311 \tabularnewline
23 & -0.093285 & -0.9649 & 0.168373 \tabularnewline
24 & 0.043057 & 0.4454 & 0.328472 \tabularnewline
25 & 0.053252 & 0.5508 & 0.291444 \tabularnewline
26 & 0.011798 & 0.122 & 0.451548 \tabularnewline
27 & -0.071177 & -0.7363 & 0.23159 \tabularnewline
28 & 0.002838 & 0.0294 & 0.488318 \tabularnewline
29 & -0.053954 & -0.5581 & 0.288968 \tabularnewline
30 & -0.091433 & -0.9458 & 0.173192 \tabularnewline
31 & 0.012523 & 0.1295 & 0.448587 \tabularnewline
32 & 0.012709 & 0.1315 & 0.447828 \tabularnewline
33 & 0.186245 & 1.9265 & 0.028345 \tabularnewline
34 & 0.1217 & 1.2589 & 0.105407 \tabularnewline
35 & -0.016193 & -0.1675 & 0.433646 \tabularnewline
36 & 0.058227 & 0.6023 & 0.274122 \tabularnewline
37 & -0.052121 & -0.5391 & 0.295453 \tabularnewline
38 & -0.040017 & -0.4139 & 0.339874 \tabularnewline
39 & 0.017208 & 0.178 & 0.429529 \tabularnewline
40 & -0.048463 & -0.5013 & 0.308591 \tabularnewline
41 & 0.015997 & 0.1655 & 0.434442 \tabularnewline
42 & -0.104127 & -1.0771 & 0.141929 \tabularnewline
43 & 0.070209 & 0.7262 & 0.234636 \tabularnewline
44 & -0.023636 & -0.2445 & 0.40366 \tabularnewline
45 & 0.026336 & 0.2724 & 0.392911 \tabularnewline
46 & 0.010124 & 0.1047 & 0.458397 \tabularnewline
47 & -0.129991 & -1.3446 & 0.090793 \tabularnewline
48 & 0.063032 & 0.652 & 0.257897 \tabularnewline
\hline
\end{tabular}
%Source: https://freestatistics.org/blog/index.php?pk=287266&T=2

[TABLE]
[ROW][C]Partial Autocorrelation Function[/C][/ROW]
[ROW][C]Time lag k[/C][C]PACF(k)[/C][C]T-STAT[/C][C]P-value[/C][/ROW]
[ROW][C]1[/C][C]0.127806[/C][C]1.322[/C][C]0.094487[/C][/ROW]
[ROW][C]2[/C][C]-0.261637[/C][C]-2.7064[/C][C]0.003959[/C][/ROW]
[ROW][C]3[/C][C]-0.084602[/C][C]-0.8751[/C][C]0.191733[/C][/ROW]
[ROW][C]4[/C][C]-0.231919[/C][C]-2.399[/C][C]0.009085[/C][/ROW]
[ROW][C]5[/C][C]0.1998[/C][C]2.0667[/C][C]0.020586[/C][/ROW]
[ROW][C]6[/C][C]0.42083[/C][C]4.3531[/C][C]1.5e-05[/C][/ROW]
[ROW][C]7[/C][C]0.173258[/C][C]1.7922[/C][C]0.037964[/C][/ROW]
[ROW][C]8[/C][C]0.014601[/C][C]0.151[/C][C]0.440115[/C][/ROW]
[ROW][C]9[/C][C]-0.057025[/C][C]-0.5899[/C][C]0.278259[/C][/ROW]
[ROW][C]10[/C][C]-0.302786[/C][C]-3.132[/C][C]0.00112[/C][/ROW]
[ROW][C]11[/C][C]-0.104479[/C][C]-1.0807[/C][C]0.141123[/C][/ROW]
[ROW][C]12[/C][C]0.517391[/C][C]5.3519[/C][C]0[/C][/ROW]
[ROW][C]13[/C][C]-0.224682[/C][C]-2.3241[/C][C]0.011004[/C][/ROW]
[ROW][C]14[/C][C]-0.188774[/C][C]-1.9527[/C][C]0.026734[/C][/ROW]
[ROW][C]15[/C][C]-0.063958[/C][C]-0.6616[/C][C]0.254828[/C][/ROW]
[ROW][C]16[/C][C]-0.021128[/C][C]-0.2186[/C][C]0.413708[/C][/ROW]
[ROW][C]17[/C][C]-0.016214[/C][C]-0.1677[/C][C]0.433559[/C][/ROW]
[ROW][C]18[/C][C]-0.182076[/C][C]-1.8834[/C][C]0.03118[/C][/ROW]
[ROW][C]19[/C][C]-0.022558[/C][C]-0.2333[/C][C]0.407972[/C][/ROW]
[ROW][C]20[/C][C]-0.095943[/C][C]-0.9924[/C][C]0.161612[/C][/ROW]
[ROW][C]21[/C][C]-0.101268[/C][C]-1.0475[/C][C]0.148608[/C][/ROW]
[ROW][C]22[/C][C]-0.046893[/C][C]-0.4851[/C][C]0.314311[/C][/ROW]
[ROW][C]23[/C][C]-0.093285[/C][C]-0.9649[/C][C]0.168373[/C][/ROW]
[ROW][C]24[/C][C]0.043057[/C][C]0.4454[/C][C]0.328472[/C][/ROW]
[ROW][C]25[/C][C]0.053252[/C][C]0.5508[/C][C]0.291444[/C][/ROW]
[ROW][C]26[/C][C]0.011798[/C][C]0.122[/C][C]0.451548[/C][/ROW]
[ROW][C]27[/C][C]-0.071177[/C][C]-0.7363[/C][C]0.23159[/C][/ROW]
[ROW][C]28[/C][C]0.002838[/C][C]0.0294[/C][C]0.488318[/C][/ROW]
[ROW][C]29[/C][C]-0.053954[/C][C]-0.5581[/C][C]0.288968[/C][/ROW]
[ROW][C]30[/C][C]-0.091433[/C][C]-0.9458[/C][C]0.173192[/C][/ROW]
[ROW][C]31[/C][C]0.012523[/C][C]0.1295[/C][C]0.448587[/C][/ROW]
[ROW][C]32[/C][C]0.012709[/C][C]0.1315[/C][C]0.447828[/C][/ROW]
[ROW][C]33[/C][C]0.186245[/C][C]1.9265[/C][C]0.028345[/C][/ROW]
[ROW][C]34[/C][C]0.1217[/C][C]1.2589[/C][C]0.105407[/C][/ROW]
[ROW][C]35[/C][C]-0.016193[/C][C]-0.1675[/C][C]0.433646[/C][/ROW]
[ROW][C]36[/C][C]0.058227[/C][C]0.6023[/C][C]0.274122[/C][/ROW]
[ROW][C]37[/C][C]-0.052121[/C][C]-0.5391[/C][C]0.295453[/C][/ROW]
[ROW][C]38[/C][C]-0.040017[/C][C]-0.4139[/C][C]0.339874[/C][/ROW]
[ROW][C]39[/C][C]0.017208[/C][C]0.178[/C][C]0.429529[/C][/ROW]
[ROW][C]40[/C][C]-0.048463[/C][C]-0.5013[/C][C]0.308591[/C][/ROW]
[ROW][C]41[/C][C]0.015997[/C][C]0.1655[/C][C]0.434442[/C][/ROW]
[ROW][C]42[/C][C]-0.104127[/C][C]-1.0771[/C][C]0.141929[/C][/ROW]
[ROW][C]43[/C][C]0.070209[/C][C]0.7262[/C][C]0.234636[/C][/ROW]
[ROW][C]44[/C][C]-0.023636[/C][C]-0.2445[/C][C]0.40366[/C][/ROW]
[ROW][C]45[/C][C]0.026336[/C][C]0.2724[/C][C]0.392911[/C][/ROW]
[ROW][C]46[/C][C]0.010124[/C][C]0.1047[/C][C]0.458397[/C][/ROW]
[ROW][C]47[/C][C]-0.129991[/C][C]-1.3446[/C][C]0.090793[/C][/ROW]
[ROW][C]48[/C][C]0.063032[/C][C]0.652[/C][C]0.257897[/C][/ROW]
[/TABLE]
Source: https://freestatistics.org/blog/index.php?pk=287266&T=2

Globally Unique Identifier (entire table): ba.freestatistics.org/blog/index.php?pk=287266&T=2

As an alternative you can also use a QR Code:  

The GUIDs for individual cells are displayed in the table below:

Partial Autocorrelation Function
Time lag kPACF(k)T-STATP-value
10.1278061.3220.094487
2-0.261637-2.70640.003959
3-0.084602-0.87510.191733
4-0.231919-2.3990.009085
50.19982.06670.020586
60.420834.35311.5e-05
70.1732581.79220.037964
80.0146010.1510.440115
9-0.057025-0.58990.278259
10-0.302786-3.1320.00112
11-0.104479-1.08070.141123
120.5173915.35190
13-0.224682-2.32410.011004
14-0.188774-1.95270.026734
15-0.063958-0.66160.254828
16-0.021128-0.21860.413708
17-0.016214-0.16770.433559
18-0.182076-1.88340.03118
19-0.022558-0.23330.407972
20-0.095943-0.99240.161612
21-0.101268-1.04750.148608
22-0.046893-0.48510.314311
23-0.093285-0.96490.168373
240.0430570.44540.328472
250.0532520.55080.291444
260.0117980.1220.451548
27-0.071177-0.73630.23159
280.0028380.02940.488318
29-0.053954-0.55810.288968
30-0.091433-0.94580.173192
310.0125230.12950.448587
320.0127090.13150.447828
330.1862451.92650.028345
340.12171.25890.105407
35-0.016193-0.16750.433646
360.0582270.60230.274122
37-0.052121-0.53910.295453
38-0.040017-0.41390.339874
390.0172080.1780.429529
40-0.048463-0.50130.308591
410.0159970.16550.434442
42-0.104127-1.07710.141929
430.0702090.72620.234636
44-0.023636-0.24450.40366
450.0263360.27240.392911
460.0101240.10470.458397
47-0.129991-1.34460.090793
480.0630320.6520.257897


Parameters (Session):
par1 = 48 ; par2 = 1 ; par3 = 1 ; par4 = 0 ; par5 = 12 ; par6 = White Noise ; par7 = 0.95 ;
Parameters (R input):
par1 = 48 ; par2 = 1 ; par3 = 1 ; par4 = 0 ; par5 = 12 ; par6 = White Noise ; par7 = 0.95 ; par8 = ;
R code (references can be found in the software module):
if (par1 == 'Default') {
par1 = 10*log10(length(x))
} else {
par1 <- as.numeric(par1)
}
par2 <- as.numeric(par2)
par3 <- as.numeric(par3)
par4 <- as.numeric(par4)
par5 <- as.numeric(par5)
if (par6 == 'White Noise') par6 <- 'white' else par6 <- 'ma'
par7 <- as.numeric(par7)
if (par8 != '') par8 <- as.numeric(par8)
x <- na.omit(x)
ox <- x
if (par8 == '') {
if (par2 == 0) {
x <- log(x)
} else {
x <- (x ^ par2 - 1) / par2
}
} else {
x <- log(x,base=par8)
}
if (par3 > 0) x <- diff(x,lag=1,difference=par3)
if (par4 > 0) x <- diff(x,lag=par5,difference=par4)
bitmap(file='picts.png')
op <- par(mfrow=c(2,1))
plot(ox,type='l',main='Original Time Series',xlab='time',ylab='value')
if (par8=='') {
mytitle <- paste('Working Time Series (lambda=',par2,', d=',par3,', D=',par4,')',sep='')
mysub <- paste('(lambda=',par2,', d=',par3,', D=',par4,', CI=', par7, ', CI type=',par6,')',sep='')
} else {
mytitle <- paste('Working Time Series (base=',par8,', d=',par3,', D=',par4,')',sep='')
mysub <- paste('(base=',par8,', d=',par3,', D=',par4,', CI=', par7, ', CI type=',par6,')',sep='')
}
plot(x,type='l', main=mytitle,xlab='time',ylab='value')
par(op)
dev.off()
bitmap(file='pic1.png')
racf <- acf(x, par1, main='Autocorrelation', xlab='time lag', ylab='ACF', ci.type=par6, ci=par7, sub=mysub)
dev.off()
bitmap(file='pic2.png')
rpacf <- pacf(x,par1,main='Partial Autocorrelation',xlab='lags',ylab='PACF',sub=mysub)
dev.off()
(myacf <- c(racf$acf))
(mypacf <- c(rpacf$acf))
lengthx <- length(x)
sqrtn <- sqrt(lengthx)
load(file='createtable')
a<-table.start()
a<-table.row.start(a)
a<-table.element(a,'Autocorrelation Function',4,TRUE)
a<-table.row.end(a)
a<-table.row.start(a)
a<-table.element(a,'Time lag k',header=TRUE)
a<-table.element(a,hyperlink('basics.htm','ACF(k)','click here for more information about the Autocorrelation Function'),header=TRUE)
a<-table.element(a,'T-STAT',header=TRUE)
a<-table.element(a,'P-value',header=TRUE)
a<-table.row.end(a)
for (i in 2:(par1+1)) {
a<-table.row.start(a)
a<-table.element(a,i-1,header=TRUE)
a<-table.element(a,round(myacf[i],6))
mytstat <- myacf[i]*sqrtn
a<-table.element(a,round(mytstat,4))
a<-table.element(a,round(1-pt(abs(mytstat),lengthx),6))
a<-table.row.end(a)
}
a<-table.end(a)
table.save(a,file='mytable.tab')
a<-table.start()
a<-table.row.start(a)
a<-table.element(a,'Partial Autocorrelation Function',4,TRUE)
a<-table.row.end(a)
a<-table.row.start(a)
a<-table.element(a,'Time lag k',header=TRUE)
a<-table.element(a,hyperlink('basics.htm','PACF(k)','click here for more information about the Partial Autocorrelation Function'),header=TRUE)
a<-table.element(a,'T-STAT',header=TRUE)
a<-table.element(a,'P-value',header=TRUE)
a<-table.row.end(a)
for (i in 1:par1) {
a<-table.row.start(a)
a<-table.element(a,i,header=TRUE)
a<-table.element(a,round(mypacf[i],6))
mytstat <- mypacf[i]*sqrtn
a<-table.element(a,round(mytstat,4))
a<-table.element(a,round(1-pt(abs(mytstat),lengthx),6))
a<-table.row.end(a)
}
a<-table.end(a)
table.save(a,file='mytable1.tab')