Free Statistics
of Irreproducible Research!
Description of Statistical Computation | |||||||||||||||||||||||||||||||||
|---|---|---|---|---|---|---|---|---|---|---|---|---|---|---|---|---|---|---|---|---|---|---|---|---|---|---|---|---|---|---|---|---|---|
| Author's title | |||||||||||||||||||||||||||||||||
| Author | *Unverified author* | ||||||||||||||||||||||||||||||||
| R Software Module | rwasp_meanversusmedian.wasp | ||||||||||||||||||||||||||||||||
| Title produced by software | Mean versus Median | ||||||||||||||||||||||||||||||||
| Date of computation | Thu, 07 Jan 2016 00:06:10 +0000 | ||||||||||||||||||||||||||||||||
| Cite this page as follows | Statistical Computations at FreeStatistics.org, Office for Research Development and Education, URL https://freestatistics.org/blog/index.php?v=date/2016/Jan/07/t14521252555n6yermcxieuz8g.htm/, Retrieved Sat, 27 Apr 2024 18:29:24 +0000 | ||||||||||||||||||||||||||||||||
| Statistical Computations at FreeStatistics.org, Office for Research Development and Education, URL https://freestatistics.org/blog/index.php?pk=287362, Retrieved Sat, 27 Apr 2024 18:29:24 +0000 | |||||||||||||||||||||||||||||||||
| QR Codes: | |||||||||||||||||||||||||||||||||
|
| |||||||||||||||||||||||||||||||||
| Original text written by user: | |||||||||||||||||||||||||||||||||
| IsPrivate? | No (this computation is public) | ||||||||||||||||||||||||||||||||
| User-defined keywords | |||||||||||||||||||||||||||||||||
| Estimated Impact | 101 | ||||||||||||||||||||||||||||||||
Tree of Dependent Computations | |||||||||||||||||||||||||||||||||
| Family? (F = Feedback message, R = changed R code, M = changed R Module, P = changed Parameters, D = changed Data) | |||||||||||||||||||||||||||||||||
| - [Mean versus Median] [] [2016-01-07 00:06:10] [6520bd704600aa2d143562671c58b650] [Current] | |||||||||||||||||||||||||||||||||
| Feedback Forum | |||||||||||||||||||||||||||||||||
Post a new message | |||||||||||||||||||||||||||||||||
Dataset | |||||||||||||||||||||||||||||||||
| Dataseries X: | |||||||||||||||||||||||||||||||||
13408 7820 9079 8307 7865 10028 9054 7143 8006 7638 7600 2904 13224 8079 9678 7746 9007 8362 7458 7753 7352 7117 6971 3304 11812 6867 8296 6489 7784 7506 6514 6323 6201 7169 6744 2087 10668 6406 7730 7105 7694 7160 6820 6025 5877 7191 5778 2273 11321 6759 7150 6363 6442 6453 6228 5325 6504 6817 5789 1894 11068 7174 8269 7060 6681 8953 7815 5925 6805 7044 7169 2824 10717 5245 6237 5871 5508 15801 1236 2656 3425 3533 4287 1380 8584 5522 6423 5173 5583 5716 4752 4977 4999 5285 5747 1713 9923 6737 7433 6388 6855 7658 6585 6847 6353 7361 6929 1714 11798 8378 8131 7676 7505 8168 6455 6141 6554 6888 5339 1624 9187 5047 5289 4169 3862 4253 3768 3066 4108 3890 3420 1221 5984 4064 5151 4027 3530 4819 3855 3584 4322 4154 4656 1464 7780 5060 6084 4778 4989 4903 4142 4101 4595 5034 5407 1782 8395 5291 6116 4210 4621 5299 4293 4542 3831 4360 4088 1508 6743 4159 5105 4283 4019 4206 3948 3407 3701 4159 4208 2622 6229 4432 4986 4226 4349 4688 4002 3381 4250 4154 4350 2713 | |||||||||||||||||||||||||||||||||
Tables (Output of Computation) | |||||||||||||||||||||||||||||||||
| |||||||||||||||||||||||||||||||||
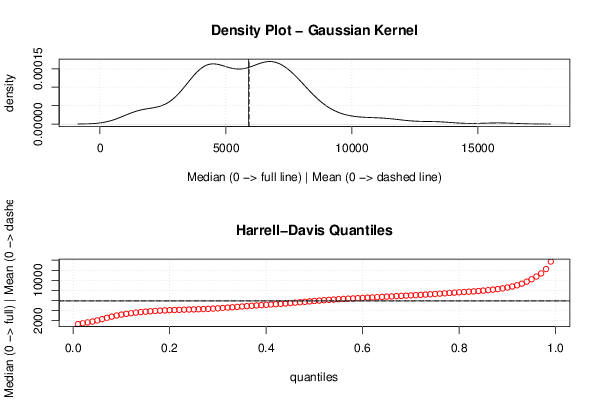
Figures (Output of Computation) | |||||||||||||||||||||||||||||||||
Input Parameters & R Code | |||||||||||||||||||||||||||||||||
| Parameters (Session): | |||||||||||||||||||||||||||||||||
| Parameters (R input): | |||||||||||||||||||||||||||||||||
| R code (references can be found in the software module): | |||||||||||||||||||||||||||||||||
library(Hmisc) | |||||||||||||||||||||||||||||||||