Free Statistics
of Irreproducible Research!
Description of Statistical Computation | |||||||||||||||||||||
|---|---|---|---|---|---|---|---|---|---|---|---|---|---|---|---|---|---|---|---|---|---|
| Author's title | |||||||||||||||||||||
| Author | *The author of this computation has been verified* | ||||||||||||||||||||
| R Software Module | rwasp_skewness_kurtosis_plot.wasp | ||||||||||||||||||||
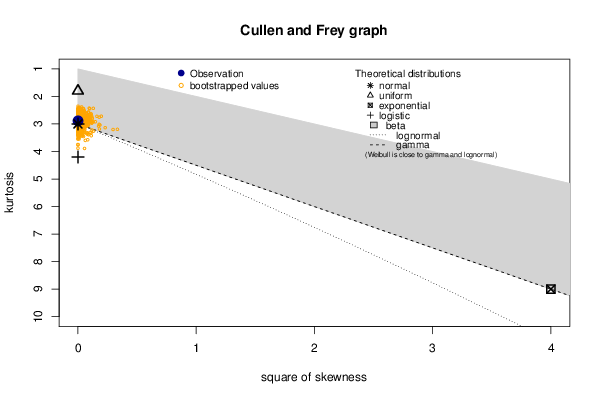
| Title produced by software | Skewness-Kurtosis Plot | ||||||||||||||||||||
| Date of computation | Thu, 07 Jan 2016 13:39:25 +0000 | ||||||||||||||||||||
| Cite this page as follows | Statistical Computations at FreeStatistics.org, Office for Research Development and Education, URL https://freestatistics.org/blog/index.php?v=date/2016/Jan/07/t1452176791q9v690xekqrpnjk.htm/, Retrieved Sat, 27 Apr 2024 17:45:41 +0000 | ||||||||||||||||||||
| Statistical Computations at FreeStatistics.org, Office for Research Development and Education, URL https://freestatistics.org/blog/index.php?pk=287378, Retrieved Sat, 27 Apr 2024 17:45:41 +0000 | |||||||||||||||||||||
| QR Codes: | |||||||||||||||||||||
|
| |||||||||||||||||||||
| Original text written by user: | |||||||||||||||||||||
| IsPrivate? | No (this computation is public) | ||||||||||||||||||||
| User-defined keywords | |||||||||||||||||||||
| Estimated Impact | 105 | ||||||||||||||||||||
Tree of Dependent Computations | |||||||||||||||||||||
| Family? (F = Feedback message, R = changed R code, M = changed R Module, P = changed Parameters, D = changed Data) | |||||||||||||||||||||
| - [Skewness-Kurtosis Plot] [] [2016-01-07 13:39:25] [9c6885c821bcaafa868d1b0892651286] [Current] | |||||||||||||||||||||
| Feedback Forum | |||||||||||||||||||||
Post a new message | |||||||||||||||||||||
Dataset | |||||||||||||||||||||
| Dataseries X: | |||||||||||||||||||||
-0.6729451548 -0.1193067403 -0.2830954818 0.02681598656 0.8402541865 0.4817099843 2.053459492 -0.2840155167 -1.124324017 -0.6453491642 0.2073541255 0.06346372041 -0.283542142 2.142049243 1.220533657 -0.8480546684 -0.1072465898 -0.09232074063 0.120057526 1.159006903 -0.1584778768 0.2924397022 0.1950765842 0.3801830971 0.3006946497 -2.095387402 2.008186058 -0.513588139 0.4377125287 0.9444973362 0.141152937 0.0158560277 -0.2875563801 0.06341920825 0.675018179 0.100099287 -0.5255282368 -0.5428868712 -0.5954251846 -0.5752823297 -1.705237965 0.1934827267 -0.212779886 0.4242257303 0.03170076787 1.774733772 0.6261831472 0.7113977891 -0.3684894468 -1.066116601 -0.5118725211 0.7409645372 -0.3369596473 -0.3343565053 -2.144871415 -0.2923161054 -0.413069765 -0.5083203184 0.01102652683 0.6787874627 -0.2408481109 -0.03975504078 -1.337846851 0.9608020871 0.168923334 1.380188857 1.292435202 -1.299254315 -2.08900082 -0.2106593151 1.252871229 -1.278301146 -0.6076647216 -0.8427312484 0.5853846569 0.5927509837 1.273129196 0.8224140021 -0.4189491324 -0.06667825162 -0.8577649273 2.163598818 0.07270022977 -0.04814273721 1.92695359 -1.494089222 -0.5381048616 1.218901189 1.03719719 -1.739038524 0.4802829326 0.6745414451 0.2440299096 0.3015202501 -1.314676841 0.8702311657 0.2925825708 0.5705232255 0.6903903851 0.4449851729 1.249342826 -0.0755433988 0.1292516005 -1.164048989 1.583819977 1.211115989 -1.645081416 -0.7766444451 -0.01541463579 -1.418260206 -1.127124234 0.7098261804 0.9096870672 0.03751832807 -0.491317445 0.7340869112 -1.128559839 0.2104773419 0.3099509322 -0.2809701116 0.4555917049 1.378736844 -0.8173020273 0.9541615794 1.074860786 0.7161450505 -0.7379264385 -0.2875758709 0.4568534209 -1.223712902 0.01746240871 0.6013914659 -0.1336471399 -0.789131299 -0.9080375622 0.1488408781 2.061984336 1.722475118 -1.123763555 -0.3773008195 -0.01274457306 -0.7482951033 -1.183259736 -1.914636274 0.1959707089 -0.6013213306 -0.541675064 0.6823992444 1.012022087 0.07892278957 | |||||||||||||||||||||
Tables (Output of Computation) | |||||||||||||||||||||
| |||||||||||||||||||||
Figures (Output of Computation) | |||||||||||||||||||||
Input Parameters & R Code | |||||||||||||||||||||
| Parameters (Session): | |||||||||||||||||||||
| par1 = grey ; par2 = no ; | |||||||||||||||||||||
| Parameters (R input): | |||||||||||||||||||||
| R code (references can be found in the software module): | |||||||||||||||||||||
library(fitdistrplus) | |||||||||||||||||||||