Free Statistics

of Irreproducible Research!

Author's title

Author*Unverified author*
R Software Modulerwasp_autocorrelation.wasp
Title produced by software(Partial) Autocorrelation Function
Date of computationFri, 08 Jan 2016 12:21:15 +0000
Cite this page as followsStatistical Computations at FreeStatistics.org, Office for Research Development and Education, URL https://freestatistics.org/blog/index.php?v=date/2016/Jan/08/t1452255728e7st2mzge7lmwlb.htm/, Retrieved Sun, 28 Apr 2024 18:54:01 +0000
Statistical Computations at FreeStatistics.org, Office for Research Development and Education, URL https://freestatistics.org/blog/index.php?pk=287412, Retrieved Sun, 28 Apr 2024 18:54:01 +0000
QR Codes:

Original text written by user:
IsPrivate?No (this computation is public)
User-defined keywords
Estimated Impact143
Family? (F = Feedback message, R = changed R code, M = changed R Module, P = changed Parameters, D = changed Data)
-       [(Partial) Autocorrelation Function] [] [2016-01-08 12:21:15] [f684f3a3d8618606ffff76ddc8e0eec7] [Current]
Feedback Forum

Post a new message
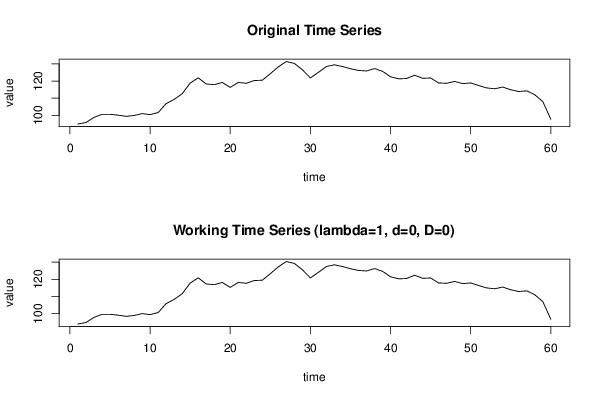
Dataseries X:
94,9
95,8
98,8
100,6
100,6
100,1
99,4
99,9
101
100,4
101,6
106,8
109,3
112,6
118,8
121,9
118,3
117,9
119,2
116,3
119,2
118,7
120,3
120,5
124,3
128,3
131,4
130,3
126,6
121,8
125,1
128,5
129,5
128,5
127,2
126,2
125,9
127,3
125,7
122,5
121,3
121,5
123,4
121,6
121,8
118,9
118,7
119,8
118,5
118,9
117,4
116
115,5
116,5
114,9
113,9
114,3
112
108
97,7


Summary of computational transaction
Raw Inputview raw input (R code)
Raw Outputview raw output of R engine
Computing time2 seconds
R Server'Gwilym Jenkins' @ jenkins.wessa.net

\begin{tabular}{lllllllll}
\hline
Summary of computational transaction \tabularnewline
Raw Input & view raw input (R code)  \tabularnewline
Raw Output & view raw output of R engine  \tabularnewline
Computing time & 2 seconds \tabularnewline
R Server & 'Gwilym Jenkins' @ jenkins.wessa.net \tabularnewline
\hline
\end{tabular}
%Source: https://freestatistics.org/blog/index.php?pk=287412&T=0

[TABLE]
[ROW][C]Summary of computational transaction[/C][/ROW]
[ROW][C]Raw Input[/C][C]view raw input (R code) [/C][/ROW]
[ROW][C]Raw Output[/C][C]view raw output of R engine [/C][/ROW]
[ROW][C]Computing time[/C][C]2 seconds[/C][/ROW]
[ROW][C]R Server[/C][C]'Gwilym Jenkins' @ jenkins.wessa.net[/C][/ROW]
[/TABLE]
Source: https://freestatistics.org/blog/index.php?pk=287412&T=0

Globally Unique Identifier (entire table): ba.freestatistics.org/blog/index.php?pk=287412&T=0

As an alternative you can also use a QR Code:  

The GUIDs for individual cells are displayed in the table below:

Summary of computational transaction
Raw Inputview raw input (R code)
Raw Outputview raw output of R engine
Computing time2 seconds
R Server'Gwilym Jenkins' @ jenkins.wessa.net


Autocorrelation Function
Time lag kACF(k)T-STATP-value
10.8980636.95640
20.8063486.24590
30.7333415.68040
40.6771195.24491e-06
50.618774.7936e-06
60.5575644.31893e-05
70.4905153.79950.000171
80.4153163.2170.001045
90.3491682.70460.004443
100.2811042.17740.016696
110.2075051.60730.056617
120.1315181.01870.156209
130.0528640.40950.34182
14-0.022157-0.17160.432154
15-0.069831-0.54090.295286
16-0.090184-0.69860.243761
17-0.13001-1.0070.158977
18-0.166475-1.28950.101085
19-0.204498-1.5840.059222
20-0.25847-2.00210.0249
21-0.303965-2.35450.010919
22-0.340241-2.63550.005338
23-0.370071-2.86660.002858
24-0.409562-3.17250.001192
25-0.435504-3.37340.000653
26-0.437118-3.38590.000628
27-0.41644-3.22570.001018
28-0.38831-3.00780.00192
29-0.367555-2.84710.003016
30-0.375769-2.91070.002527
31-0.390408-3.02410.001833
32-0.379849-2.94230.002313
33-0.349215-2.7050.004438
34-0.307829-2.38440.010142
35-0.268961-2.08340.020743
36-0.238795-1.84970.034642
37-0.217515-1.68490.048605
38-0.181461-1.40560.082501
39-0.154634-1.19780.117854
40-0.133947-1.03750.151822
41-0.127745-0.98950.163195
42-0.108679-0.84180.201615
43-0.087645-0.67890.249907
44-0.070394-0.54530.293796
45-0.02909-0.22530.411246
460.005250.04070.483848
470.0292440.22650.410782
480.0560740.43430.332797

\begin{tabular}{lllllllll}
\hline
Autocorrelation Function \tabularnewline
Time lag k & ACF(k) & T-STAT & P-value \tabularnewline
1 & 0.898063 & 6.9564 & 0 \tabularnewline
2 & 0.806348 & 6.2459 & 0 \tabularnewline
3 & 0.733341 & 5.6804 & 0 \tabularnewline
4 & 0.677119 & 5.2449 & 1e-06 \tabularnewline
5 & 0.61877 & 4.793 & 6e-06 \tabularnewline
6 & 0.557564 & 4.3189 & 3e-05 \tabularnewline
7 & 0.490515 & 3.7995 & 0.000171 \tabularnewline
8 & 0.415316 & 3.217 & 0.001045 \tabularnewline
9 & 0.349168 & 2.7046 & 0.004443 \tabularnewline
10 & 0.281104 & 2.1774 & 0.016696 \tabularnewline
11 & 0.207505 & 1.6073 & 0.056617 \tabularnewline
12 & 0.131518 & 1.0187 & 0.156209 \tabularnewline
13 & 0.052864 & 0.4095 & 0.34182 \tabularnewline
14 & -0.022157 & -0.1716 & 0.432154 \tabularnewline
15 & -0.069831 & -0.5409 & 0.295286 \tabularnewline
16 & -0.090184 & -0.6986 & 0.243761 \tabularnewline
17 & -0.13001 & -1.007 & 0.158977 \tabularnewline
18 & -0.166475 & -1.2895 & 0.101085 \tabularnewline
19 & -0.204498 & -1.584 & 0.059222 \tabularnewline
20 & -0.25847 & -2.0021 & 0.0249 \tabularnewline
21 & -0.303965 & -2.3545 & 0.010919 \tabularnewline
22 & -0.340241 & -2.6355 & 0.005338 \tabularnewline
23 & -0.370071 & -2.8666 & 0.002858 \tabularnewline
24 & -0.409562 & -3.1725 & 0.001192 \tabularnewline
25 & -0.435504 & -3.3734 & 0.000653 \tabularnewline
26 & -0.437118 & -3.3859 & 0.000628 \tabularnewline
27 & -0.41644 & -3.2257 & 0.001018 \tabularnewline
28 & -0.38831 & -3.0078 & 0.00192 \tabularnewline
29 & -0.367555 & -2.8471 & 0.003016 \tabularnewline
30 & -0.375769 & -2.9107 & 0.002527 \tabularnewline
31 & -0.390408 & -3.0241 & 0.001833 \tabularnewline
32 & -0.379849 & -2.9423 & 0.002313 \tabularnewline
33 & -0.349215 & -2.705 & 0.004438 \tabularnewline
34 & -0.307829 & -2.3844 & 0.010142 \tabularnewline
35 & -0.268961 & -2.0834 & 0.020743 \tabularnewline
36 & -0.238795 & -1.8497 & 0.034642 \tabularnewline
37 & -0.217515 & -1.6849 & 0.048605 \tabularnewline
38 & -0.181461 & -1.4056 & 0.082501 \tabularnewline
39 & -0.154634 & -1.1978 & 0.117854 \tabularnewline
40 & -0.133947 & -1.0375 & 0.151822 \tabularnewline
41 & -0.127745 & -0.9895 & 0.163195 \tabularnewline
42 & -0.108679 & -0.8418 & 0.201615 \tabularnewline
43 & -0.087645 & -0.6789 & 0.249907 \tabularnewline
44 & -0.070394 & -0.5453 & 0.293796 \tabularnewline
45 & -0.02909 & -0.2253 & 0.411246 \tabularnewline
46 & 0.00525 & 0.0407 & 0.483848 \tabularnewline
47 & 0.029244 & 0.2265 & 0.410782 \tabularnewline
48 & 0.056074 & 0.4343 & 0.332797 \tabularnewline
\hline
\end{tabular}
%Source: https://freestatistics.org/blog/index.php?pk=287412&T=1

[TABLE]
[ROW][C]Autocorrelation Function[/C][/ROW]
[ROW][C]Time lag k[/C][C]ACF(k)[/C][C]T-STAT[/C][C]P-value[/C][/ROW]
[ROW][C]1[/C][C]0.898063[/C][C]6.9564[/C][C]0[/C][/ROW]
[ROW][C]2[/C][C]0.806348[/C][C]6.2459[/C][C]0[/C][/ROW]
[ROW][C]3[/C][C]0.733341[/C][C]5.6804[/C][C]0[/C][/ROW]
[ROW][C]4[/C][C]0.677119[/C][C]5.2449[/C][C]1e-06[/C][/ROW]
[ROW][C]5[/C][C]0.61877[/C][C]4.793[/C][C]6e-06[/C][/ROW]
[ROW][C]6[/C][C]0.557564[/C][C]4.3189[/C][C]3e-05[/C][/ROW]
[ROW][C]7[/C][C]0.490515[/C][C]3.7995[/C][C]0.000171[/C][/ROW]
[ROW][C]8[/C][C]0.415316[/C][C]3.217[/C][C]0.001045[/C][/ROW]
[ROW][C]9[/C][C]0.349168[/C][C]2.7046[/C][C]0.004443[/C][/ROW]
[ROW][C]10[/C][C]0.281104[/C][C]2.1774[/C][C]0.016696[/C][/ROW]
[ROW][C]11[/C][C]0.207505[/C][C]1.6073[/C][C]0.056617[/C][/ROW]
[ROW][C]12[/C][C]0.131518[/C][C]1.0187[/C][C]0.156209[/C][/ROW]
[ROW][C]13[/C][C]0.052864[/C][C]0.4095[/C][C]0.34182[/C][/ROW]
[ROW][C]14[/C][C]-0.022157[/C][C]-0.1716[/C][C]0.432154[/C][/ROW]
[ROW][C]15[/C][C]-0.069831[/C][C]-0.5409[/C][C]0.295286[/C][/ROW]
[ROW][C]16[/C][C]-0.090184[/C][C]-0.6986[/C][C]0.243761[/C][/ROW]
[ROW][C]17[/C][C]-0.13001[/C][C]-1.007[/C][C]0.158977[/C][/ROW]
[ROW][C]18[/C][C]-0.166475[/C][C]-1.2895[/C][C]0.101085[/C][/ROW]
[ROW][C]19[/C][C]-0.204498[/C][C]-1.584[/C][C]0.059222[/C][/ROW]
[ROW][C]20[/C][C]-0.25847[/C][C]-2.0021[/C][C]0.0249[/C][/ROW]
[ROW][C]21[/C][C]-0.303965[/C][C]-2.3545[/C][C]0.010919[/C][/ROW]
[ROW][C]22[/C][C]-0.340241[/C][C]-2.6355[/C][C]0.005338[/C][/ROW]
[ROW][C]23[/C][C]-0.370071[/C][C]-2.8666[/C][C]0.002858[/C][/ROW]
[ROW][C]24[/C][C]-0.409562[/C][C]-3.1725[/C][C]0.001192[/C][/ROW]
[ROW][C]25[/C][C]-0.435504[/C][C]-3.3734[/C][C]0.000653[/C][/ROW]
[ROW][C]26[/C][C]-0.437118[/C][C]-3.3859[/C][C]0.000628[/C][/ROW]
[ROW][C]27[/C][C]-0.41644[/C][C]-3.2257[/C][C]0.001018[/C][/ROW]
[ROW][C]28[/C][C]-0.38831[/C][C]-3.0078[/C][C]0.00192[/C][/ROW]
[ROW][C]29[/C][C]-0.367555[/C][C]-2.8471[/C][C]0.003016[/C][/ROW]
[ROW][C]30[/C][C]-0.375769[/C][C]-2.9107[/C][C]0.002527[/C][/ROW]
[ROW][C]31[/C][C]-0.390408[/C][C]-3.0241[/C][C]0.001833[/C][/ROW]
[ROW][C]32[/C][C]-0.379849[/C][C]-2.9423[/C][C]0.002313[/C][/ROW]
[ROW][C]33[/C][C]-0.349215[/C][C]-2.705[/C][C]0.004438[/C][/ROW]
[ROW][C]34[/C][C]-0.307829[/C][C]-2.3844[/C][C]0.010142[/C][/ROW]
[ROW][C]35[/C][C]-0.268961[/C][C]-2.0834[/C][C]0.020743[/C][/ROW]
[ROW][C]36[/C][C]-0.238795[/C][C]-1.8497[/C][C]0.034642[/C][/ROW]
[ROW][C]37[/C][C]-0.217515[/C][C]-1.6849[/C][C]0.048605[/C][/ROW]
[ROW][C]38[/C][C]-0.181461[/C][C]-1.4056[/C][C]0.082501[/C][/ROW]
[ROW][C]39[/C][C]-0.154634[/C][C]-1.1978[/C][C]0.117854[/C][/ROW]
[ROW][C]40[/C][C]-0.133947[/C][C]-1.0375[/C][C]0.151822[/C][/ROW]
[ROW][C]41[/C][C]-0.127745[/C][C]-0.9895[/C][C]0.163195[/C][/ROW]
[ROW][C]42[/C][C]-0.108679[/C][C]-0.8418[/C][C]0.201615[/C][/ROW]
[ROW][C]43[/C][C]-0.087645[/C][C]-0.6789[/C][C]0.249907[/C][/ROW]
[ROW][C]44[/C][C]-0.070394[/C][C]-0.5453[/C][C]0.293796[/C][/ROW]
[ROW][C]45[/C][C]-0.02909[/C][C]-0.2253[/C][C]0.411246[/C][/ROW]
[ROW][C]46[/C][C]0.00525[/C][C]0.0407[/C][C]0.483848[/C][/ROW]
[ROW][C]47[/C][C]0.029244[/C][C]0.2265[/C][C]0.410782[/C][/ROW]
[ROW][C]48[/C][C]0.056074[/C][C]0.4343[/C][C]0.332797[/C][/ROW]
[/TABLE]
Source: https://freestatistics.org/blog/index.php?pk=287412&T=1

Globally Unique Identifier (entire table): ba.freestatistics.org/blog/index.php?pk=287412&T=1

As an alternative you can also use a QR Code:  

The GUIDs for individual cells are displayed in the table below:

Autocorrelation Function
Time lag kACF(k)T-STATP-value
10.8980636.95640
20.8063486.24590
30.7333415.68040
40.6771195.24491e-06
50.618774.7936e-06
60.5575644.31893e-05
70.4905153.79950.000171
80.4153163.2170.001045
90.3491682.70460.004443
100.2811042.17740.016696
110.2075051.60730.056617
120.1315181.01870.156209
130.0528640.40950.34182
14-0.022157-0.17160.432154
15-0.069831-0.54090.295286
16-0.090184-0.69860.243761
17-0.13001-1.0070.158977
18-0.166475-1.28950.101085
19-0.204498-1.5840.059222
20-0.25847-2.00210.0249
21-0.303965-2.35450.010919
22-0.340241-2.63550.005338
23-0.370071-2.86660.002858
24-0.409562-3.17250.001192
25-0.435504-3.37340.000653
26-0.437118-3.38590.000628
27-0.41644-3.22570.001018
28-0.38831-3.00780.00192
29-0.367555-2.84710.003016
30-0.375769-2.91070.002527
31-0.390408-3.02410.001833
32-0.379849-2.94230.002313
33-0.349215-2.7050.004438
34-0.307829-2.38440.010142
35-0.268961-2.08340.020743
36-0.238795-1.84970.034642
37-0.217515-1.68490.048605
38-0.181461-1.40560.082501
39-0.154634-1.19780.117854
40-0.133947-1.03750.151822
41-0.127745-0.98950.163195
42-0.108679-0.84180.201615
43-0.087645-0.67890.249907
44-0.070394-0.54530.293796
45-0.02909-0.22530.411246
460.005250.04070.483848
470.0292440.22650.410782
480.0560740.43430.332797


Partial Autocorrelation Function
Time lag kPACF(k)T-STATP-value
10.8980636.95640
2-0.000877-0.00680.497303
30.0482840.3740.354859
40.0531770.41190.340937
5-0.028847-0.22340.411972
6-0.035963-0.27860.390766
7-0.063365-0.49080.312672
8-0.091343-0.70750.240984
9-0.015214-0.11780.453292
10-0.068038-0.5270.30006
11-0.084668-0.65580.257219
12-0.071969-0.55750.28964
13-0.089224-0.69110.246077
14-0.062464-0.48380.31513
150.0669580.51870.302955
160.1023350.79270.215543
17-0.094744-0.73390.232938
180.0095910.07430.470512
19-0.044768-0.34680.364989
20-0.154023-1.19310.118772
21-0.041387-0.32060.374821
22-0.051903-0.4020.344542
23-0.045448-0.3520.363021
24-0.098864-0.76580.2234
25-0.020035-0.15520.438596
260.0648950.50270.308516
270.097720.75690.226026
280.0562370.43560.332342
290.0177210.13730.44564
30-0.121035-0.93750.176122
31-0.108629-0.84140.201722
320.0097310.07540.470085
330.0439490.34040.367363
340.0190280.14740.441659
35-0.009981-0.07730.469316
36-0.017459-0.13520.446437
37-0.069529-0.53860.296089
380.0350950.27180.393338
39-0.060224-0.46650.321276
400.0015680.01210.495176
41-0.054776-0.42430.336436
420.0450340.34880.364218
43-0.006332-0.0490.480524
44-0.087933-0.68110.249206
450.0621230.48120.316061
46-0.005642-0.04370.482642
470.0001830.00140.499437
480.0614260.47580.317972

\begin{tabular}{lllllllll}
\hline
Partial Autocorrelation Function \tabularnewline
Time lag k & PACF(k) & T-STAT & P-value \tabularnewline
1 & 0.898063 & 6.9564 & 0 \tabularnewline
2 & -0.000877 & -0.0068 & 0.497303 \tabularnewline
3 & 0.048284 & 0.374 & 0.354859 \tabularnewline
4 & 0.053177 & 0.4119 & 0.340937 \tabularnewline
5 & -0.028847 & -0.2234 & 0.411972 \tabularnewline
6 & -0.035963 & -0.2786 & 0.390766 \tabularnewline
7 & -0.063365 & -0.4908 & 0.312672 \tabularnewline
8 & -0.091343 & -0.7075 & 0.240984 \tabularnewline
9 & -0.015214 & -0.1178 & 0.453292 \tabularnewline
10 & -0.068038 & -0.527 & 0.30006 \tabularnewline
11 & -0.084668 & -0.6558 & 0.257219 \tabularnewline
12 & -0.071969 & -0.5575 & 0.28964 \tabularnewline
13 & -0.089224 & -0.6911 & 0.246077 \tabularnewline
14 & -0.062464 & -0.4838 & 0.31513 \tabularnewline
15 & 0.066958 & 0.5187 & 0.302955 \tabularnewline
16 & 0.102335 & 0.7927 & 0.215543 \tabularnewline
17 & -0.094744 & -0.7339 & 0.232938 \tabularnewline
18 & 0.009591 & 0.0743 & 0.470512 \tabularnewline
19 & -0.044768 & -0.3468 & 0.364989 \tabularnewline
20 & -0.154023 & -1.1931 & 0.118772 \tabularnewline
21 & -0.041387 & -0.3206 & 0.374821 \tabularnewline
22 & -0.051903 & -0.402 & 0.344542 \tabularnewline
23 & -0.045448 & -0.352 & 0.363021 \tabularnewline
24 & -0.098864 & -0.7658 & 0.2234 \tabularnewline
25 & -0.020035 & -0.1552 & 0.438596 \tabularnewline
26 & 0.064895 & 0.5027 & 0.308516 \tabularnewline
27 & 0.09772 & 0.7569 & 0.226026 \tabularnewline
28 & 0.056237 & 0.4356 & 0.332342 \tabularnewline
29 & 0.017721 & 0.1373 & 0.44564 \tabularnewline
30 & -0.121035 & -0.9375 & 0.176122 \tabularnewline
31 & -0.108629 & -0.8414 & 0.201722 \tabularnewline
32 & 0.009731 & 0.0754 & 0.470085 \tabularnewline
33 & 0.043949 & 0.3404 & 0.367363 \tabularnewline
34 & 0.019028 & 0.1474 & 0.441659 \tabularnewline
35 & -0.009981 & -0.0773 & 0.469316 \tabularnewline
36 & -0.017459 & -0.1352 & 0.446437 \tabularnewline
37 & -0.069529 & -0.5386 & 0.296089 \tabularnewline
38 & 0.035095 & 0.2718 & 0.393338 \tabularnewline
39 & -0.060224 & -0.4665 & 0.321276 \tabularnewline
40 & 0.001568 & 0.0121 & 0.495176 \tabularnewline
41 & -0.054776 & -0.4243 & 0.336436 \tabularnewline
42 & 0.045034 & 0.3488 & 0.364218 \tabularnewline
43 & -0.006332 & -0.049 & 0.480524 \tabularnewline
44 & -0.087933 & -0.6811 & 0.249206 \tabularnewline
45 & 0.062123 & 0.4812 & 0.316061 \tabularnewline
46 & -0.005642 & -0.0437 & 0.482642 \tabularnewline
47 & 0.000183 & 0.0014 & 0.499437 \tabularnewline
48 & 0.061426 & 0.4758 & 0.317972 \tabularnewline
\hline
\end{tabular}
%Source: https://freestatistics.org/blog/index.php?pk=287412&T=2

[TABLE]
[ROW][C]Partial Autocorrelation Function[/C][/ROW]
[ROW][C]Time lag k[/C][C]PACF(k)[/C][C]T-STAT[/C][C]P-value[/C][/ROW]
[ROW][C]1[/C][C]0.898063[/C][C]6.9564[/C][C]0[/C][/ROW]
[ROW][C]2[/C][C]-0.000877[/C][C]-0.0068[/C][C]0.497303[/C][/ROW]
[ROW][C]3[/C][C]0.048284[/C][C]0.374[/C][C]0.354859[/C][/ROW]
[ROW][C]4[/C][C]0.053177[/C][C]0.4119[/C][C]0.340937[/C][/ROW]
[ROW][C]5[/C][C]-0.028847[/C][C]-0.2234[/C][C]0.411972[/C][/ROW]
[ROW][C]6[/C][C]-0.035963[/C][C]-0.2786[/C][C]0.390766[/C][/ROW]
[ROW][C]7[/C][C]-0.063365[/C][C]-0.4908[/C][C]0.312672[/C][/ROW]
[ROW][C]8[/C][C]-0.091343[/C][C]-0.7075[/C][C]0.240984[/C][/ROW]
[ROW][C]9[/C][C]-0.015214[/C][C]-0.1178[/C][C]0.453292[/C][/ROW]
[ROW][C]10[/C][C]-0.068038[/C][C]-0.527[/C][C]0.30006[/C][/ROW]
[ROW][C]11[/C][C]-0.084668[/C][C]-0.6558[/C][C]0.257219[/C][/ROW]
[ROW][C]12[/C][C]-0.071969[/C][C]-0.5575[/C][C]0.28964[/C][/ROW]
[ROW][C]13[/C][C]-0.089224[/C][C]-0.6911[/C][C]0.246077[/C][/ROW]
[ROW][C]14[/C][C]-0.062464[/C][C]-0.4838[/C][C]0.31513[/C][/ROW]
[ROW][C]15[/C][C]0.066958[/C][C]0.5187[/C][C]0.302955[/C][/ROW]
[ROW][C]16[/C][C]0.102335[/C][C]0.7927[/C][C]0.215543[/C][/ROW]
[ROW][C]17[/C][C]-0.094744[/C][C]-0.7339[/C][C]0.232938[/C][/ROW]
[ROW][C]18[/C][C]0.009591[/C][C]0.0743[/C][C]0.470512[/C][/ROW]
[ROW][C]19[/C][C]-0.044768[/C][C]-0.3468[/C][C]0.364989[/C][/ROW]
[ROW][C]20[/C][C]-0.154023[/C][C]-1.1931[/C][C]0.118772[/C][/ROW]
[ROW][C]21[/C][C]-0.041387[/C][C]-0.3206[/C][C]0.374821[/C][/ROW]
[ROW][C]22[/C][C]-0.051903[/C][C]-0.402[/C][C]0.344542[/C][/ROW]
[ROW][C]23[/C][C]-0.045448[/C][C]-0.352[/C][C]0.363021[/C][/ROW]
[ROW][C]24[/C][C]-0.098864[/C][C]-0.7658[/C][C]0.2234[/C][/ROW]
[ROW][C]25[/C][C]-0.020035[/C][C]-0.1552[/C][C]0.438596[/C][/ROW]
[ROW][C]26[/C][C]0.064895[/C][C]0.5027[/C][C]0.308516[/C][/ROW]
[ROW][C]27[/C][C]0.09772[/C][C]0.7569[/C][C]0.226026[/C][/ROW]
[ROW][C]28[/C][C]0.056237[/C][C]0.4356[/C][C]0.332342[/C][/ROW]
[ROW][C]29[/C][C]0.017721[/C][C]0.1373[/C][C]0.44564[/C][/ROW]
[ROW][C]30[/C][C]-0.121035[/C][C]-0.9375[/C][C]0.176122[/C][/ROW]
[ROW][C]31[/C][C]-0.108629[/C][C]-0.8414[/C][C]0.201722[/C][/ROW]
[ROW][C]32[/C][C]0.009731[/C][C]0.0754[/C][C]0.470085[/C][/ROW]
[ROW][C]33[/C][C]0.043949[/C][C]0.3404[/C][C]0.367363[/C][/ROW]
[ROW][C]34[/C][C]0.019028[/C][C]0.1474[/C][C]0.441659[/C][/ROW]
[ROW][C]35[/C][C]-0.009981[/C][C]-0.0773[/C][C]0.469316[/C][/ROW]
[ROW][C]36[/C][C]-0.017459[/C][C]-0.1352[/C][C]0.446437[/C][/ROW]
[ROW][C]37[/C][C]-0.069529[/C][C]-0.5386[/C][C]0.296089[/C][/ROW]
[ROW][C]38[/C][C]0.035095[/C][C]0.2718[/C][C]0.393338[/C][/ROW]
[ROW][C]39[/C][C]-0.060224[/C][C]-0.4665[/C][C]0.321276[/C][/ROW]
[ROW][C]40[/C][C]0.001568[/C][C]0.0121[/C][C]0.495176[/C][/ROW]
[ROW][C]41[/C][C]-0.054776[/C][C]-0.4243[/C][C]0.336436[/C][/ROW]
[ROW][C]42[/C][C]0.045034[/C][C]0.3488[/C][C]0.364218[/C][/ROW]
[ROW][C]43[/C][C]-0.006332[/C][C]-0.049[/C][C]0.480524[/C][/ROW]
[ROW][C]44[/C][C]-0.087933[/C][C]-0.6811[/C][C]0.249206[/C][/ROW]
[ROW][C]45[/C][C]0.062123[/C][C]0.4812[/C][C]0.316061[/C][/ROW]
[ROW][C]46[/C][C]-0.005642[/C][C]-0.0437[/C][C]0.482642[/C][/ROW]
[ROW][C]47[/C][C]0.000183[/C][C]0.0014[/C][C]0.499437[/C][/ROW]
[ROW][C]48[/C][C]0.061426[/C][C]0.4758[/C][C]0.317972[/C][/ROW]
[/TABLE]
Source: https://freestatistics.org/blog/index.php?pk=287412&T=2

Globally Unique Identifier (entire table): ba.freestatistics.org/blog/index.php?pk=287412&T=2

As an alternative you can also use a QR Code:  

The GUIDs for individual cells are displayed in the table below:

Partial Autocorrelation Function
Time lag kPACF(k)T-STATP-value
10.8980636.95640
2-0.000877-0.00680.497303
30.0482840.3740.354859
40.0531770.41190.340937
5-0.028847-0.22340.411972
6-0.035963-0.27860.390766
7-0.063365-0.49080.312672
8-0.091343-0.70750.240984
9-0.015214-0.11780.453292
10-0.068038-0.5270.30006
11-0.084668-0.65580.257219
12-0.071969-0.55750.28964
13-0.089224-0.69110.246077
14-0.062464-0.48380.31513
150.0669580.51870.302955
160.1023350.79270.215543
17-0.094744-0.73390.232938
180.0095910.07430.470512
19-0.044768-0.34680.364989
20-0.154023-1.19310.118772
21-0.041387-0.32060.374821
22-0.051903-0.4020.344542
23-0.045448-0.3520.363021
24-0.098864-0.76580.2234
25-0.020035-0.15520.438596
260.0648950.50270.308516
270.097720.75690.226026
280.0562370.43560.332342
290.0177210.13730.44564
30-0.121035-0.93750.176122
31-0.108629-0.84140.201722
320.0097310.07540.470085
330.0439490.34040.367363
340.0190280.14740.441659
35-0.009981-0.07730.469316
36-0.017459-0.13520.446437
37-0.069529-0.53860.296089
380.0350950.27180.393338
39-0.060224-0.46650.321276
400.0015680.01210.495176
41-0.054776-0.42430.336436
420.0450340.34880.364218
43-0.006332-0.0490.480524
44-0.087933-0.68110.249206
450.0621230.48120.316061
46-0.005642-0.04370.482642
470.0001830.00140.499437
480.0614260.47580.317972


Parameters (Session):
par1 = 48 ; par2 = 1 ; par3 = 0 ; par4 = 0 ; par5 = 12 ; par6 = White Noise ; par7 = 0.95 ;
Parameters (R input):
par1 = 48 ; par2 = 1 ; par3 = 0 ; par4 = 0 ; par5 = 12 ; par6 = White Noise ; par7 = 0.95 ; par8 = ;
R code (references can be found in the software module):
if (par1 == 'Default') {
par1 = 10*log10(length(x))
} else {
par1 <- as.numeric(par1)
}
par2 <- as.numeric(par2)
par3 <- as.numeric(par3)
par4 <- as.numeric(par4)
par5 <- as.numeric(par5)
if (par6 == 'White Noise') par6 <- 'white' else par6 <- 'ma'
par7 <- as.numeric(par7)
if (par8 != '') par8 <- as.numeric(par8)
x <- na.omit(x)
ox <- x
if (par8 == '') {
if (par2 == 0) {
x <- log(x)
} else {
x <- (x ^ par2 - 1) / par2
}
} else {
x <- log(x,base=par8)
}
if (par3 > 0) x <- diff(x,lag=1,difference=par3)
if (par4 > 0) x <- diff(x,lag=par5,difference=par4)
bitmap(file='picts.png')
op <- par(mfrow=c(2,1))
plot(ox,type='l',main='Original Time Series',xlab='time',ylab='value')
if (par8=='') {
mytitle <- paste('Working Time Series (lambda=',par2,', d=',par3,', D=',par4,')',sep='')
mysub <- paste('(lambda=',par2,', d=',par3,', D=',par4,', CI=', par7, ', CI type=',par6,')',sep='')
} else {
mytitle <- paste('Working Time Series (base=',par8,', d=',par3,', D=',par4,')',sep='')
mysub <- paste('(base=',par8,', d=',par3,', D=',par4,', CI=', par7, ', CI type=',par6,')',sep='')
}
plot(x,type='l', main=mytitle,xlab='time',ylab='value')
par(op)
dev.off()
bitmap(file='pic1.png')
racf <- acf(x, par1, main='Autocorrelation', xlab='time lag', ylab='ACF', ci.type=par6, ci=par7, sub=mysub)
dev.off()
bitmap(file='pic2.png')
rpacf <- pacf(x,par1,main='Partial Autocorrelation',xlab='lags',ylab='PACF',sub=mysub)
dev.off()
(myacf <- c(racf$acf))
(mypacf <- c(rpacf$acf))
lengthx <- length(x)
sqrtn <- sqrt(lengthx)
load(file='createtable')
a<-table.start()
a<-table.row.start(a)
a<-table.element(a,'Autocorrelation Function',4,TRUE)
a<-table.row.end(a)
a<-table.row.start(a)
a<-table.element(a,'Time lag k',header=TRUE)
a<-table.element(a,hyperlink('basics.htm','ACF(k)','click here for more information about the Autocorrelation Function'),header=TRUE)
a<-table.element(a,'T-STAT',header=TRUE)
a<-table.element(a,'P-value',header=TRUE)
a<-table.row.end(a)
for (i in 2:(par1+1)) {
a<-table.row.start(a)
a<-table.element(a,i-1,header=TRUE)
a<-table.element(a,round(myacf[i],6))
mytstat <- myacf[i]*sqrtn
a<-table.element(a,round(mytstat,4))
a<-table.element(a,round(1-pt(abs(mytstat),lengthx),6))
a<-table.row.end(a)
}
a<-table.end(a)
table.save(a,file='mytable.tab')
a<-table.start()
a<-table.row.start(a)
a<-table.element(a,'Partial Autocorrelation Function',4,TRUE)
a<-table.row.end(a)
a<-table.row.start(a)
a<-table.element(a,'Time lag k',header=TRUE)
a<-table.element(a,hyperlink('basics.htm','PACF(k)','click here for more information about the Partial Autocorrelation Function'),header=TRUE)
a<-table.element(a,'T-STAT',header=TRUE)
a<-table.element(a,'P-value',header=TRUE)
a<-table.row.end(a)
for (i in 1:par1) {
a<-table.row.start(a)
a<-table.element(a,i,header=TRUE)
a<-table.element(a,round(mypacf[i],6))
mytstat <- mypacf[i]*sqrtn
a<-table.element(a,round(mytstat,4))
a<-table.element(a,round(1-pt(abs(mytstat),lengthx),6))
a<-table.row.end(a)
}
a<-table.end(a)
table.save(a,file='mytable1.tab')