Free Statistics

of Irreproducible Research!

Author's title

Author*Unverified author*
R Software Modulerwasp_autocorrelation.wasp
Title produced by software(Partial) Autocorrelation Function
Date of computationFri, 08 Jan 2016 15:41:23 +0000
Cite this page as followsStatistical Computations at FreeStatistics.org, Office for Research Development and Education, URL https://freestatistics.org/blog/index.php?v=date/2016/Jan/08/t1452267838xnmv6j8gchxdq6k.htm/, Retrieved Sun, 28 Apr 2024 18:30:48 +0000
Statistical Computations at FreeStatistics.org, Office for Research Development and Education, URL https://freestatistics.org/blog/index.php?pk=287430, Retrieved Sun, 28 Apr 2024 18:30:48 +0000
QR Codes:

Original text written by user:
IsPrivate?No (this computation is public)
User-defined keywords
Estimated Impact145
Family? (F = Feedback message, R = changed R code, M = changed R Module, P = changed Parameters, D = changed Data)
-     [Mean Plot] [] [2015-10-17 13:01:44] [a642a7d7b5f7c65c232df2d499025a08]
- RMPD    [(Partial) Autocorrelation Function] [] [2016-01-08 15:41:23] [c6ba03d4d421ca9ab835e2907c34aa87] [Current]
Feedback Forum

Post a new message
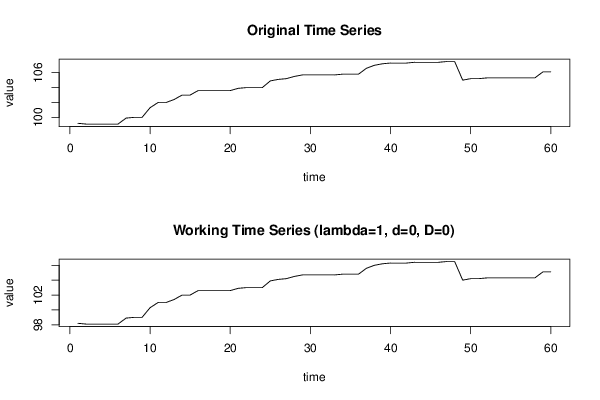
Dataseries X:
99.2
99.1
99.1
99.1
99.1
99.1
99.9
100
100
101.3
102
102
102.4
103
103
103.6
103.6
103.6
103.6
103.6
103.9
104
104
104
104.9
105.1
105.2
105.5
105.7
105.7
105.7
105.7
105.7
105.8
105.8
105.8
106.6
107
107.2
107.3
107.3
107.3
107.4
107.4
107.4
107.4
107.5
107.5
105
105.2
105.2
105.3
105.3
105.3
105.3
105.3
105.3
105.3
106.1
106.1


Summary of computational transaction
Raw Inputview raw input (R code)
Raw Outputview raw output of R engine
Computing time2 seconds
R Server'Gwilym Jenkins' @ jenkins.wessa.net

\begin{tabular}{lllllllll}
\hline
Summary of computational transaction \tabularnewline
Raw Input & view raw input (R code)  \tabularnewline
Raw Output & view raw output of R engine  \tabularnewline
Computing time & 2 seconds \tabularnewline
R Server & 'Gwilym Jenkins' @ jenkins.wessa.net \tabularnewline
\hline
\end{tabular}
%Source: https://freestatistics.org/blog/index.php?pk=287430&T=0

[TABLE]
[ROW][C]Summary of computational transaction[/C][/ROW]
[ROW][C]Raw Input[/C][C]view raw input (R code) [/C][/ROW]
[ROW][C]Raw Output[/C][C]view raw output of R engine [/C][/ROW]
[ROW][C]Computing time[/C][C]2 seconds[/C][/ROW]
[ROW][C]R Server[/C][C]'Gwilym Jenkins' @ jenkins.wessa.net[/C][/ROW]
[/TABLE]
Source: https://freestatistics.org/blog/index.php?pk=287430&T=0

Globally Unique Identifier (entire table): ba.freestatistics.org/blog/index.php?pk=287430&T=0

As an alternative you can also use a QR Code:  

The GUIDs for individual cells are displayed in the table below:

Summary of computational transaction
Raw Inputview raw input (R code)
Raw Outputview raw output of R engine
Computing time2 seconds
R Server'Gwilym Jenkins' @ jenkins.wessa.net


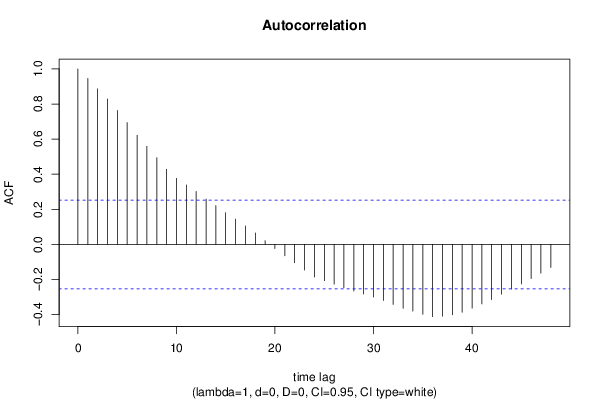
Autocorrelation Function
Time lag kACF(k)T-STATP-value
10.9457927.32610
20.8864846.86670
30.8284426.41710
40.7636425.91510
50.6940115.37581e-06
60.622534.82215e-06
70.55874.32772.9e-05
80.4939053.82580.000157
90.4281593.31650.000776
100.3765362.91660.002485
110.3388722.62490.005489
120.3012362.33340.011499
130.2582432.00030.024997
140.2208211.71050.046172
150.1805091.39820.083597
160.1438671.11440.134779
170.1051680.81460.209253
180.0649540.50310.308357
190.0212850.16490.434801
20-0.023773-0.18410.427262
21-0.064425-0.4990.309789
22-0.104384-0.80860.210982
23-0.145935-1.13040.131402
24-0.185992-1.44070.077436
25-0.206816-1.6020.057205
26-0.226409-1.75380.04229
27-0.246555-1.90980.030471
28-0.265674-2.05790.021976
29-0.281969-2.18410.016436
30-0.299626-2.32090.011854
31-0.319904-2.4780.008023
32-0.341903-2.64840.00516
33-0.363798-2.8180.003268
34-0.38027-2.94560.002291
35-0.398552-3.08720.001529
36-0.411899-3.19060.00113
37-0.408787-3.16640.001213
38-0.401078-3.10670.001444
39-0.386974-2.99750.001978
40-0.363233-2.81360.003307
41-0.339014-2.6260.005474
42-0.314307-2.43460.00895
43-0.283524-2.19620.015978
44-0.254386-1.97050.026702
45-0.225273-1.7450.043056
46-0.19487-1.50950.068215
47-0.163967-1.27010.104479
48-0.131003-1.01470.15715

\begin{tabular}{lllllllll}
\hline
Autocorrelation Function \tabularnewline
Time lag k & ACF(k) & T-STAT & P-value \tabularnewline
1 & 0.945792 & 7.3261 & 0 \tabularnewline
2 & 0.886484 & 6.8667 & 0 \tabularnewline
3 & 0.828442 & 6.4171 & 0 \tabularnewline
4 & 0.763642 & 5.9151 & 0 \tabularnewline
5 & 0.694011 & 5.3758 & 1e-06 \tabularnewline
6 & 0.62253 & 4.8221 & 5e-06 \tabularnewline
7 & 0.5587 & 4.3277 & 2.9e-05 \tabularnewline
8 & 0.493905 & 3.8258 & 0.000157 \tabularnewline
9 & 0.428159 & 3.3165 & 0.000776 \tabularnewline
10 & 0.376536 & 2.9166 & 0.002485 \tabularnewline
11 & 0.338872 & 2.6249 & 0.005489 \tabularnewline
12 & 0.301236 & 2.3334 & 0.011499 \tabularnewline
13 & 0.258243 & 2.0003 & 0.024997 \tabularnewline
14 & 0.220821 & 1.7105 & 0.046172 \tabularnewline
15 & 0.180509 & 1.3982 & 0.083597 \tabularnewline
16 & 0.143867 & 1.1144 & 0.134779 \tabularnewline
17 & 0.105168 & 0.8146 & 0.209253 \tabularnewline
18 & 0.064954 & 0.5031 & 0.308357 \tabularnewline
19 & 0.021285 & 0.1649 & 0.434801 \tabularnewline
20 & -0.023773 & -0.1841 & 0.427262 \tabularnewline
21 & -0.064425 & -0.499 & 0.309789 \tabularnewline
22 & -0.104384 & -0.8086 & 0.210982 \tabularnewline
23 & -0.145935 & -1.1304 & 0.131402 \tabularnewline
24 & -0.185992 & -1.4407 & 0.077436 \tabularnewline
25 & -0.206816 & -1.602 & 0.057205 \tabularnewline
26 & -0.226409 & -1.7538 & 0.04229 \tabularnewline
27 & -0.246555 & -1.9098 & 0.030471 \tabularnewline
28 & -0.265674 & -2.0579 & 0.021976 \tabularnewline
29 & -0.281969 & -2.1841 & 0.016436 \tabularnewline
30 & -0.299626 & -2.3209 & 0.011854 \tabularnewline
31 & -0.319904 & -2.478 & 0.008023 \tabularnewline
32 & -0.341903 & -2.6484 & 0.00516 \tabularnewline
33 & -0.363798 & -2.818 & 0.003268 \tabularnewline
34 & -0.38027 & -2.9456 & 0.002291 \tabularnewline
35 & -0.398552 & -3.0872 & 0.001529 \tabularnewline
36 & -0.411899 & -3.1906 & 0.00113 \tabularnewline
37 & -0.408787 & -3.1664 & 0.001213 \tabularnewline
38 & -0.401078 & -3.1067 & 0.001444 \tabularnewline
39 & -0.386974 & -2.9975 & 0.001978 \tabularnewline
40 & -0.363233 & -2.8136 & 0.003307 \tabularnewline
41 & -0.339014 & -2.626 & 0.005474 \tabularnewline
42 & -0.314307 & -2.4346 & 0.00895 \tabularnewline
43 & -0.283524 & -2.1962 & 0.015978 \tabularnewline
44 & -0.254386 & -1.9705 & 0.026702 \tabularnewline
45 & -0.225273 & -1.745 & 0.043056 \tabularnewline
46 & -0.19487 & -1.5095 & 0.068215 \tabularnewline
47 & -0.163967 & -1.2701 & 0.104479 \tabularnewline
48 & -0.131003 & -1.0147 & 0.15715 \tabularnewline
\hline
\end{tabular}
%Source: https://freestatistics.org/blog/index.php?pk=287430&T=1

[TABLE]
[ROW][C]Autocorrelation Function[/C][/ROW]
[ROW][C]Time lag k[/C][C]ACF(k)[/C][C]T-STAT[/C][C]P-value[/C][/ROW]
[ROW][C]1[/C][C]0.945792[/C][C]7.3261[/C][C]0[/C][/ROW]
[ROW][C]2[/C][C]0.886484[/C][C]6.8667[/C][C]0[/C][/ROW]
[ROW][C]3[/C][C]0.828442[/C][C]6.4171[/C][C]0[/C][/ROW]
[ROW][C]4[/C][C]0.763642[/C][C]5.9151[/C][C]0[/C][/ROW]
[ROW][C]5[/C][C]0.694011[/C][C]5.3758[/C][C]1e-06[/C][/ROW]
[ROW][C]6[/C][C]0.62253[/C][C]4.8221[/C][C]5e-06[/C][/ROW]
[ROW][C]7[/C][C]0.5587[/C][C]4.3277[/C][C]2.9e-05[/C][/ROW]
[ROW][C]8[/C][C]0.493905[/C][C]3.8258[/C][C]0.000157[/C][/ROW]
[ROW][C]9[/C][C]0.428159[/C][C]3.3165[/C][C]0.000776[/C][/ROW]
[ROW][C]10[/C][C]0.376536[/C][C]2.9166[/C][C]0.002485[/C][/ROW]
[ROW][C]11[/C][C]0.338872[/C][C]2.6249[/C][C]0.005489[/C][/ROW]
[ROW][C]12[/C][C]0.301236[/C][C]2.3334[/C][C]0.011499[/C][/ROW]
[ROW][C]13[/C][C]0.258243[/C][C]2.0003[/C][C]0.024997[/C][/ROW]
[ROW][C]14[/C][C]0.220821[/C][C]1.7105[/C][C]0.046172[/C][/ROW]
[ROW][C]15[/C][C]0.180509[/C][C]1.3982[/C][C]0.083597[/C][/ROW]
[ROW][C]16[/C][C]0.143867[/C][C]1.1144[/C][C]0.134779[/C][/ROW]
[ROW][C]17[/C][C]0.105168[/C][C]0.8146[/C][C]0.209253[/C][/ROW]
[ROW][C]18[/C][C]0.064954[/C][C]0.5031[/C][C]0.308357[/C][/ROW]
[ROW][C]19[/C][C]0.021285[/C][C]0.1649[/C][C]0.434801[/C][/ROW]
[ROW][C]20[/C][C]-0.023773[/C][C]-0.1841[/C][C]0.427262[/C][/ROW]
[ROW][C]21[/C][C]-0.064425[/C][C]-0.499[/C][C]0.309789[/C][/ROW]
[ROW][C]22[/C][C]-0.104384[/C][C]-0.8086[/C][C]0.210982[/C][/ROW]
[ROW][C]23[/C][C]-0.145935[/C][C]-1.1304[/C][C]0.131402[/C][/ROW]
[ROW][C]24[/C][C]-0.185992[/C][C]-1.4407[/C][C]0.077436[/C][/ROW]
[ROW][C]25[/C][C]-0.206816[/C][C]-1.602[/C][C]0.057205[/C][/ROW]
[ROW][C]26[/C][C]-0.226409[/C][C]-1.7538[/C][C]0.04229[/C][/ROW]
[ROW][C]27[/C][C]-0.246555[/C][C]-1.9098[/C][C]0.030471[/C][/ROW]
[ROW][C]28[/C][C]-0.265674[/C][C]-2.0579[/C][C]0.021976[/C][/ROW]
[ROW][C]29[/C][C]-0.281969[/C][C]-2.1841[/C][C]0.016436[/C][/ROW]
[ROW][C]30[/C][C]-0.299626[/C][C]-2.3209[/C][C]0.011854[/C][/ROW]
[ROW][C]31[/C][C]-0.319904[/C][C]-2.478[/C][C]0.008023[/C][/ROW]
[ROW][C]32[/C][C]-0.341903[/C][C]-2.6484[/C][C]0.00516[/C][/ROW]
[ROW][C]33[/C][C]-0.363798[/C][C]-2.818[/C][C]0.003268[/C][/ROW]
[ROW][C]34[/C][C]-0.38027[/C][C]-2.9456[/C][C]0.002291[/C][/ROW]
[ROW][C]35[/C][C]-0.398552[/C][C]-3.0872[/C][C]0.001529[/C][/ROW]
[ROW][C]36[/C][C]-0.411899[/C][C]-3.1906[/C][C]0.00113[/C][/ROW]
[ROW][C]37[/C][C]-0.408787[/C][C]-3.1664[/C][C]0.001213[/C][/ROW]
[ROW][C]38[/C][C]-0.401078[/C][C]-3.1067[/C][C]0.001444[/C][/ROW]
[ROW][C]39[/C][C]-0.386974[/C][C]-2.9975[/C][C]0.001978[/C][/ROW]
[ROW][C]40[/C][C]-0.363233[/C][C]-2.8136[/C][C]0.003307[/C][/ROW]
[ROW][C]41[/C][C]-0.339014[/C][C]-2.626[/C][C]0.005474[/C][/ROW]
[ROW][C]42[/C][C]-0.314307[/C][C]-2.4346[/C][C]0.00895[/C][/ROW]
[ROW][C]43[/C][C]-0.283524[/C][C]-2.1962[/C][C]0.015978[/C][/ROW]
[ROW][C]44[/C][C]-0.254386[/C][C]-1.9705[/C][C]0.026702[/C][/ROW]
[ROW][C]45[/C][C]-0.225273[/C][C]-1.745[/C][C]0.043056[/C][/ROW]
[ROW][C]46[/C][C]-0.19487[/C][C]-1.5095[/C][C]0.068215[/C][/ROW]
[ROW][C]47[/C][C]-0.163967[/C][C]-1.2701[/C][C]0.104479[/C][/ROW]
[ROW][C]48[/C][C]-0.131003[/C][C]-1.0147[/C][C]0.15715[/C][/ROW]
[/TABLE]
Source: https://freestatistics.org/blog/index.php?pk=287430&T=1

Globally Unique Identifier (entire table): ba.freestatistics.org/blog/index.php?pk=287430&T=1

As an alternative you can also use a QR Code:  

The GUIDs for individual cells are displayed in the table below:

Autocorrelation Function
Time lag kACF(k)T-STATP-value
10.9457927.32610
20.8864846.86670
30.8284426.41710
40.7636425.91510
50.6940115.37581e-06
60.622534.82215e-06
70.55874.32772.9e-05
80.4939053.82580.000157
90.4281593.31650.000776
100.3765362.91660.002485
110.3388722.62490.005489
120.3012362.33340.011499
130.2582432.00030.024997
140.2208211.71050.046172
150.1805091.39820.083597
160.1438671.11440.134779
170.1051680.81460.209253
180.0649540.50310.308357
190.0212850.16490.434801
20-0.023773-0.18410.427262
21-0.064425-0.4990.309789
22-0.104384-0.80860.210982
23-0.145935-1.13040.131402
24-0.185992-1.44070.077436
25-0.206816-1.6020.057205
26-0.226409-1.75380.04229
27-0.246555-1.90980.030471
28-0.265674-2.05790.021976
29-0.281969-2.18410.016436
30-0.299626-2.32090.011854
31-0.319904-2.4780.008023
32-0.341903-2.64840.00516
33-0.363798-2.8180.003268
34-0.38027-2.94560.002291
35-0.398552-3.08720.001529
36-0.411899-3.19060.00113
37-0.408787-3.16640.001213
38-0.401078-3.10670.001444
39-0.386974-2.99750.001978
40-0.363233-2.81360.003307
41-0.339014-2.6260.005474
42-0.314307-2.43460.00895
43-0.283524-2.19620.015978
44-0.254386-1.97050.026702
45-0.225273-1.7450.043056
46-0.19487-1.50950.068215
47-0.163967-1.27010.104479
48-0.131003-1.01470.15715


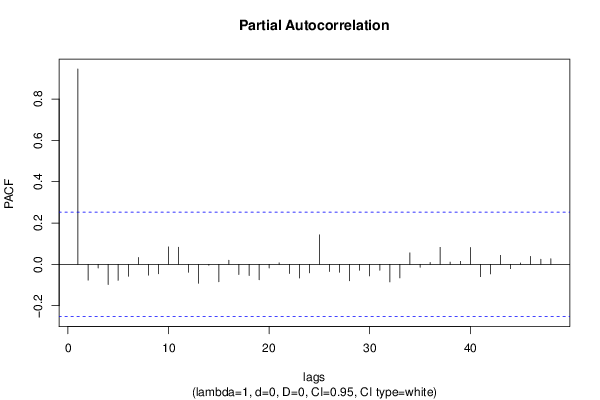
Partial Autocorrelation Function
Time lag kPACF(k)T-STATP-value
10.9457927.32610
2-0.076208-0.59030.278601
3-0.017216-0.13340.447178
4-0.097399-0.75440.226766
5-0.077362-0.59920.275635
6-0.057713-0.4470.328226
70.033460.25920.398191
8-0.05205-0.40320.344127
9-0.045342-0.35120.363327
100.0845610.6550.257484
110.0832460.64480.260751
12-0.037979-0.29420.384817
13-0.091282-0.70710.241131
14-0.004275-0.03310.486846
15-0.084388-0.65370.257913
160.0198110.15350.439277
17-0.049402-0.38270.351659
18-0.05404-0.41860.338504
19-0.074654-0.57830.282625
20-0.017744-0.13740.445569
210.0073060.05660.47753
22-0.044464-0.34440.365869
23-0.065986-0.51110.30557
24-0.041061-0.31810.375773
250.142761.10580.136611
26-0.034601-0.2680.394801
27-0.038449-0.29780.383432
28-0.07943-0.61530.270355
29-0.028632-0.22180.412618
30-0.055771-0.4320.333645
31-0.028176-0.21820.413988
32-0.084761-0.65660.256989
33-0.065504-0.50740.306869
340.0556660.43120.33394
35-0.01419-0.10990.456423
360.0093950.07280.471113
370.0823390.63780.263016
380.0109170.08460.466444
390.0144390.11180.45566
400.0816430.63240.264762
41-0.059538-0.46120.323168
42-0.04621-0.35790.360823
430.0434870.33690.368702
44-0.020564-0.15930.436987
450.00660.05110.479699
460.0385620.29870.383101
470.0248590.19260.423977
480.0272670.21120.416719

\begin{tabular}{lllllllll}
\hline
Partial Autocorrelation Function \tabularnewline
Time lag k & PACF(k) & T-STAT & P-value \tabularnewline
1 & 0.945792 & 7.3261 & 0 \tabularnewline
2 & -0.076208 & -0.5903 & 0.278601 \tabularnewline
3 & -0.017216 & -0.1334 & 0.447178 \tabularnewline
4 & -0.097399 & -0.7544 & 0.226766 \tabularnewline
5 & -0.077362 & -0.5992 & 0.275635 \tabularnewline
6 & -0.057713 & -0.447 & 0.328226 \tabularnewline
7 & 0.03346 & 0.2592 & 0.398191 \tabularnewline
8 & -0.05205 & -0.4032 & 0.344127 \tabularnewline
9 & -0.045342 & -0.3512 & 0.363327 \tabularnewline
10 & 0.084561 & 0.655 & 0.257484 \tabularnewline
11 & 0.083246 & 0.6448 & 0.260751 \tabularnewline
12 & -0.037979 & -0.2942 & 0.384817 \tabularnewline
13 & -0.091282 & -0.7071 & 0.241131 \tabularnewline
14 & -0.004275 & -0.0331 & 0.486846 \tabularnewline
15 & -0.084388 & -0.6537 & 0.257913 \tabularnewline
16 & 0.019811 & 0.1535 & 0.439277 \tabularnewline
17 & -0.049402 & -0.3827 & 0.351659 \tabularnewline
18 & -0.05404 & -0.4186 & 0.338504 \tabularnewline
19 & -0.074654 & -0.5783 & 0.282625 \tabularnewline
20 & -0.017744 & -0.1374 & 0.445569 \tabularnewline
21 & 0.007306 & 0.0566 & 0.47753 \tabularnewline
22 & -0.044464 & -0.3444 & 0.365869 \tabularnewline
23 & -0.065986 & -0.5111 & 0.30557 \tabularnewline
24 & -0.041061 & -0.3181 & 0.375773 \tabularnewline
25 & 0.14276 & 1.1058 & 0.136611 \tabularnewline
26 & -0.034601 & -0.268 & 0.394801 \tabularnewline
27 & -0.038449 & -0.2978 & 0.383432 \tabularnewline
28 & -0.07943 & -0.6153 & 0.270355 \tabularnewline
29 & -0.028632 & -0.2218 & 0.412618 \tabularnewline
30 & -0.055771 & -0.432 & 0.333645 \tabularnewline
31 & -0.028176 & -0.2182 & 0.413988 \tabularnewline
32 & -0.084761 & -0.6566 & 0.256989 \tabularnewline
33 & -0.065504 & -0.5074 & 0.306869 \tabularnewline
34 & 0.055666 & 0.4312 & 0.33394 \tabularnewline
35 & -0.01419 & -0.1099 & 0.456423 \tabularnewline
36 & 0.009395 & 0.0728 & 0.471113 \tabularnewline
37 & 0.082339 & 0.6378 & 0.263016 \tabularnewline
38 & 0.010917 & 0.0846 & 0.466444 \tabularnewline
39 & 0.014439 & 0.1118 & 0.45566 \tabularnewline
40 & 0.081643 & 0.6324 & 0.264762 \tabularnewline
41 & -0.059538 & -0.4612 & 0.323168 \tabularnewline
42 & -0.04621 & -0.3579 & 0.360823 \tabularnewline
43 & 0.043487 & 0.3369 & 0.368702 \tabularnewline
44 & -0.020564 & -0.1593 & 0.436987 \tabularnewline
45 & 0.0066 & 0.0511 & 0.479699 \tabularnewline
46 & 0.038562 & 0.2987 & 0.383101 \tabularnewline
47 & 0.024859 & 0.1926 & 0.423977 \tabularnewline
48 & 0.027267 & 0.2112 & 0.416719 \tabularnewline
\hline
\end{tabular}
%Source: https://freestatistics.org/blog/index.php?pk=287430&T=2

[TABLE]
[ROW][C]Partial Autocorrelation Function[/C][/ROW]
[ROW][C]Time lag k[/C][C]PACF(k)[/C][C]T-STAT[/C][C]P-value[/C][/ROW]
[ROW][C]1[/C][C]0.945792[/C][C]7.3261[/C][C]0[/C][/ROW]
[ROW][C]2[/C][C]-0.076208[/C][C]-0.5903[/C][C]0.278601[/C][/ROW]
[ROW][C]3[/C][C]-0.017216[/C][C]-0.1334[/C][C]0.447178[/C][/ROW]
[ROW][C]4[/C][C]-0.097399[/C][C]-0.7544[/C][C]0.226766[/C][/ROW]
[ROW][C]5[/C][C]-0.077362[/C][C]-0.5992[/C][C]0.275635[/C][/ROW]
[ROW][C]6[/C][C]-0.057713[/C][C]-0.447[/C][C]0.328226[/C][/ROW]
[ROW][C]7[/C][C]0.03346[/C][C]0.2592[/C][C]0.398191[/C][/ROW]
[ROW][C]8[/C][C]-0.05205[/C][C]-0.4032[/C][C]0.344127[/C][/ROW]
[ROW][C]9[/C][C]-0.045342[/C][C]-0.3512[/C][C]0.363327[/C][/ROW]
[ROW][C]10[/C][C]0.084561[/C][C]0.655[/C][C]0.257484[/C][/ROW]
[ROW][C]11[/C][C]0.083246[/C][C]0.6448[/C][C]0.260751[/C][/ROW]
[ROW][C]12[/C][C]-0.037979[/C][C]-0.2942[/C][C]0.384817[/C][/ROW]
[ROW][C]13[/C][C]-0.091282[/C][C]-0.7071[/C][C]0.241131[/C][/ROW]
[ROW][C]14[/C][C]-0.004275[/C][C]-0.0331[/C][C]0.486846[/C][/ROW]
[ROW][C]15[/C][C]-0.084388[/C][C]-0.6537[/C][C]0.257913[/C][/ROW]
[ROW][C]16[/C][C]0.019811[/C][C]0.1535[/C][C]0.439277[/C][/ROW]
[ROW][C]17[/C][C]-0.049402[/C][C]-0.3827[/C][C]0.351659[/C][/ROW]
[ROW][C]18[/C][C]-0.05404[/C][C]-0.4186[/C][C]0.338504[/C][/ROW]
[ROW][C]19[/C][C]-0.074654[/C][C]-0.5783[/C][C]0.282625[/C][/ROW]
[ROW][C]20[/C][C]-0.017744[/C][C]-0.1374[/C][C]0.445569[/C][/ROW]
[ROW][C]21[/C][C]0.007306[/C][C]0.0566[/C][C]0.47753[/C][/ROW]
[ROW][C]22[/C][C]-0.044464[/C][C]-0.3444[/C][C]0.365869[/C][/ROW]
[ROW][C]23[/C][C]-0.065986[/C][C]-0.5111[/C][C]0.30557[/C][/ROW]
[ROW][C]24[/C][C]-0.041061[/C][C]-0.3181[/C][C]0.375773[/C][/ROW]
[ROW][C]25[/C][C]0.14276[/C][C]1.1058[/C][C]0.136611[/C][/ROW]
[ROW][C]26[/C][C]-0.034601[/C][C]-0.268[/C][C]0.394801[/C][/ROW]
[ROW][C]27[/C][C]-0.038449[/C][C]-0.2978[/C][C]0.383432[/C][/ROW]
[ROW][C]28[/C][C]-0.07943[/C][C]-0.6153[/C][C]0.270355[/C][/ROW]
[ROW][C]29[/C][C]-0.028632[/C][C]-0.2218[/C][C]0.412618[/C][/ROW]
[ROW][C]30[/C][C]-0.055771[/C][C]-0.432[/C][C]0.333645[/C][/ROW]
[ROW][C]31[/C][C]-0.028176[/C][C]-0.2182[/C][C]0.413988[/C][/ROW]
[ROW][C]32[/C][C]-0.084761[/C][C]-0.6566[/C][C]0.256989[/C][/ROW]
[ROW][C]33[/C][C]-0.065504[/C][C]-0.5074[/C][C]0.306869[/C][/ROW]
[ROW][C]34[/C][C]0.055666[/C][C]0.4312[/C][C]0.33394[/C][/ROW]
[ROW][C]35[/C][C]-0.01419[/C][C]-0.1099[/C][C]0.456423[/C][/ROW]
[ROW][C]36[/C][C]0.009395[/C][C]0.0728[/C][C]0.471113[/C][/ROW]
[ROW][C]37[/C][C]0.082339[/C][C]0.6378[/C][C]0.263016[/C][/ROW]
[ROW][C]38[/C][C]0.010917[/C][C]0.0846[/C][C]0.466444[/C][/ROW]
[ROW][C]39[/C][C]0.014439[/C][C]0.1118[/C][C]0.45566[/C][/ROW]
[ROW][C]40[/C][C]0.081643[/C][C]0.6324[/C][C]0.264762[/C][/ROW]
[ROW][C]41[/C][C]-0.059538[/C][C]-0.4612[/C][C]0.323168[/C][/ROW]
[ROW][C]42[/C][C]-0.04621[/C][C]-0.3579[/C][C]0.360823[/C][/ROW]
[ROW][C]43[/C][C]0.043487[/C][C]0.3369[/C][C]0.368702[/C][/ROW]
[ROW][C]44[/C][C]-0.020564[/C][C]-0.1593[/C][C]0.436987[/C][/ROW]
[ROW][C]45[/C][C]0.0066[/C][C]0.0511[/C][C]0.479699[/C][/ROW]
[ROW][C]46[/C][C]0.038562[/C][C]0.2987[/C][C]0.383101[/C][/ROW]
[ROW][C]47[/C][C]0.024859[/C][C]0.1926[/C][C]0.423977[/C][/ROW]
[ROW][C]48[/C][C]0.027267[/C][C]0.2112[/C][C]0.416719[/C][/ROW]
[/TABLE]
Source: https://freestatistics.org/blog/index.php?pk=287430&T=2

Globally Unique Identifier (entire table): ba.freestatistics.org/blog/index.php?pk=287430&T=2

As an alternative you can also use a QR Code:  

The GUIDs for individual cells are displayed in the table below:

Partial Autocorrelation Function
Time lag kPACF(k)T-STATP-value
10.9457927.32610
2-0.076208-0.59030.278601
3-0.017216-0.13340.447178
4-0.097399-0.75440.226766
5-0.077362-0.59920.275635
6-0.057713-0.4470.328226
70.033460.25920.398191
8-0.05205-0.40320.344127
9-0.045342-0.35120.363327
100.0845610.6550.257484
110.0832460.64480.260751
12-0.037979-0.29420.384817
13-0.091282-0.70710.241131
14-0.004275-0.03310.486846
15-0.084388-0.65370.257913
160.0198110.15350.439277
17-0.049402-0.38270.351659
18-0.05404-0.41860.338504
19-0.074654-0.57830.282625
20-0.017744-0.13740.445569
210.0073060.05660.47753
22-0.044464-0.34440.365869
23-0.065986-0.51110.30557
24-0.041061-0.31810.375773
250.142761.10580.136611
26-0.034601-0.2680.394801
27-0.038449-0.29780.383432
28-0.07943-0.61530.270355
29-0.028632-0.22180.412618
30-0.055771-0.4320.333645
31-0.028176-0.21820.413988
32-0.084761-0.65660.256989
33-0.065504-0.50740.306869
340.0556660.43120.33394
35-0.01419-0.10990.456423
360.0093950.07280.471113
370.0823390.63780.263016
380.0109170.08460.466444
390.0144390.11180.45566
400.0816430.63240.264762
41-0.059538-0.46120.323168
42-0.04621-0.35790.360823
430.0434870.33690.368702
44-0.020564-0.15930.436987
450.00660.05110.479699
460.0385620.29870.383101
470.0248590.19260.423977
480.0272670.21120.416719


Parameters (Session):
par1 = 48 ; par2 = 1 ; par3 = 0 ; par4 = 0 ; par5 = 12 ; par6 = White Noise ; par7 = 0.95 ;
Parameters (R input):
par1 = 48 ; par2 = 1 ; par3 = 0 ; par4 = 0 ; par5 = 12 ; par6 = White Noise ; par7 = 0.95 ; par8 = ;
R code (references can be found in the software module):
if (par1 == 'Default') {
par1 = 10*log10(length(x))
} else {
par1 <- as.numeric(par1)
}
par2 <- as.numeric(par2)
par3 <- as.numeric(par3)
par4 <- as.numeric(par4)
par5 <- as.numeric(par5)
if (par6 == 'White Noise') par6 <- 'white' else par6 <- 'ma'
par7 <- as.numeric(par7)
if (par8 != '') par8 <- as.numeric(par8)
x <- na.omit(x)
ox <- x
if (par8 == '') {
if (par2 == 0) {
x <- log(x)
} else {
x <- (x ^ par2 - 1) / par2
}
} else {
x <- log(x,base=par8)
}
if (par3 > 0) x <- diff(x,lag=1,difference=par3)
if (par4 > 0) x <- diff(x,lag=par5,difference=par4)
bitmap(file='picts.png')
op <- par(mfrow=c(2,1))
plot(ox,type='l',main='Original Time Series',xlab='time',ylab='value')
if (par8=='') {
mytitle <- paste('Working Time Series (lambda=',par2,', d=',par3,', D=',par4,')',sep='')
mysub <- paste('(lambda=',par2,', d=',par3,', D=',par4,', CI=', par7, ', CI type=',par6,')',sep='')
} else {
mytitle <- paste('Working Time Series (base=',par8,', d=',par3,', D=',par4,')',sep='')
mysub <- paste('(base=',par8,', d=',par3,', D=',par4,', CI=', par7, ', CI type=',par6,')',sep='')
}
plot(x,type='l', main=mytitle,xlab='time',ylab='value')
par(op)
dev.off()
bitmap(file='pic1.png')
racf <- acf(x, par1, main='Autocorrelation', xlab='time lag', ylab='ACF', ci.type=par6, ci=par7, sub=mysub)
dev.off()
bitmap(file='pic2.png')
rpacf <- pacf(x,par1,main='Partial Autocorrelation',xlab='lags',ylab='PACF',sub=mysub)
dev.off()
(myacf <- c(racf$acf))
(mypacf <- c(rpacf$acf))
lengthx <- length(x)
sqrtn <- sqrt(lengthx)
load(file='createtable')
a<-table.start()
a<-table.row.start(a)
a<-table.element(a,'Autocorrelation Function',4,TRUE)
a<-table.row.end(a)
a<-table.row.start(a)
a<-table.element(a,'Time lag k',header=TRUE)
a<-table.element(a,hyperlink('basics.htm','ACF(k)','click here for more information about the Autocorrelation Function'),header=TRUE)
a<-table.element(a,'T-STAT',header=TRUE)
a<-table.element(a,'P-value',header=TRUE)
a<-table.row.end(a)
for (i in 2:(par1+1)) {
a<-table.row.start(a)
a<-table.element(a,i-1,header=TRUE)
a<-table.element(a,round(myacf[i],6))
mytstat <- myacf[i]*sqrtn
a<-table.element(a,round(mytstat,4))
a<-table.element(a,round(1-pt(abs(mytstat),lengthx),6))
a<-table.row.end(a)
}
a<-table.end(a)
table.save(a,file='mytable.tab')
a<-table.start()
a<-table.row.start(a)
a<-table.element(a,'Partial Autocorrelation Function',4,TRUE)
a<-table.row.end(a)
a<-table.row.start(a)
a<-table.element(a,'Time lag k',header=TRUE)
a<-table.element(a,hyperlink('basics.htm','PACF(k)','click here for more information about the Partial Autocorrelation Function'),header=TRUE)
a<-table.element(a,'T-STAT',header=TRUE)
a<-table.element(a,'P-value',header=TRUE)
a<-table.row.end(a)
for (i in 1:par1) {
a<-table.row.start(a)
a<-table.element(a,i,header=TRUE)
a<-table.element(a,round(mypacf[i],6))
mytstat <- mypacf[i]*sqrtn
a<-table.element(a,round(mytstat,4))
a<-table.element(a,round(1-pt(abs(mytstat),lengthx),6))
a<-table.row.end(a)
}
a<-table.end(a)
table.save(a,file='mytable1.tab')