Free Statistics

of Irreproducible Research!

Author's title

Author*Unverified author*
R Software Modulerwasp_autocorrelation.wasp
Title produced by software(Partial) Autocorrelation Function
Date of computationFri, 08 Jan 2016 19:32:29 +0000
Cite this page as followsStatistical Computations at FreeStatistics.org, Office for Research Development and Education, URL https://freestatistics.org/blog/index.php?v=date/2016/Jan/08/t1452281758xt8svvopifaluf5.htm/, Retrieved Sun, 28 Apr 2024 12:57:26 +0000
Statistical Computations at FreeStatistics.org, Office for Research Development and Education, URL https://freestatistics.org/blog/index.php?pk=287435, Retrieved Sun, 28 Apr 2024 12:57:26 +0000
QR Codes:

Original text written by user:
IsPrivate?No (this computation is public)
User-defined keywords
Estimated Impact119
Family? (F = Feedback message, R = changed R code, M = changed R Module, P = changed Parameters, D = changed Data)
-       [(Partial) Autocorrelation Function] [] [2016-01-08 19:32:29] [c7db9dbe56b0646da05788291b2eebd0] [Current]
Feedback Forum

Post a new message
Dataseries X:
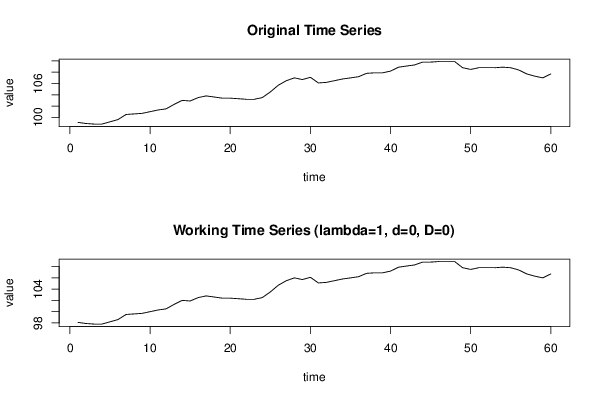
99,1
98,9
98,8
98,8
99,2
99,6
100,5
100,6
100,7
101
101,3
101,5
102,3
103
102,9
103,5
103,8
103,6
103,4
103,4
103,3
103,2
103,2
103,5
104,5
105,7
106,5
107
106,7
107,1
106,1
106,2
106,5
106,8
107
107,2
107,8
107,9
107,9
108,2
108,9
109,1
109,3
109,8
109,8
109,9
109,9
109,9
108,8
108,5
108,8
108,8
108,8
108,9
108,8
108,4
107,7
107,3
107
107,7


Summary of computational transaction
Raw Inputview raw input (R code)
Raw Outputview raw output of R engine
Computing time2 seconds
R Server'Gertrude Mary Cox' @ cox.wessa.net

\begin{tabular}{lllllllll}
\hline
Summary of computational transaction \tabularnewline
Raw Input & view raw input (R code)  \tabularnewline
Raw Output & view raw output of R engine  \tabularnewline
Computing time & 2 seconds \tabularnewline
R Server & 'Gertrude Mary Cox' @ cox.wessa.net \tabularnewline
\hline
\end{tabular}
%Source: https://freestatistics.org/blog/index.php?pk=287435&T=0

[TABLE]
[ROW][C]Summary of computational transaction[/C][/ROW]
[ROW][C]Raw Input[/C][C]view raw input (R code) [/C][/ROW]
[ROW][C]Raw Output[/C][C]view raw output of R engine [/C][/ROW]
[ROW][C]Computing time[/C][C]2 seconds[/C][/ROW]
[ROW][C]R Server[/C][C]'Gertrude Mary Cox' @ cox.wessa.net[/C][/ROW]
[/TABLE]
Source: https://freestatistics.org/blog/index.php?pk=287435&T=0

Globally Unique Identifier (entire table): ba.freestatistics.org/blog/index.php?pk=287435&T=0

As an alternative you can also use a QR Code:  

The GUIDs for individual cells are displayed in the table below:

Summary of computational transaction
Raw Inputview raw input (R code)
Raw Outputview raw output of R engine
Computing time2 seconds
R Server'Gertrude Mary Cox' @ cox.wessa.net


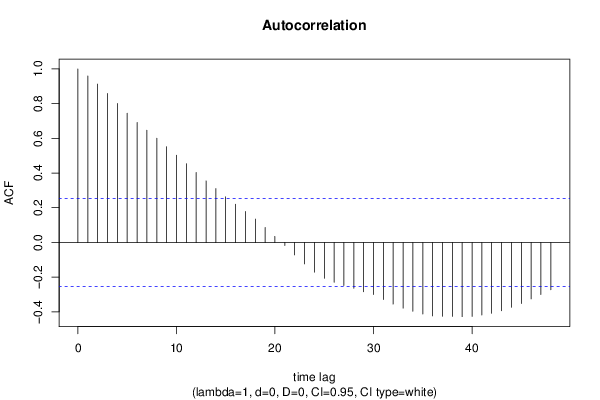
Autocorrelation Function
Time lag kACF(k)T-STATP-value
10.9597397.43410
20.9124997.06820
30.8587656.6520
40.8013726.20740
50.7445935.76760
60.6918345.35891e-06
70.6469845.01153e-06
80.6001774.6499e-06
90.551994.27573.5e-05
100.5027483.89430.000125
110.4538173.51520.000421
120.4034243.12490.00137
130.3547062.74750.003959
140.3104452.40470.009644
150.262692.03480.023149
160.2203051.70650.046545
170.1782461.38070.086248
180.1343941.0410.151024
190.0859460.66570.254065
200.034750.26920.39436
21-0.017832-0.13810.445301
22-0.071657-0.55510.290461
23-0.123622-0.95760.17106
24-0.171346-1.32720.094729
25-0.206177-1.5970.057755
26-0.230041-1.78190.039914
27-0.247957-1.92070.029765
28-0.263715-2.04270.02274
29-0.283944-2.19940.015856
30-0.299958-2.32350.01178
31-0.329242-2.55030.006667
32-0.355472-2.75350.003896
33-0.378683-2.93330.002372
34-0.396781-3.07350.001591
35-0.412418-3.19460.001116
36-0.423372-3.27940.000867
37-0.425482-3.29580.000826
38-0.426494-3.30360.000806
39-0.427816-3.31380.000782
40-0.426416-3.3030.000808
41-0.418616-3.24260.000968
42-0.408095-3.16110.001232
43-0.393866-3.05090.001698
44-0.373843-2.89580.002635
45-0.351751-2.72460.004211
46-0.325591-2.5220.00717
47-0.299853-2.32270.011804
48-0.2725-2.11080.019484

\begin{tabular}{lllllllll}
\hline
Autocorrelation Function \tabularnewline
Time lag k & ACF(k) & T-STAT & P-value \tabularnewline
1 & 0.959739 & 7.4341 & 0 \tabularnewline
2 & 0.912499 & 7.0682 & 0 \tabularnewline
3 & 0.858765 & 6.652 & 0 \tabularnewline
4 & 0.801372 & 6.2074 & 0 \tabularnewline
5 & 0.744593 & 5.7676 & 0 \tabularnewline
6 & 0.691834 & 5.3589 & 1e-06 \tabularnewline
7 & 0.646984 & 5.0115 & 3e-06 \tabularnewline
8 & 0.600177 & 4.649 & 9e-06 \tabularnewline
9 & 0.55199 & 4.2757 & 3.5e-05 \tabularnewline
10 & 0.502748 & 3.8943 & 0.000125 \tabularnewline
11 & 0.453817 & 3.5152 & 0.000421 \tabularnewline
12 & 0.403424 & 3.1249 & 0.00137 \tabularnewline
13 & 0.354706 & 2.7475 & 0.003959 \tabularnewline
14 & 0.310445 & 2.4047 & 0.009644 \tabularnewline
15 & 0.26269 & 2.0348 & 0.023149 \tabularnewline
16 & 0.220305 & 1.7065 & 0.046545 \tabularnewline
17 & 0.178246 & 1.3807 & 0.086248 \tabularnewline
18 & 0.134394 & 1.041 & 0.151024 \tabularnewline
19 & 0.085946 & 0.6657 & 0.254065 \tabularnewline
20 & 0.03475 & 0.2692 & 0.39436 \tabularnewline
21 & -0.017832 & -0.1381 & 0.445301 \tabularnewline
22 & -0.071657 & -0.5551 & 0.290461 \tabularnewline
23 & -0.123622 & -0.9576 & 0.17106 \tabularnewline
24 & -0.171346 & -1.3272 & 0.094729 \tabularnewline
25 & -0.206177 & -1.597 & 0.057755 \tabularnewline
26 & -0.230041 & -1.7819 & 0.039914 \tabularnewline
27 & -0.247957 & -1.9207 & 0.029765 \tabularnewline
28 & -0.263715 & -2.0427 & 0.02274 \tabularnewline
29 & -0.283944 & -2.1994 & 0.015856 \tabularnewline
30 & -0.299958 & -2.3235 & 0.01178 \tabularnewline
31 & -0.329242 & -2.5503 & 0.006667 \tabularnewline
32 & -0.355472 & -2.7535 & 0.003896 \tabularnewline
33 & -0.378683 & -2.9333 & 0.002372 \tabularnewline
34 & -0.396781 & -3.0735 & 0.001591 \tabularnewline
35 & -0.412418 & -3.1946 & 0.001116 \tabularnewline
36 & -0.423372 & -3.2794 & 0.000867 \tabularnewline
37 & -0.425482 & -3.2958 & 0.000826 \tabularnewline
38 & -0.426494 & -3.3036 & 0.000806 \tabularnewline
39 & -0.427816 & -3.3138 & 0.000782 \tabularnewline
40 & -0.426416 & -3.303 & 0.000808 \tabularnewline
41 & -0.418616 & -3.2426 & 0.000968 \tabularnewline
42 & -0.408095 & -3.1611 & 0.001232 \tabularnewline
43 & -0.393866 & -3.0509 & 0.001698 \tabularnewline
44 & -0.373843 & -2.8958 & 0.002635 \tabularnewline
45 & -0.351751 & -2.7246 & 0.004211 \tabularnewline
46 & -0.325591 & -2.522 & 0.00717 \tabularnewline
47 & -0.299853 & -2.3227 & 0.011804 \tabularnewline
48 & -0.2725 & -2.1108 & 0.019484 \tabularnewline
\hline
\end{tabular}
%Source: https://freestatistics.org/blog/index.php?pk=287435&T=1

[TABLE]
[ROW][C]Autocorrelation Function[/C][/ROW]
[ROW][C]Time lag k[/C][C]ACF(k)[/C][C]T-STAT[/C][C]P-value[/C][/ROW]
[ROW][C]1[/C][C]0.959739[/C][C]7.4341[/C][C]0[/C][/ROW]
[ROW][C]2[/C][C]0.912499[/C][C]7.0682[/C][C]0[/C][/ROW]
[ROW][C]3[/C][C]0.858765[/C][C]6.652[/C][C]0[/C][/ROW]
[ROW][C]4[/C][C]0.801372[/C][C]6.2074[/C][C]0[/C][/ROW]
[ROW][C]5[/C][C]0.744593[/C][C]5.7676[/C][C]0[/C][/ROW]
[ROW][C]6[/C][C]0.691834[/C][C]5.3589[/C][C]1e-06[/C][/ROW]
[ROW][C]7[/C][C]0.646984[/C][C]5.0115[/C][C]3e-06[/C][/ROW]
[ROW][C]8[/C][C]0.600177[/C][C]4.649[/C][C]9e-06[/C][/ROW]
[ROW][C]9[/C][C]0.55199[/C][C]4.2757[/C][C]3.5e-05[/C][/ROW]
[ROW][C]10[/C][C]0.502748[/C][C]3.8943[/C][C]0.000125[/C][/ROW]
[ROW][C]11[/C][C]0.453817[/C][C]3.5152[/C][C]0.000421[/C][/ROW]
[ROW][C]12[/C][C]0.403424[/C][C]3.1249[/C][C]0.00137[/C][/ROW]
[ROW][C]13[/C][C]0.354706[/C][C]2.7475[/C][C]0.003959[/C][/ROW]
[ROW][C]14[/C][C]0.310445[/C][C]2.4047[/C][C]0.009644[/C][/ROW]
[ROW][C]15[/C][C]0.26269[/C][C]2.0348[/C][C]0.023149[/C][/ROW]
[ROW][C]16[/C][C]0.220305[/C][C]1.7065[/C][C]0.046545[/C][/ROW]
[ROW][C]17[/C][C]0.178246[/C][C]1.3807[/C][C]0.086248[/C][/ROW]
[ROW][C]18[/C][C]0.134394[/C][C]1.041[/C][C]0.151024[/C][/ROW]
[ROW][C]19[/C][C]0.085946[/C][C]0.6657[/C][C]0.254065[/C][/ROW]
[ROW][C]20[/C][C]0.03475[/C][C]0.2692[/C][C]0.39436[/C][/ROW]
[ROW][C]21[/C][C]-0.017832[/C][C]-0.1381[/C][C]0.445301[/C][/ROW]
[ROW][C]22[/C][C]-0.071657[/C][C]-0.5551[/C][C]0.290461[/C][/ROW]
[ROW][C]23[/C][C]-0.123622[/C][C]-0.9576[/C][C]0.17106[/C][/ROW]
[ROW][C]24[/C][C]-0.171346[/C][C]-1.3272[/C][C]0.094729[/C][/ROW]
[ROW][C]25[/C][C]-0.206177[/C][C]-1.597[/C][C]0.057755[/C][/ROW]
[ROW][C]26[/C][C]-0.230041[/C][C]-1.7819[/C][C]0.039914[/C][/ROW]
[ROW][C]27[/C][C]-0.247957[/C][C]-1.9207[/C][C]0.029765[/C][/ROW]
[ROW][C]28[/C][C]-0.263715[/C][C]-2.0427[/C][C]0.02274[/C][/ROW]
[ROW][C]29[/C][C]-0.283944[/C][C]-2.1994[/C][C]0.015856[/C][/ROW]
[ROW][C]30[/C][C]-0.299958[/C][C]-2.3235[/C][C]0.01178[/C][/ROW]
[ROW][C]31[/C][C]-0.329242[/C][C]-2.5503[/C][C]0.006667[/C][/ROW]
[ROW][C]32[/C][C]-0.355472[/C][C]-2.7535[/C][C]0.003896[/C][/ROW]
[ROW][C]33[/C][C]-0.378683[/C][C]-2.9333[/C][C]0.002372[/C][/ROW]
[ROW][C]34[/C][C]-0.396781[/C][C]-3.0735[/C][C]0.001591[/C][/ROW]
[ROW][C]35[/C][C]-0.412418[/C][C]-3.1946[/C][C]0.001116[/C][/ROW]
[ROW][C]36[/C][C]-0.423372[/C][C]-3.2794[/C][C]0.000867[/C][/ROW]
[ROW][C]37[/C][C]-0.425482[/C][C]-3.2958[/C][C]0.000826[/C][/ROW]
[ROW][C]38[/C][C]-0.426494[/C][C]-3.3036[/C][C]0.000806[/C][/ROW]
[ROW][C]39[/C][C]-0.427816[/C][C]-3.3138[/C][C]0.000782[/C][/ROW]
[ROW][C]40[/C][C]-0.426416[/C][C]-3.303[/C][C]0.000808[/C][/ROW]
[ROW][C]41[/C][C]-0.418616[/C][C]-3.2426[/C][C]0.000968[/C][/ROW]
[ROW][C]42[/C][C]-0.408095[/C][C]-3.1611[/C][C]0.001232[/C][/ROW]
[ROW][C]43[/C][C]-0.393866[/C][C]-3.0509[/C][C]0.001698[/C][/ROW]
[ROW][C]44[/C][C]-0.373843[/C][C]-2.8958[/C][C]0.002635[/C][/ROW]
[ROW][C]45[/C][C]-0.351751[/C][C]-2.7246[/C][C]0.004211[/C][/ROW]
[ROW][C]46[/C][C]-0.325591[/C][C]-2.522[/C][C]0.00717[/C][/ROW]
[ROW][C]47[/C][C]-0.299853[/C][C]-2.3227[/C][C]0.011804[/C][/ROW]
[ROW][C]48[/C][C]-0.2725[/C][C]-2.1108[/C][C]0.019484[/C][/ROW]
[/TABLE]
Source: https://freestatistics.org/blog/index.php?pk=287435&T=1

Globally Unique Identifier (entire table): ba.freestatistics.org/blog/index.php?pk=287435&T=1

As an alternative you can also use a QR Code:  

The GUIDs for individual cells are displayed in the table below:

Autocorrelation Function
Time lag kACF(k)T-STATP-value
10.9597397.43410
20.9124997.06820
30.8587656.6520
40.8013726.20740
50.7445935.76760
60.6918345.35891e-06
70.6469845.01153e-06
80.6001774.6499e-06
90.551994.27573.5e-05
100.5027483.89430.000125
110.4538173.51520.000421
120.4034243.12490.00137
130.3547062.74750.003959
140.3104452.40470.009644
150.262692.03480.023149
160.2203051.70650.046545
170.1782461.38070.086248
180.1343941.0410.151024
190.0859460.66570.254065
200.034750.26920.39436
21-0.017832-0.13810.445301
22-0.071657-0.55510.290461
23-0.123622-0.95760.17106
24-0.171346-1.32720.094729
25-0.206177-1.5970.057755
26-0.230041-1.78190.039914
27-0.247957-1.92070.029765
28-0.263715-2.04270.02274
29-0.283944-2.19940.015856
30-0.299958-2.32350.01178
31-0.329242-2.55030.006667
32-0.355472-2.75350.003896
33-0.378683-2.93330.002372
34-0.396781-3.07350.001591
35-0.412418-3.19460.001116
36-0.423372-3.27940.000867
37-0.425482-3.29580.000826
38-0.426494-3.30360.000806
39-0.427816-3.31380.000782
40-0.426416-3.3030.000808
41-0.418616-3.24260.000968
42-0.408095-3.16110.001232
43-0.393866-3.05090.001698
44-0.373843-2.89580.002635
45-0.351751-2.72460.004211
46-0.325591-2.5220.00717
47-0.299853-2.32270.011804
48-0.2725-2.11080.019484


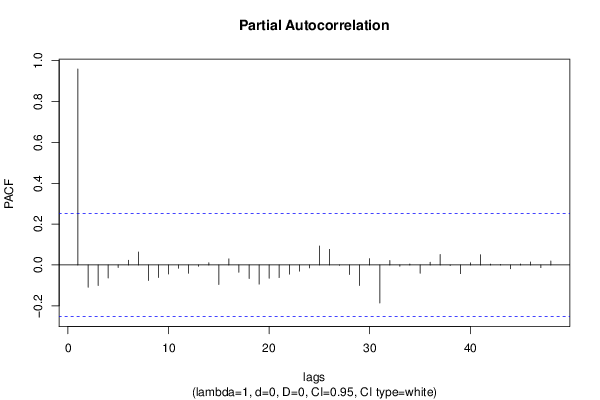
Partial Autocorrelation Function
Time lag kPACF(k)T-STATP-value
10.9597397.43410
2-0.109002-0.84430.20092
3-0.100576-0.77910.219504
4-0.063915-0.49510.311175
5-0.01232-0.09540.462145
60.0234930.1820.428107
70.0636390.49290.311925
8-0.075881-0.58780.279446
9-0.061539-0.47670.317661
10-0.044208-0.34240.366611
11-0.015894-0.12310.451215
12-0.040686-0.31520.37687
13-0.006221-0.04820.480864
140.0109210.08460.466434
15-0.095266-0.73790.231718
160.0300440.23270.408386
17-0.035532-0.27520.392042
18-0.066034-0.51150.30544
19-0.093968-0.72790.234762
20-0.065394-0.50650.307166
21-0.061832-0.47890.316859
22-0.044763-0.34670.365004
23-0.030113-0.23330.40818
24-0.014458-0.1120.455601
250.0928220.7190.237468
260.0765680.59310.277675
27-0.001303-0.01010.495991
28-0.046523-0.36040.35992
29-0.100643-0.77960.219352
300.0312610.24210.404747
31-0.18623-1.44250.077177
320.0222220.17210.431956
33-0.006276-0.04860.480696
340.0050970.03950.48432
35-0.040559-0.31420.37724
360.0132910.1030.459172
370.0514150.39830.345928
38-0.002953-0.02290.490914
39-0.042376-0.32820.371936
400.0103450.08010.4682
410.0502260.3890.34931
420.0040610.03150.487506
430.0019910.01540.493874
44-0.018375-0.14230.443648
450.0047350.03670.485432
460.0148710.11520.454339
47-0.013086-0.10140.459799
480.0192130.14880.441095

\begin{tabular}{lllllllll}
\hline
Partial Autocorrelation Function \tabularnewline
Time lag k & PACF(k) & T-STAT & P-value \tabularnewline
1 & 0.959739 & 7.4341 & 0 \tabularnewline
2 & -0.109002 & -0.8443 & 0.20092 \tabularnewline
3 & -0.100576 & -0.7791 & 0.219504 \tabularnewline
4 & -0.063915 & -0.4951 & 0.311175 \tabularnewline
5 & -0.01232 & -0.0954 & 0.462145 \tabularnewline
6 & 0.023493 & 0.182 & 0.428107 \tabularnewline
7 & 0.063639 & 0.4929 & 0.311925 \tabularnewline
8 & -0.075881 & -0.5878 & 0.279446 \tabularnewline
9 & -0.061539 & -0.4767 & 0.317661 \tabularnewline
10 & -0.044208 & -0.3424 & 0.366611 \tabularnewline
11 & -0.015894 & -0.1231 & 0.451215 \tabularnewline
12 & -0.040686 & -0.3152 & 0.37687 \tabularnewline
13 & -0.006221 & -0.0482 & 0.480864 \tabularnewline
14 & 0.010921 & 0.0846 & 0.466434 \tabularnewline
15 & -0.095266 & -0.7379 & 0.231718 \tabularnewline
16 & 0.030044 & 0.2327 & 0.408386 \tabularnewline
17 & -0.035532 & -0.2752 & 0.392042 \tabularnewline
18 & -0.066034 & -0.5115 & 0.30544 \tabularnewline
19 & -0.093968 & -0.7279 & 0.234762 \tabularnewline
20 & -0.065394 & -0.5065 & 0.307166 \tabularnewline
21 & -0.061832 & -0.4789 & 0.316859 \tabularnewline
22 & -0.044763 & -0.3467 & 0.365004 \tabularnewline
23 & -0.030113 & -0.2333 & 0.40818 \tabularnewline
24 & -0.014458 & -0.112 & 0.455601 \tabularnewline
25 & 0.092822 & 0.719 & 0.237468 \tabularnewline
26 & 0.076568 & 0.5931 & 0.277675 \tabularnewline
27 & -0.001303 & -0.0101 & 0.495991 \tabularnewline
28 & -0.046523 & -0.3604 & 0.35992 \tabularnewline
29 & -0.100643 & -0.7796 & 0.219352 \tabularnewline
30 & 0.031261 & 0.2421 & 0.404747 \tabularnewline
31 & -0.18623 & -1.4425 & 0.077177 \tabularnewline
32 & 0.022222 & 0.1721 & 0.431956 \tabularnewline
33 & -0.006276 & -0.0486 & 0.480696 \tabularnewline
34 & 0.005097 & 0.0395 & 0.48432 \tabularnewline
35 & -0.040559 & -0.3142 & 0.37724 \tabularnewline
36 & 0.013291 & 0.103 & 0.459172 \tabularnewline
37 & 0.051415 & 0.3983 & 0.345928 \tabularnewline
38 & -0.002953 & -0.0229 & 0.490914 \tabularnewline
39 & -0.042376 & -0.3282 & 0.371936 \tabularnewline
40 & 0.010345 & 0.0801 & 0.4682 \tabularnewline
41 & 0.050226 & 0.389 & 0.34931 \tabularnewline
42 & 0.004061 & 0.0315 & 0.487506 \tabularnewline
43 & 0.001991 & 0.0154 & 0.493874 \tabularnewline
44 & -0.018375 & -0.1423 & 0.443648 \tabularnewline
45 & 0.004735 & 0.0367 & 0.485432 \tabularnewline
46 & 0.014871 & 0.1152 & 0.454339 \tabularnewline
47 & -0.013086 & -0.1014 & 0.459799 \tabularnewline
48 & 0.019213 & 0.1488 & 0.441095 \tabularnewline
\hline
\end{tabular}
%Source: https://freestatistics.org/blog/index.php?pk=287435&T=2

[TABLE]
[ROW][C]Partial Autocorrelation Function[/C][/ROW]
[ROW][C]Time lag k[/C][C]PACF(k)[/C][C]T-STAT[/C][C]P-value[/C][/ROW]
[ROW][C]1[/C][C]0.959739[/C][C]7.4341[/C][C]0[/C][/ROW]
[ROW][C]2[/C][C]-0.109002[/C][C]-0.8443[/C][C]0.20092[/C][/ROW]
[ROW][C]3[/C][C]-0.100576[/C][C]-0.7791[/C][C]0.219504[/C][/ROW]
[ROW][C]4[/C][C]-0.063915[/C][C]-0.4951[/C][C]0.311175[/C][/ROW]
[ROW][C]5[/C][C]-0.01232[/C][C]-0.0954[/C][C]0.462145[/C][/ROW]
[ROW][C]6[/C][C]0.023493[/C][C]0.182[/C][C]0.428107[/C][/ROW]
[ROW][C]7[/C][C]0.063639[/C][C]0.4929[/C][C]0.311925[/C][/ROW]
[ROW][C]8[/C][C]-0.075881[/C][C]-0.5878[/C][C]0.279446[/C][/ROW]
[ROW][C]9[/C][C]-0.061539[/C][C]-0.4767[/C][C]0.317661[/C][/ROW]
[ROW][C]10[/C][C]-0.044208[/C][C]-0.3424[/C][C]0.366611[/C][/ROW]
[ROW][C]11[/C][C]-0.015894[/C][C]-0.1231[/C][C]0.451215[/C][/ROW]
[ROW][C]12[/C][C]-0.040686[/C][C]-0.3152[/C][C]0.37687[/C][/ROW]
[ROW][C]13[/C][C]-0.006221[/C][C]-0.0482[/C][C]0.480864[/C][/ROW]
[ROW][C]14[/C][C]0.010921[/C][C]0.0846[/C][C]0.466434[/C][/ROW]
[ROW][C]15[/C][C]-0.095266[/C][C]-0.7379[/C][C]0.231718[/C][/ROW]
[ROW][C]16[/C][C]0.030044[/C][C]0.2327[/C][C]0.408386[/C][/ROW]
[ROW][C]17[/C][C]-0.035532[/C][C]-0.2752[/C][C]0.392042[/C][/ROW]
[ROW][C]18[/C][C]-0.066034[/C][C]-0.5115[/C][C]0.30544[/C][/ROW]
[ROW][C]19[/C][C]-0.093968[/C][C]-0.7279[/C][C]0.234762[/C][/ROW]
[ROW][C]20[/C][C]-0.065394[/C][C]-0.5065[/C][C]0.307166[/C][/ROW]
[ROW][C]21[/C][C]-0.061832[/C][C]-0.4789[/C][C]0.316859[/C][/ROW]
[ROW][C]22[/C][C]-0.044763[/C][C]-0.3467[/C][C]0.365004[/C][/ROW]
[ROW][C]23[/C][C]-0.030113[/C][C]-0.2333[/C][C]0.40818[/C][/ROW]
[ROW][C]24[/C][C]-0.014458[/C][C]-0.112[/C][C]0.455601[/C][/ROW]
[ROW][C]25[/C][C]0.092822[/C][C]0.719[/C][C]0.237468[/C][/ROW]
[ROW][C]26[/C][C]0.076568[/C][C]0.5931[/C][C]0.277675[/C][/ROW]
[ROW][C]27[/C][C]-0.001303[/C][C]-0.0101[/C][C]0.495991[/C][/ROW]
[ROW][C]28[/C][C]-0.046523[/C][C]-0.3604[/C][C]0.35992[/C][/ROW]
[ROW][C]29[/C][C]-0.100643[/C][C]-0.7796[/C][C]0.219352[/C][/ROW]
[ROW][C]30[/C][C]0.031261[/C][C]0.2421[/C][C]0.404747[/C][/ROW]
[ROW][C]31[/C][C]-0.18623[/C][C]-1.4425[/C][C]0.077177[/C][/ROW]
[ROW][C]32[/C][C]0.022222[/C][C]0.1721[/C][C]0.431956[/C][/ROW]
[ROW][C]33[/C][C]-0.006276[/C][C]-0.0486[/C][C]0.480696[/C][/ROW]
[ROW][C]34[/C][C]0.005097[/C][C]0.0395[/C][C]0.48432[/C][/ROW]
[ROW][C]35[/C][C]-0.040559[/C][C]-0.3142[/C][C]0.37724[/C][/ROW]
[ROW][C]36[/C][C]0.013291[/C][C]0.103[/C][C]0.459172[/C][/ROW]
[ROW][C]37[/C][C]0.051415[/C][C]0.3983[/C][C]0.345928[/C][/ROW]
[ROW][C]38[/C][C]-0.002953[/C][C]-0.0229[/C][C]0.490914[/C][/ROW]
[ROW][C]39[/C][C]-0.042376[/C][C]-0.3282[/C][C]0.371936[/C][/ROW]
[ROW][C]40[/C][C]0.010345[/C][C]0.0801[/C][C]0.4682[/C][/ROW]
[ROW][C]41[/C][C]0.050226[/C][C]0.389[/C][C]0.34931[/C][/ROW]
[ROW][C]42[/C][C]0.004061[/C][C]0.0315[/C][C]0.487506[/C][/ROW]
[ROW][C]43[/C][C]0.001991[/C][C]0.0154[/C][C]0.493874[/C][/ROW]
[ROW][C]44[/C][C]-0.018375[/C][C]-0.1423[/C][C]0.443648[/C][/ROW]
[ROW][C]45[/C][C]0.004735[/C][C]0.0367[/C][C]0.485432[/C][/ROW]
[ROW][C]46[/C][C]0.014871[/C][C]0.1152[/C][C]0.454339[/C][/ROW]
[ROW][C]47[/C][C]-0.013086[/C][C]-0.1014[/C][C]0.459799[/C][/ROW]
[ROW][C]48[/C][C]0.019213[/C][C]0.1488[/C][C]0.441095[/C][/ROW]
[/TABLE]
Source: https://freestatistics.org/blog/index.php?pk=287435&T=2

Globally Unique Identifier (entire table): ba.freestatistics.org/blog/index.php?pk=287435&T=2

As an alternative you can also use a QR Code:  

The GUIDs for individual cells are displayed in the table below:

Partial Autocorrelation Function
Time lag kPACF(k)T-STATP-value
10.9597397.43410
2-0.109002-0.84430.20092
3-0.100576-0.77910.219504
4-0.063915-0.49510.311175
5-0.01232-0.09540.462145
60.0234930.1820.428107
70.0636390.49290.311925
8-0.075881-0.58780.279446
9-0.061539-0.47670.317661
10-0.044208-0.34240.366611
11-0.015894-0.12310.451215
12-0.040686-0.31520.37687
13-0.006221-0.04820.480864
140.0109210.08460.466434
15-0.095266-0.73790.231718
160.0300440.23270.408386
17-0.035532-0.27520.392042
18-0.066034-0.51150.30544
19-0.093968-0.72790.234762
20-0.065394-0.50650.307166
21-0.061832-0.47890.316859
22-0.044763-0.34670.365004
23-0.030113-0.23330.40818
24-0.014458-0.1120.455601
250.0928220.7190.237468
260.0765680.59310.277675
27-0.001303-0.01010.495991
28-0.046523-0.36040.35992
29-0.100643-0.77960.219352
300.0312610.24210.404747
31-0.18623-1.44250.077177
320.0222220.17210.431956
33-0.006276-0.04860.480696
340.0050970.03950.48432
35-0.040559-0.31420.37724
360.0132910.1030.459172
370.0514150.39830.345928
38-0.002953-0.02290.490914
39-0.042376-0.32820.371936
400.0103450.08010.4682
410.0502260.3890.34931
420.0040610.03150.487506
430.0019910.01540.493874
44-0.018375-0.14230.443648
450.0047350.03670.485432
460.0148710.11520.454339
47-0.013086-0.10140.459799
480.0192130.14880.441095


Parameters (Session):
par1 = 48 ; par2 = 1 ; par3 = 0 ; par4 = 0 ; par5 = 12 ; par6 = White Noise ; par7 = 0.95 ;
Parameters (R input):
par1 = 48 ; par2 = 1 ; par3 = 0 ; par4 = 0 ; par5 = 12 ; par6 = White Noise ; par7 = 0.95 ; par8 = ;
R code (references can be found in the software module):
if (par1 == 'Default') {
par1 = 10*log10(length(x))
} else {
par1 <- as.numeric(par1)
}
par2 <- as.numeric(par2)
par3 <- as.numeric(par3)
par4 <- as.numeric(par4)
par5 <- as.numeric(par5)
if (par6 == 'White Noise') par6 <- 'white' else par6 <- 'ma'
par7 <- as.numeric(par7)
if (par8 != '') par8 <- as.numeric(par8)
x <- na.omit(x)
ox <- x
if (par8 == '') {
if (par2 == 0) {
x <- log(x)
} else {
x <- (x ^ par2 - 1) / par2
}
} else {
x <- log(x,base=par8)
}
if (par3 > 0) x <- diff(x,lag=1,difference=par3)
if (par4 > 0) x <- diff(x,lag=par5,difference=par4)
bitmap(file='picts.png')
op <- par(mfrow=c(2,1))
plot(ox,type='l',main='Original Time Series',xlab='time',ylab='value')
if (par8=='') {
mytitle <- paste('Working Time Series (lambda=',par2,', d=',par3,', D=',par4,')',sep='')
mysub <- paste('(lambda=',par2,', d=',par3,', D=',par4,', CI=', par7, ', CI type=',par6,')',sep='')
} else {
mytitle <- paste('Working Time Series (base=',par8,', d=',par3,', D=',par4,')',sep='')
mysub <- paste('(base=',par8,', d=',par3,', D=',par4,', CI=', par7, ', CI type=',par6,')',sep='')
}
plot(x,type='l', main=mytitle,xlab='time',ylab='value')
par(op)
dev.off()
bitmap(file='pic1.png')
racf <- acf(x, par1, main='Autocorrelation', xlab='time lag', ylab='ACF', ci.type=par6, ci=par7, sub=mysub)
dev.off()
bitmap(file='pic2.png')
rpacf <- pacf(x,par1,main='Partial Autocorrelation',xlab='lags',ylab='PACF',sub=mysub)
dev.off()
(myacf <- c(racf$acf))
(mypacf <- c(rpacf$acf))
lengthx <- length(x)
sqrtn <- sqrt(lengthx)
load(file='createtable')
a<-table.start()
a<-table.row.start(a)
a<-table.element(a,'Autocorrelation Function',4,TRUE)
a<-table.row.end(a)
a<-table.row.start(a)
a<-table.element(a,'Time lag k',header=TRUE)
a<-table.element(a,hyperlink('basics.htm','ACF(k)','click here for more information about the Autocorrelation Function'),header=TRUE)
a<-table.element(a,'T-STAT',header=TRUE)
a<-table.element(a,'P-value',header=TRUE)
a<-table.row.end(a)
for (i in 2:(par1+1)) {
a<-table.row.start(a)
a<-table.element(a,i-1,header=TRUE)
a<-table.element(a,round(myacf[i],6))
mytstat <- myacf[i]*sqrtn
a<-table.element(a,round(mytstat,4))
a<-table.element(a,round(1-pt(abs(mytstat),lengthx),6))
a<-table.row.end(a)
}
a<-table.end(a)
table.save(a,file='mytable.tab')
a<-table.start()
a<-table.row.start(a)
a<-table.element(a,'Partial Autocorrelation Function',4,TRUE)
a<-table.row.end(a)
a<-table.row.start(a)
a<-table.element(a,'Time lag k',header=TRUE)
a<-table.element(a,hyperlink('basics.htm','PACF(k)','click here for more information about the Partial Autocorrelation Function'),header=TRUE)
a<-table.element(a,'T-STAT',header=TRUE)
a<-table.element(a,'P-value',header=TRUE)
a<-table.row.end(a)
for (i in 1:par1) {
a<-table.row.start(a)
a<-table.element(a,i,header=TRUE)
a<-table.element(a,round(mypacf[i],6))
mytstat <- mypacf[i]*sqrtn
a<-table.element(a,round(mytstat,4))
a<-table.element(a,round(1-pt(abs(mytstat),lengthx),6))
a<-table.row.end(a)
}
a<-table.end(a)
table.save(a,file='mytable1.tab')