Free Statistics

of Irreproducible Research!

Author's title

Author*Unverified author*
R Software Modulerwasp_exponentialsmoothing.wasp
Title produced by softwareExponential Smoothing
Date of computationFri, 08 Jan 2016 21:31:51 +0000
Cite this page as followsStatistical Computations at FreeStatistics.org, Office for Research Development and Education, URL https://freestatistics.org/blog/index.php?v=date/2016/Jan/08/t1452288756gk8kxkescoo75z6.htm/, Retrieved Sun, 28 Apr 2024 11:42:31 +0000
Statistical Computations at FreeStatistics.org, Office for Research Development and Education, URL https://freestatistics.org/blog/index.php?pk=287441, Retrieved Sun, 28 Apr 2024 11:42:31 +0000
QR Codes:

Original text written by user:
IsPrivate?No (this computation is public)
User-defined keywords
Estimated Impact145
Family? (F = Feedback message, R = changed R code, M = changed R Module, P = changed Parameters, D = changed Data)
-       [Exponential Smoothing] [] [2016-01-08 21:31:51] [f684f3a3d8618606ffff76ddc8e0eec7] [Current]
Feedback Forum

Post a new message
Dataseries X:
94,9
95,8
98,8
100,6
100,6
100,1
99,4
99,9
101
100,4
101,6
106,8
109,3
112,6
118,8
121,9
118,3
117,9
119,2
116,3
119,2
118,7
120,3
120,5
124,3
128,3
131,4
130,3
126,6
121,8
125,1
128,5
129,5
128,5
127,2
126,2
125,9
127,3
125,7
122,5
121,3
121,5
123,4
121,6
121,8
118,9
118,7
119,8
118,5
118,9
117,4
116
115,5
116,5
114,9
113,9
114,3
112
108
97,7


Summary of computational transaction
Raw Inputview raw input (R code)
Raw Outputview raw output of R engine
Computing time2 seconds
R Server'Herman Ole Andreas Wold' @ wold.wessa.net

\begin{tabular}{lllllllll}
\hline
Summary of computational transaction \tabularnewline
Raw Input & view raw input (R code)  \tabularnewline
Raw Output & view raw output of R engine  \tabularnewline
Computing time & 2 seconds \tabularnewline
R Server & 'Herman Ole Andreas Wold' @ wold.wessa.net \tabularnewline
\hline
\end{tabular}
%Source: https://freestatistics.org/blog/index.php?pk=287441&T=0

[TABLE]
[ROW][C]Summary of computational transaction[/C][/ROW]
[ROW][C]Raw Input[/C][C]view raw input (R code) [/C][/ROW]
[ROW][C]Raw Output[/C][C]view raw output of R engine [/C][/ROW]
[ROW][C]Computing time[/C][C]2 seconds[/C][/ROW]
[ROW][C]R Server[/C][C]'Herman Ole Andreas Wold' @ wold.wessa.net[/C][/ROW]
[/TABLE]
Source: https://freestatistics.org/blog/index.php?pk=287441&T=0

Globally Unique Identifier (entire table): ba.freestatistics.org/blog/index.php?pk=287441&T=0

As an alternative you can also use a QR Code:  

The GUIDs for individual cells are displayed in the table below:

Summary of computational transaction
Raw Inputview raw input (R code)
Raw Outputview raw output of R engine
Computing time2 seconds
R Server'Herman Ole Andreas Wold' @ wold.wessa.net


Estimated Parameters of Exponential Smoothing
ParameterValue
alpha0.810052871424287
beta0.112041102416804
gamma1

\begin{tabular}{lllllllll}
\hline
Estimated Parameters of Exponential Smoothing \tabularnewline
Parameter & Value \tabularnewline
alpha & 0.810052871424287 \tabularnewline
beta & 0.112041102416804 \tabularnewline
gamma & 1 \tabularnewline
\hline
\end{tabular}
%Source: https://freestatistics.org/blog/index.php?pk=287441&T=1

[TABLE]
[ROW][C]Estimated Parameters of Exponential Smoothing[/C][/ROW]
[ROW][C]Parameter[/C][C]Value[/C][/ROW]
[ROW][C]alpha[/C][C]0.810052871424287[/C][/ROW]
[ROW][C]beta[/C][C]0.112041102416804[/C][/ROW]
[ROW][C]gamma[/C][C]1[/C][/ROW]
[/TABLE]
Source: https://freestatistics.org/blog/index.php?pk=287441&T=1

Globally Unique Identifier (entire table): ba.freestatistics.org/blog/index.php?pk=287441&T=1

As an alternative you can also use a QR Code:  

The GUIDs for individual cells are displayed in the table below:

Estimated Parameters of Exponential Smoothing
ParameterValue
alpha0.810052871424287
beta0.112041102416804
gamma1


Interpolation Forecasts of Exponential Smoothing
tObservedFittedResiduals
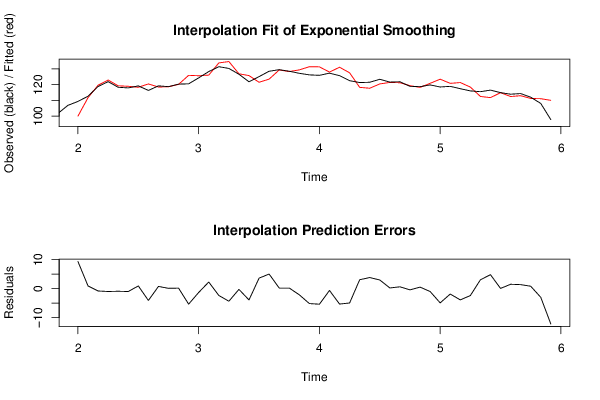
13109.399.96247329059839.33752670940166
14112.6111.6944158882290.905584111770906
15118.8119.644895944299-0.844895944298685
16121.9122.921545843788-1.02154584378835
17118.3119.24155195099-0.941551950989961
18117.9118.932569489833-1.03256948983328
19119.2118.293642811870.906357188130244
20116.3120.420109525344-4.12010952534428
21119.2118.4676011977540.732398802246351
22118.7118.6248531161640.0751468838358704
23120.3120.1523498364670.147650163532958
24120.5125.897811993202-5.39781199320197
25124.3125.647391804389-1.34739180438866
26128.3126.0388115573522.26118844264842
27131.4133.794387084249-2.39438708424862
28130.3134.681165443576-4.38116544357609
29126.6126.888832562101-0.288832562100581
30121.8125.744475001259-3.94447500125861
31125.1121.5039383993013.59606160069885
32128.5123.4874543839295.01254561607144
33129.5129.3164816354630.183518364537292
34128.5128.3163343408580.183665659142008
35127.2129.367423951812-2.16742395181178
36126.2131.396009902493-5.19600990249329
37125.9131.308542002734-5.40854200273407
38127.3127.957184263002-0.657184263001838
39125.7131.061070606307-5.36107060630745
40122.5127.494701952473-4.99470195247305
41121.3118.2544211842313.04557881576915
42121.5117.6910851590133.80891484098684
43123.4120.4415499354762.95845006452427
44121.6121.3977972101390.202202789860948
45121.8121.1965229097860.60347709021363
46118.9119.358297817247-0.458297817247072
47118.7118.2062217001550.493778299844621
48119.8120.820220953154-1.02022095315432
49118.5123.45895433627-4.95895433627004
50118.9120.799058676844-1.89905867684394
51117.4121.315525372765-3.91552537276519
52116118.43296600463-2.43296600463005
53115.5112.4708067344343.02919326556629
54116.5111.7134555864454.78654441355458
55114.9114.8573021104630.0426978895368819
56113.9112.4264567717191.4735432282809
57114.3112.9450042713481.35499572865221
58112111.195823084080.804176915920223
59108111.043798761383-3.04379876138312
6097.7109.980062411142-12.2800624111421

\begin{tabular}{lllllllll}
\hline
Interpolation Forecasts of Exponential Smoothing \tabularnewline
t & Observed & Fitted & Residuals \tabularnewline
13 & 109.3 & 99.9624732905983 & 9.33752670940166 \tabularnewline
14 & 112.6 & 111.694415888229 & 0.905584111770906 \tabularnewline
15 & 118.8 & 119.644895944299 & -0.844895944298685 \tabularnewline
16 & 121.9 & 122.921545843788 & -1.02154584378835 \tabularnewline
17 & 118.3 & 119.24155195099 & -0.941551950989961 \tabularnewline
18 & 117.9 & 118.932569489833 & -1.03256948983328 \tabularnewline
19 & 119.2 & 118.29364281187 & 0.906357188130244 \tabularnewline
20 & 116.3 & 120.420109525344 & -4.12010952534428 \tabularnewline
21 & 119.2 & 118.467601197754 & 0.732398802246351 \tabularnewline
22 & 118.7 & 118.624853116164 & 0.0751468838358704 \tabularnewline
23 & 120.3 & 120.152349836467 & 0.147650163532958 \tabularnewline
24 & 120.5 & 125.897811993202 & -5.39781199320197 \tabularnewline
25 & 124.3 & 125.647391804389 & -1.34739180438866 \tabularnewline
26 & 128.3 & 126.038811557352 & 2.26118844264842 \tabularnewline
27 & 131.4 & 133.794387084249 & -2.39438708424862 \tabularnewline
28 & 130.3 & 134.681165443576 & -4.38116544357609 \tabularnewline
29 & 126.6 & 126.888832562101 & -0.288832562100581 \tabularnewline
30 & 121.8 & 125.744475001259 & -3.94447500125861 \tabularnewline
31 & 125.1 & 121.503938399301 & 3.59606160069885 \tabularnewline
32 & 128.5 & 123.487454383929 & 5.01254561607144 \tabularnewline
33 & 129.5 & 129.316481635463 & 0.183518364537292 \tabularnewline
34 & 128.5 & 128.316334340858 & 0.183665659142008 \tabularnewline
35 & 127.2 & 129.367423951812 & -2.16742395181178 \tabularnewline
36 & 126.2 & 131.396009902493 & -5.19600990249329 \tabularnewline
37 & 125.9 & 131.308542002734 & -5.40854200273407 \tabularnewline
38 & 127.3 & 127.957184263002 & -0.657184263001838 \tabularnewline
39 & 125.7 & 131.061070606307 & -5.36107060630745 \tabularnewline
40 & 122.5 & 127.494701952473 & -4.99470195247305 \tabularnewline
41 & 121.3 & 118.254421184231 & 3.04557881576915 \tabularnewline
42 & 121.5 & 117.691085159013 & 3.80891484098684 \tabularnewline
43 & 123.4 & 120.441549935476 & 2.95845006452427 \tabularnewline
44 & 121.6 & 121.397797210139 & 0.202202789860948 \tabularnewline
45 & 121.8 & 121.196522909786 & 0.60347709021363 \tabularnewline
46 & 118.9 & 119.358297817247 & -0.458297817247072 \tabularnewline
47 & 118.7 & 118.206221700155 & 0.493778299844621 \tabularnewline
48 & 119.8 & 120.820220953154 & -1.02022095315432 \tabularnewline
49 & 118.5 & 123.45895433627 & -4.95895433627004 \tabularnewline
50 & 118.9 & 120.799058676844 & -1.89905867684394 \tabularnewline
51 & 117.4 & 121.315525372765 & -3.91552537276519 \tabularnewline
52 & 116 & 118.43296600463 & -2.43296600463005 \tabularnewline
53 & 115.5 & 112.470806734434 & 3.02919326556629 \tabularnewline
54 & 116.5 & 111.713455586445 & 4.78654441355458 \tabularnewline
55 & 114.9 & 114.857302110463 & 0.0426978895368819 \tabularnewline
56 & 113.9 & 112.426456771719 & 1.4735432282809 \tabularnewline
57 & 114.3 & 112.945004271348 & 1.35499572865221 \tabularnewline
58 & 112 & 111.19582308408 & 0.804176915920223 \tabularnewline
59 & 108 & 111.043798761383 & -3.04379876138312 \tabularnewline
60 & 97.7 & 109.980062411142 & -12.2800624111421 \tabularnewline
\hline
\end{tabular}
%Source: https://freestatistics.org/blog/index.php?pk=287441&T=2

[TABLE]
[ROW][C]Interpolation Forecasts of Exponential Smoothing[/C][/ROW]
[ROW][C]t[/C][C]Observed[/C][C]Fitted[/C][C]Residuals[/C][/ROW]
[ROW][C]13[/C][C]109.3[/C][C]99.9624732905983[/C][C]9.33752670940166[/C][/ROW]
[ROW][C]14[/C][C]112.6[/C][C]111.694415888229[/C][C]0.905584111770906[/C][/ROW]
[ROW][C]15[/C][C]118.8[/C][C]119.644895944299[/C][C]-0.844895944298685[/C][/ROW]
[ROW][C]16[/C][C]121.9[/C][C]122.921545843788[/C][C]-1.02154584378835[/C][/ROW]
[ROW][C]17[/C][C]118.3[/C][C]119.24155195099[/C][C]-0.941551950989961[/C][/ROW]
[ROW][C]18[/C][C]117.9[/C][C]118.932569489833[/C][C]-1.03256948983328[/C][/ROW]
[ROW][C]19[/C][C]119.2[/C][C]118.29364281187[/C][C]0.906357188130244[/C][/ROW]
[ROW][C]20[/C][C]116.3[/C][C]120.420109525344[/C][C]-4.12010952534428[/C][/ROW]
[ROW][C]21[/C][C]119.2[/C][C]118.467601197754[/C][C]0.732398802246351[/C][/ROW]
[ROW][C]22[/C][C]118.7[/C][C]118.624853116164[/C][C]0.0751468838358704[/C][/ROW]
[ROW][C]23[/C][C]120.3[/C][C]120.152349836467[/C][C]0.147650163532958[/C][/ROW]
[ROW][C]24[/C][C]120.5[/C][C]125.897811993202[/C][C]-5.39781199320197[/C][/ROW]
[ROW][C]25[/C][C]124.3[/C][C]125.647391804389[/C][C]-1.34739180438866[/C][/ROW]
[ROW][C]26[/C][C]128.3[/C][C]126.038811557352[/C][C]2.26118844264842[/C][/ROW]
[ROW][C]27[/C][C]131.4[/C][C]133.794387084249[/C][C]-2.39438708424862[/C][/ROW]
[ROW][C]28[/C][C]130.3[/C][C]134.681165443576[/C][C]-4.38116544357609[/C][/ROW]
[ROW][C]29[/C][C]126.6[/C][C]126.888832562101[/C][C]-0.288832562100581[/C][/ROW]
[ROW][C]30[/C][C]121.8[/C][C]125.744475001259[/C][C]-3.94447500125861[/C][/ROW]
[ROW][C]31[/C][C]125.1[/C][C]121.503938399301[/C][C]3.59606160069885[/C][/ROW]
[ROW][C]32[/C][C]128.5[/C][C]123.487454383929[/C][C]5.01254561607144[/C][/ROW]
[ROW][C]33[/C][C]129.5[/C][C]129.316481635463[/C][C]0.183518364537292[/C][/ROW]
[ROW][C]34[/C][C]128.5[/C][C]128.316334340858[/C][C]0.183665659142008[/C][/ROW]
[ROW][C]35[/C][C]127.2[/C][C]129.367423951812[/C][C]-2.16742395181178[/C][/ROW]
[ROW][C]36[/C][C]126.2[/C][C]131.396009902493[/C][C]-5.19600990249329[/C][/ROW]
[ROW][C]37[/C][C]125.9[/C][C]131.308542002734[/C][C]-5.40854200273407[/C][/ROW]
[ROW][C]38[/C][C]127.3[/C][C]127.957184263002[/C][C]-0.657184263001838[/C][/ROW]
[ROW][C]39[/C][C]125.7[/C][C]131.061070606307[/C][C]-5.36107060630745[/C][/ROW]
[ROW][C]40[/C][C]122.5[/C][C]127.494701952473[/C][C]-4.99470195247305[/C][/ROW]
[ROW][C]41[/C][C]121.3[/C][C]118.254421184231[/C][C]3.04557881576915[/C][/ROW]
[ROW][C]42[/C][C]121.5[/C][C]117.691085159013[/C][C]3.80891484098684[/C][/ROW]
[ROW][C]43[/C][C]123.4[/C][C]120.441549935476[/C][C]2.95845006452427[/C][/ROW]
[ROW][C]44[/C][C]121.6[/C][C]121.397797210139[/C][C]0.202202789860948[/C][/ROW]
[ROW][C]45[/C][C]121.8[/C][C]121.196522909786[/C][C]0.60347709021363[/C][/ROW]
[ROW][C]46[/C][C]118.9[/C][C]119.358297817247[/C][C]-0.458297817247072[/C][/ROW]
[ROW][C]47[/C][C]118.7[/C][C]118.206221700155[/C][C]0.493778299844621[/C][/ROW]
[ROW][C]48[/C][C]119.8[/C][C]120.820220953154[/C][C]-1.02022095315432[/C][/ROW]
[ROW][C]49[/C][C]118.5[/C][C]123.45895433627[/C][C]-4.95895433627004[/C][/ROW]
[ROW][C]50[/C][C]118.9[/C][C]120.799058676844[/C][C]-1.89905867684394[/C][/ROW]
[ROW][C]51[/C][C]117.4[/C][C]121.315525372765[/C][C]-3.91552537276519[/C][/ROW]
[ROW][C]52[/C][C]116[/C][C]118.43296600463[/C][C]-2.43296600463005[/C][/ROW]
[ROW][C]53[/C][C]115.5[/C][C]112.470806734434[/C][C]3.02919326556629[/C][/ROW]
[ROW][C]54[/C][C]116.5[/C][C]111.713455586445[/C][C]4.78654441355458[/C][/ROW]
[ROW][C]55[/C][C]114.9[/C][C]114.857302110463[/C][C]0.0426978895368819[/C][/ROW]
[ROW][C]56[/C][C]113.9[/C][C]112.426456771719[/C][C]1.4735432282809[/C][/ROW]
[ROW][C]57[/C][C]114.3[/C][C]112.945004271348[/C][C]1.35499572865221[/C][/ROW]
[ROW][C]58[/C][C]112[/C][C]111.19582308408[/C][C]0.804176915920223[/C][/ROW]
[ROW][C]59[/C][C]108[/C][C]111.043798761383[/C][C]-3.04379876138312[/C][/ROW]
[ROW][C]60[/C][C]97.7[/C][C]109.980062411142[/C][C]-12.2800624111421[/C][/ROW]
[/TABLE]
Source: https://freestatistics.org/blog/index.php?pk=287441&T=2

Globally Unique Identifier (entire table): ba.freestatistics.org/blog/index.php?pk=287441&T=2

As an alternative you can also use a QR Code:  

The GUIDs for individual cells are displayed in the table below:

Interpolation Forecasts of Exponential Smoothing
tObservedFittedResiduals
13109.399.96247329059839.33752670940166
14112.6111.6944158882290.905584111770906
15118.8119.644895944299-0.844895944298685
16121.9122.921545843788-1.02154584378835
17118.3119.24155195099-0.941551950989961
18117.9118.932569489833-1.03256948983328
19119.2118.293642811870.906357188130244
20116.3120.420109525344-4.12010952534428
21119.2118.4676011977540.732398802246351
22118.7118.6248531161640.0751468838358704
23120.3120.1523498364670.147650163532958
24120.5125.897811993202-5.39781199320197
25124.3125.647391804389-1.34739180438866
26128.3126.0388115573522.26118844264842
27131.4133.794387084249-2.39438708424862
28130.3134.681165443576-4.38116544357609
29126.6126.888832562101-0.288832562100581
30121.8125.744475001259-3.94447500125861
31125.1121.5039383993013.59606160069885
32128.5123.4874543839295.01254561607144
33129.5129.3164816354630.183518364537292
34128.5128.3163343408580.183665659142008
35127.2129.367423951812-2.16742395181178
36126.2131.396009902493-5.19600990249329
37125.9131.308542002734-5.40854200273407
38127.3127.957184263002-0.657184263001838
39125.7131.061070606307-5.36107060630745
40122.5127.494701952473-4.99470195247305
41121.3118.2544211842313.04557881576915
42121.5117.6910851590133.80891484098684
43123.4120.4415499354762.95845006452427
44121.6121.3977972101390.202202789860948
45121.8121.1965229097860.60347709021363
46118.9119.358297817247-0.458297817247072
47118.7118.2062217001550.493778299844621
48119.8120.820220953154-1.02022095315432
49118.5123.45895433627-4.95895433627004
50118.9120.799058676844-1.89905867684394
51117.4121.315525372765-3.91552537276519
52116118.43296600463-2.43296600463005
53115.5112.4708067344343.02919326556629
54116.5111.7134555864454.78654441355458
55114.9114.8573021104630.0426978895368819
56113.9112.4264567717191.4735432282809
57114.3112.9450042713481.35499572865221
58112111.195823084080.804176915920223
59108111.043798761383-3.04379876138312
6097.7109.980062411142-12.2800624111421


Extrapolation Forecasts of Exponential Smoothing
tForecast95% Lower Bound95% Upper Bound
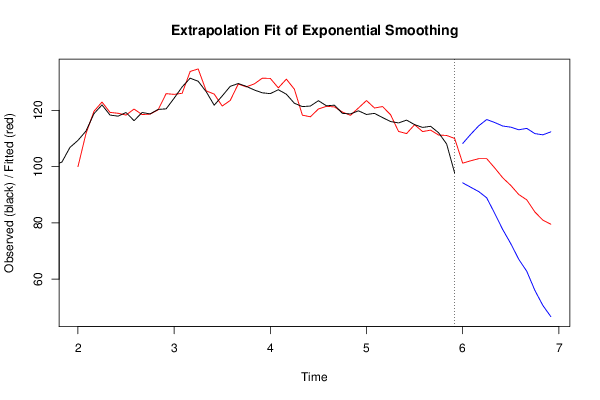
61101.20311206571694.2170250817128108.189199049718
62102.04505508388892.6424401039959111.447670063781
63102.79279981725991.1139593259374114.47164030858
64102.79496309333488.8820951302154116.707831056453
6599.493302657321783.3461372404855115.640468074158
6695.993167669673277.5896754286214114.396659910725
6793.301376158582472.6073029662709113.995449350894
6890.046649045267667.0205028155618113.072795274973
6988.154214045210362.7501040489552113.558324041465
7083.884993055035656.0543464196252111.715639690446
7180.959849344429850.6524951899053111.267203498954
7279.492820316010846.6576970615419112.32794357048

\begin{tabular}{lllllllll}
\hline
Extrapolation Forecasts of Exponential Smoothing \tabularnewline
t & Forecast & 95% Lower Bound & 95% Upper Bound \tabularnewline
61 & 101.203112065716 & 94.2170250817128 & 108.189199049718 \tabularnewline
62 & 102.045055083888 & 92.6424401039959 & 111.447670063781 \tabularnewline
63 & 102.792799817259 & 91.1139593259374 & 114.47164030858 \tabularnewline
64 & 102.794963093334 & 88.8820951302154 & 116.707831056453 \tabularnewline
65 & 99.4933026573217 & 83.3461372404855 & 115.640468074158 \tabularnewline
66 & 95.9931676696732 & 77.5896754286214 & 114.396659910725 \tabularnewline
67 & 93.3013761585824 & 72.6073029662709 & 113.995449350894 \tabularnewline
68 & 90.0466490452676 & 67.0205028155618 & 113.072795274973 \tabularnewline
69 & 88.1542140452103 & 62.7501040489552 & 113.558324041465 \tabularnewline
70 & 83.8849930550356 & 56.0543464196252 & 111.715639690446 \tabularnewline
71 & 80.9598493444298 & 50.6524951899053 & 111.267203498954 \tabularnewline
72 & 79.4928203160108 & 46.6576970615419 & 112.32794357048 \tabularnewline
\hline
\end{tabular}
%Source: https://freestatistics.org/blog/index.php?pk=287441&T=3

[TABLE]
[ROW][C]Extrapolation Forecasts of Exponential Smoothing[/C][/ROW]
[ROW][C]t[/C][C]Forecast[/C][C]95% Lower Bound[/C][C]95% Upper Bound[/C][/ROW]
[ROW][C]61[/C][C]101.203112065716[/C][C]94.2170250817128[/C][C]108.189199049718[/C][/ROW]
[ROW][C]62[/C][C]102.045055083888[/C][C]92.6424401039959[/C][C]111.447670063781[/C][/ROW]
[ROW][C]63[/C][C]102.792799817259[/C][C]91.1139593259374[/C][C]114.47164030858[/C][/ROW]
[ROW][C]64[/C][C]102.794963093334[/C][C]88.8820951302154[/C][C]116.707831056453[/C][/ROW]
[ROW][C]65[/C][C]99.4933026573217[/C][C]83.3461372404855[/C][C]115.640468074158[/C][/ROW]
[ROW][C]66[/C][C]95.9931676696732[/C][C]77.5896754286214[/C][C]114.396659910725[/C][/ROW]
[ROW][C]67[/C][C]93.3013761585824[/C][C]72.6073029662709[/C][C]113.995449350894[/C][/ROW]
[ROW][C]68[/C][C]90.0466490452676[/C][C]67.0205028155618[/C][C]113.072795274973[/C][/ROW]
[ROW][C]69[/C][C]88.1542140452103[/C][C]62.7501040489552[/C][C]113.558324041465[/C][/ROW]
[ROW][C]70[/C][C]83.8849930550356[/C][C]56.0543464196252[/C][C]111.715639690446[/C][/ROW]
[ROW][C]71[/C][C]80.9598493444298[/C][C]50.6524951899053[/C][C]111.267203498954[/C][/ROW]
[ROW][C]72[/C][C]79.4928203160108[/C][C]46.6576970615419[/C][C]112.32794357048[/C][/ROW]
[/TABLE]
Source: https://freestatistics.org/blog/index.php?pk=287441&T=3

Globally Unique Identifier (entire table): ba.freestatistics.org/blog/index.php?pk=287441&T=3

As an alternative you can also use a QR Code:  

The GUIDs for individual cells are displayed in the table below:

Extrapolation Forecasts of Exponential Smoothing
tForecast95% Lower Bound95% Upper Bound
61101.20311206571694.2170250817128108.189199049718
62102.04505508388892.6424401039959111.447670063781
63102.79279981725991.1139593259374114.47164030858
64102.79496309333488.8820951302154116.707831056453
6599.493302657321783.3461372404855115.640468074158
6695.993167669673277.5896754286214114.396659910725
6793.301376158582472.6073029662709113.995449350894
6890.046649045267667.0205028155618113.072795274973
6988.154214045210362.7501040489552113.558324041465
7083.884993055035656.0543464196252111.715639690446
7180.959849344429850.6524951899053111.267203498954
7279.492820316010846.6576970615419112.32794357048


Parameters (Session):
par1 = 12 ; par2 = Triple ; par3 = additive ;
Parameters (R input):
par1 = 12 ; par2 = Triple ; par3 = additive ;
R code (references can be found in the software module):
par1 <- as.numeric(par1)
if (par2 == 'Single') K <- 1
if (par2 == 'Double') K <- 2
if (par2 == 'Triple') K <- par1
nx <- length(x)
nxmK <- nx - K
x <- ts(x, frequency = par1)
if (par2 == 'Single') fit <- HoltWinters(x, gamma=F, beta=F)
if (par2 == 'Double') fit <- HoltWinters(x, gamma=F)
if (par2 == 'Triple') fit <- HoltWinters(x, seasonal=par3)
fit
myresid <- x - fit$fitted[,'xhat']
bitmap(file='test1.png')
op <- par(mfrow=c(2,1))
plot(fit,ylab='Observed (black) / Fitted (red)',main='Interpolation Fit of Exponential Smoothing')
plot(myresid,ylab='Residuals',main='Interpolation Prediction Errors')
par(op)
dev.off()
bitmap(file='test2.png')
p <- predict(fit, par1, prediction.interval=TRUE)
np <- length(p[,1])
plot(fit,p,ylab='Observed (black) / Fitted (red)',main='Extrapolation Fit of Exponential Smoothing')
dev.off()
bitmap(file='test3.png')
op <- par(mfrow = c(2,2))
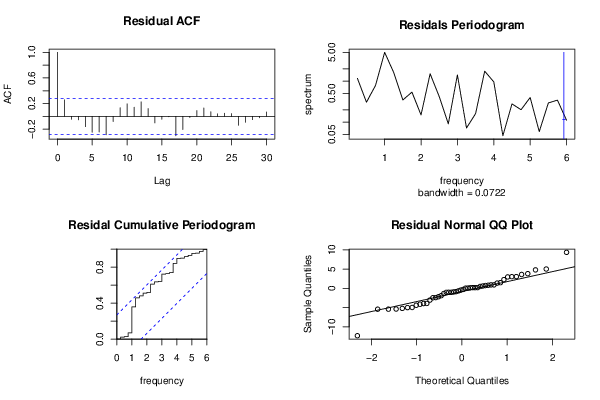
acf(as.numeric(myresid),lag.max = nx/2,main='Residual ACF')
spectrum(myresid,main='Residals Periodogram')
cpgram(myresid,main='Residal Cumulative Periodogram')
qqnorm(myresid,main='Residual Normal QQ Plot')
qqline(myresid)
par(op)
dev.off()
load(file='createtable')
a<-table.start()
a<-table.row.start(a)
a<-table.element(a,'Estimated Parameters of Exponential Smoothing',2,TRUE)
a<-table.row.end(a)
a<-table.row.start(a)
a<-table.element(a,'Parameter',header=TRUE)
a<-table.element(a,'Value',header=TRUE)
a<-table.row.end(a)
a<-table.row.start(a)
a<-table.element(a,'alpha',header=TRUE)
a<-table.element(a,fit$alpha)
a<-table.row.end(a)
a<-table.row.start(a)
a<-table.element(a,'beta',header=TRUE)
a<-table.element(a,fit$beta)
a<-table.row.end(a)
a<-table.row.start(a)
a<-table.element(a,'gamma',header=TRUE)
a<-table.element(a,fit$gamma)
a<-table.row.end(a)
a<-table.end(a)
table.save(a,file='mytable.tab')
a<-table.start()
a<-table.row.start(a)
a<-table.element(a,'Interpolation Forecasts of Exponential Smoothing',4,TRUE)
a<-table.row.end(a)
a<-table.row.start(a)
a<-table.element(a,'t',header=TRUE)
a<-table.element(a,'Observed',header=TRUE)
a<-table.element(a,'Fitted',header=TRUE)
a<-table.element(a,'Residuals',header=TRUE)
a<-table.row.end(a)
for (i in 1:nxmK) {
a<-table.row.start(a)
a<-table.element(a,i+K,header=TRUE)
a<-table.element(a,x[i+K])
a<-table.element(a,fit$fitted[i,'xhat'])
a<-table.element(a,myresid[i])
a<-table.row.end(a)
}
a<-table.end(a)
table.save(a,file='mytable1.tab')
a<-table.start()
a<-table.row.start(a)
a<-table.element(a,'Extrapolation Forecasts of Exponential Smoothing',4,TRUE)
a<-table.row.end(a)
a<-table.row.start(a)
a<-table.element(a,'t',header=TRUE)
a<-table.element(a,'Forecast',header=TRUE)
a<-table.element(a,'95% Lower Bound',header=TRUE)
a<-table.element(a,'95% Upper Bound',header=TRUE)
a<-table.row.end(a)
for (i in 1:np) {
a<-table.row.start(a)
a<-table.element(a,nx+i,header=TRUE)
a<-table.element(a,p[i,'fit'])
a<-table.element(a,p[i,'lwr'])
a<-table.element(a,p[i,'upr'])
a<-table.row.end(a)
}
a<-table.end(a)
table.save(a,file='mytable2.tab')